GALLANTT ISPAT LTDGALLANTT - The stock is currently in a rising channel pattern, with consolidation near a key resistance level forming a potential bullish flag continuation pattern. If the stock sustains above 485, it could trigger a move towards 525 and 565.
GALLANTT

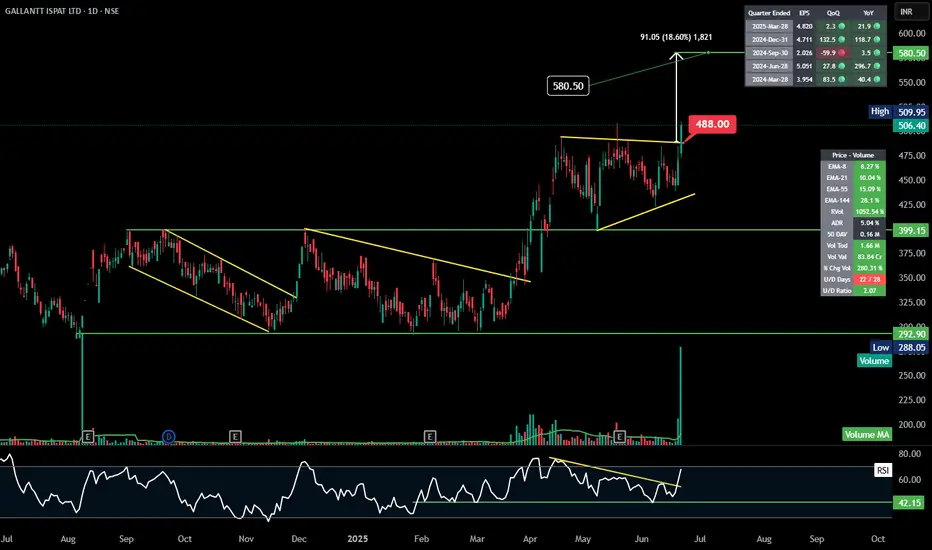
GALLANTT |Symmetrical Triangle | Daily
### 🔍 Technical Snapshot
- **Breakout Alert**: The symmetrical triangle shows a bullish breakout above ₹488, with a strong follow-through toward ₹506.40. That breakout level was respected perfectly—classic pattern behavior.
- **Target**: The projected target of ₹580.50 looks feasible based on the height of the triangle and the breakout momentum.
- **Volume Surge**: Today's volume is a whopping 1.66M—over 10x the 5-day average—with an rVol of 1052%. That kind of participation typically supports sustained momentum.
### 📉 Trend and Indicators
- **Descending Channels**: The stock escaped not one but *two* descending channels—suggesting a reversal in structure.
- **RSI at 42.15**: Room for upside. It’s not overbought, meaning there’s still breathing room for a move toward the target.
- **EMA Support**: Price is comfortably above short and long-term EMAs (8, 21, 55, 144), which is a bullish alignment.
### 🧾 Fundamental Flash
- **EPS Growth**: Consistent quarterly growth, with a standout 599.9% QoQ jump in Sep 2024. That's explosive.
- **U/D Ratio**: 22 up days out of 28 with a U/D Ratio of 2.07—implying steady buying pressure over time.
GALLANTT Breakout Possible with a good upside potentialHey Family, there is a one more stock Which is showing a great opportunity.
Key Points:-
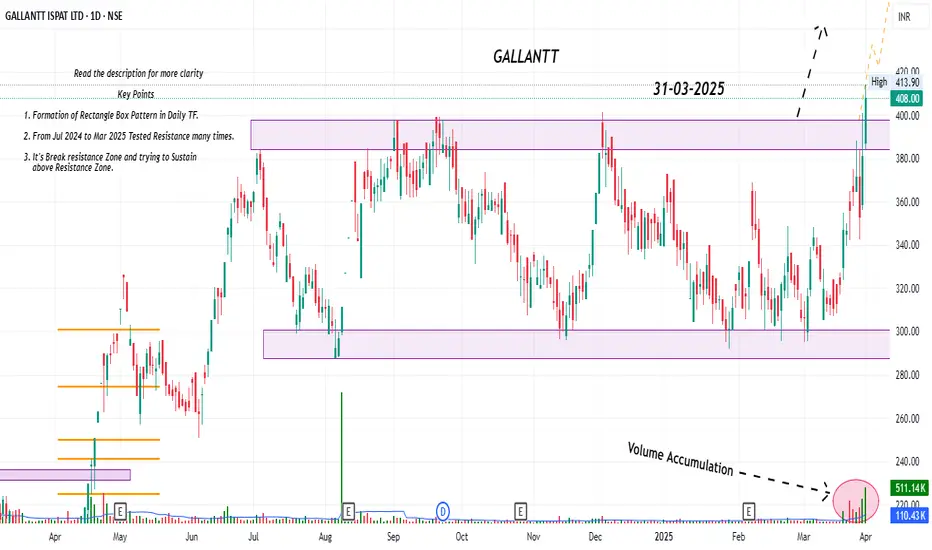
* Formation of Rectangular box Pattern in Daily TF.
* From Jul 2024 to Mar 2025 its in range.
* From Jul 2024 to Mar 2025 Tested & Moving Near Resistance Many times.
* It's Break resistance Zone and trying to sustain above Resistance Zone, Only Enter when good volume good closing.
* Volume is Rising (Volume Accumulation).
What is your view please comment it down and also boost the idea this help to motivate us. We are Certified. All views shared on this channel are my personal opinion and is shared for educational purpose and should not be considered advise of any nature.
GALLANTT - Long SetupNSE:GALLANTT
Charts are self-explanatory. Levels of breakout, possible up-moves (where stock may find resistances) and support (close below which, setup will be invalidated) are clearly defined.
Disclaimer: This is for demonstration and educational purpose only. This is not buying or selling recommendations. I am not SEBI registered. Please consult your financial advisor before taking any trade.
