Garuda Construction & Engineering Ltd (GARUDA) – TechnicalPrice Action
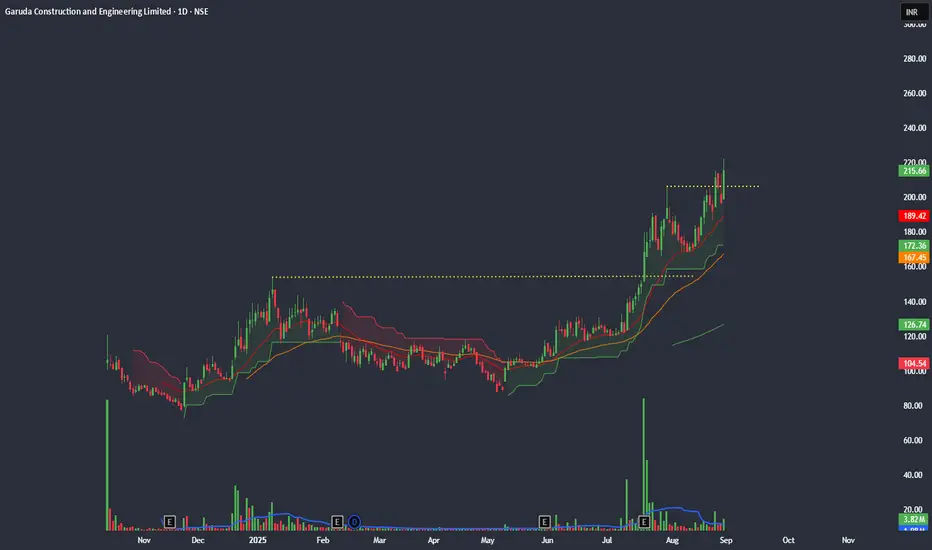
Current Price: ~₹215.5 (as of August 29, 2025)
Snapped up nearly +9–10% today, breaking to fresh 52-week highs.
Indicators & Momentum
Likely traded above major moving averages.
RSI probably in overbought territory — caution warranted.
ADX likely above 25 — confirming trend strength.
Volume spike (~3.6M shares) supports the breakout.
Chart Structure
Broke resistance at ~₹200–210; price nearing ₹222–225 zone.
Support zones:
Short-term: ₹210–212
Strong: ₹200
Upside targets: ₹225 → ₹230; potential rally to ₹240+.
Trading View
Bias: Bullish as long as price stays above ₹210.
Short-Term Target: ₹225 → ₹230
Medium-Term Target: ₹240+
Invalidation: Close below ₹200 weakens bullish thesis.
Disclaimer: This is a technical overview for informational and educational purposes only—not investment advice. Please conduct your own research before trading.
Garuda
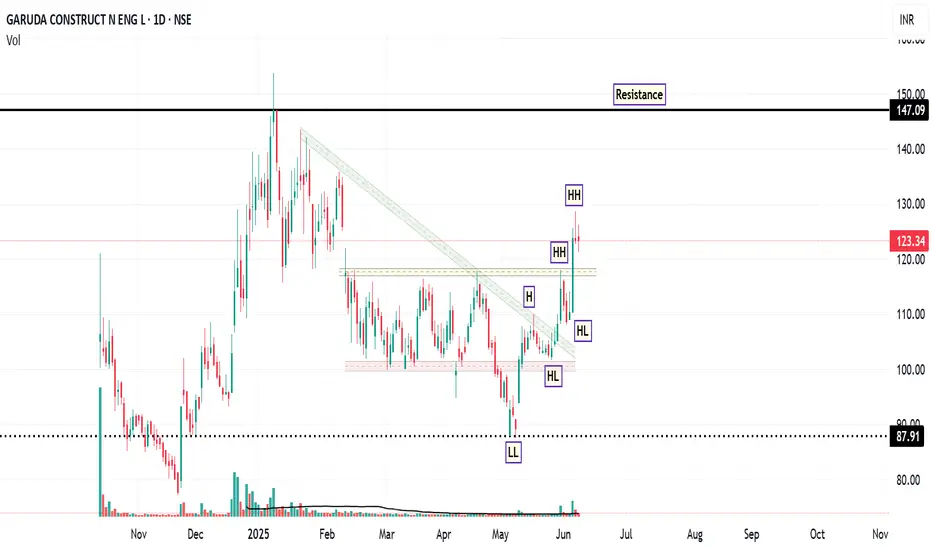
Garuda: Riding the Momentum WaveFrom February to late May 2025, the stock of GARUDA was trading in a sideways consolidation range, roughly between ₹100 (support) and ₹115-₹120 (resistance). The recent powerful green candles have shattered the upper boundary of this range. Also, the most significant event on the daily chart is the decisive breakout from a descending trendline that had capped prices. Also, LL and HH formation observed on daily chart.
The breakout was accompanied by a significant spike in volume ( 862.88K shares ), which is substantially higher than the average volume during the consolidation period. High volume on a breakout lends strong credibility to the move.
The RSI is at a strong 69.20 . It is in bullish territory and rising, indicating strong buying momentum. It is approaching the overbought region (>70), but is not there yet, leaving room for further upside before becoming extended.
If the stock consolidates above the ₹120-₹121 support level. Buyers step in on any minor dip till ₹118 , and the price then continues its upward trajectory towards the resistance targets of ₹129 and subsequently ₹149 .
Disclaimer: This technical analysis is for informational purposes only and should not be considered as financial advice. Trading in the stock market involves risk. Always conduct your own research and consult with a qualified financial advisor before making any investment decisions.
GARUDAGARUDA showing very good strength 1st time in last 5 sessions since listing. Market participation also increased. 110 is new support area. So as long as its above 110 level, it may continue momentum ride from hereon.
