GBPJPY sell active setup GBPJPY as expected running check my previous idea 💡 I link to this, TP 🎯 missed still struggling possible TP let's see 📈📉
GBPJPY

GBPJPY SellExpecting JPY index correction towards upside as well GBP futures are weak it's highly posible let's see 📈📉

GBPJPY is taking support at 210.380 As we can see market is taking support at 210.380 if it breaks it will acts as resistance zone we can sell but if it not break we can buy in same direction.
Plan your trade accordingly

GBPJPYAs you can see price is clearly in an downtrend. Nice push to the downside, and nice recovery back up. And with 4 points being made ( H,L,HL,LL) downtrend is confirmed. I marked 4H supply that aligns with 202.000 handle.
While on the 4H is a downtrend, on daily timeframe, price is in a bullish leg and now coming up from filling the imbalance. Now if I was paying attention I could get into buys at the bottom and trap the market. However that was not the case.
That can cause price to go higher and break through our supply. But that is why we wait for confirmation on smaller timeframes before entering the trade.
Remember, no confiration - no entry.

GBPJPY - BULLISH CONTINUATION OR REVERSAL?Symbol - GBPJPY
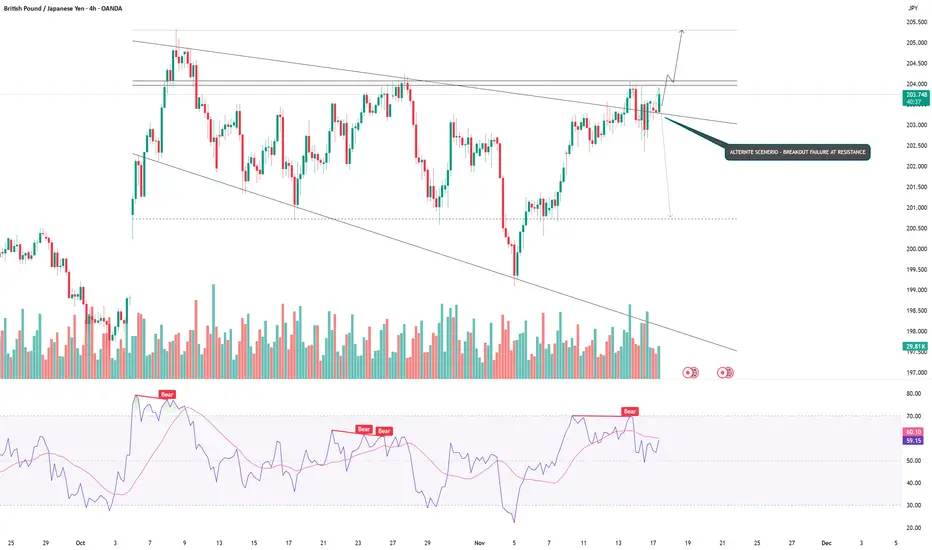
GBPJPY has broken the structure of the local downtrend amid persistent weakness in the Japanese yen. This shift opens the possibility for a continuation of the broader bullish trend.
The yen continues to depreciate, while the British pound maintains its upward trajectory. A breakout above local trend resistance is developing, reinforcing the overarching bullish market structure. The key support zone remains 203.50–203.26 Sustained consolidation above this zone would confirm buyer strength and could provide the foundation for further upside. If bulls successfully defend 203.50, an extension of the rally becomes increasingly likely.
Resistance levels: 204.06, 205.32
Support levels: 203.52, 203.26
A strong battle between buyers and sellers is unfolding around the 203.50 zone. Ongoing consolidation above 203.00 highlights the significance of this area. The current bias remains focused on the bulls, maintaining price action above 203.50 would support continued growth, while failure to hold this zone could lead to a corrective move back toward support for a retest.
GBP/JPY 2-hour chart...GBP/JPY 2-hour chart, here’s what I can interpret based on my markings:
Range zone (pink box): approximately 203.8 – 204.4
Resistance zone (green box): around 201.0 – 201.5
Current price: ~202.18
Ichimoku cloud: price is just breaking back toward the cloud (potential short-term bullish momentum)
Marked target point: around 204.3 – 204.4
🎯 Target Analysis
If price continues its upward momentum from the bounce near 201.3 (support zone) and breaks above the cloud:
First target: 203.20 (top of the cloud / minor resistance)
Second target (main): 204.30 – 204.40 (the top of my marked range)
📉 Invalidation / Stop-loss idea
If price falls back below 201.70 – 201.50, that would invalidate the bullish setup and could signal another test of the green support zone.
Summary
Buy zone: Above 202.20–202.30 (confirmation above Tenkan/Kijun lines)
Target 1: 203.20
Target 2: 204.30–204.40
Stop-loss: 201.50

chart for GBP/JPY...chart for GBP/JPY. Based on what I’m seeing + recent technicals, here’s a target-zone scenario for my. Remember: this is a probabilistic view, not a guarantee — set my risk accordingly and use a stop.
---
🔍 Current technical context
GBP/JPY is hovering around ~ 203.0-203.5 (per recent data).
There is resistance near ~ 205.30 according to one analysis.
On the downside, support is referenced around ~ 200.67 or ~ 197.47 in one view.
The pair’s trend signals show a generally bullish macro trend, though short-term momentum might be weakening.
---
🎯 Target zones
Given my chart shows a break of a trendline (uptrend) and a move lower, here are two plausible targets depending on how the move unfolds:
If a bearish move continues (i.e., break of support around ~ 200.6) → A target around 197.50-198.00 is reasonable.
If the price instead holds support and bounces/reverses → A target near or above the resistance around 205.30-207.00 becomes possible.
---
✅ My preferred “play” based on my setup
Since my chart shows a breakdown of an ascending trendline, I lean toward the bearish target path:
Entry: At current ~ 203.0 area (assuming my chart confirms the break).
Stop-loss: Just above the recent high / trend‐line (say ~ 205.50) to manage risk.
Target: ~ 197.50-198.00 (gives about 5-6 points of drop from current).
Risk-reward: Check how many pips my risking vs this target — ensure the reward is larger than the risk.
---
⚠ Things to watch
If price breaks back above ~ 205.30 with good momentum, the bearish scenario is invalidated and my need to pivot.
Macroeconomic/fundamental events (e.g., UK or Japan monetary policy) can blow this setup either way — be aware.
The move to 197.50 might not be smooth — there may be bounces, retests of broken trendline, etc.
---
If you like, I can plot multiple target-levels (e.g., near‐term, mid-term, and stretch) on my exact chart timeframe (1-hour) and we can mark stop and risk-zones.

GBP/JPY (British Pound / Japanese Yen) 1-hour chartGBP/JPY (British Pound / Japanese Yen) 1-hour chart, I have drawn a rising wedge pattern — which is typically a bearish reversal setup once the lower trendline breaks.
Here’s the detailed target analysis:
---
📉 Current price:
Around 203.50
⚠ Breakdown level (support zone):
Around 203.20 – 203.00
If the price closes below this zone, the bearish move is confirmed.
---
🎯 Target 1 (short-term target):
≈ 202.20 – 202.30
This aligns with my first target point marked on the chart — the initial measured move from the wedge height.
---
🎯 Target 2 (extended / full move):
≈ 201.20 – 201.30
This matches my second target point — the full measured projection of the wedge pattern.
---
✅ Summary:
Level Description Zone
🔻 Breakdown Point Confirm sell below 203.20 – 203.00
🎯 Target 1 First profit level 202.20 – 202.30
🎯 Target 2 Final profit level 201.20 – 201.30
⛔ Stop-loss Above recent high 204.00 – 204.20

GBP/JPY WEEKPLAN: Ready for Super OB BuyMarket Structure Analysis
Long-Term Trend: The GBP/JPY pair is in a strong uptrend, confirmed by a series of consecutive higher highs and higher lows (BOS - Break of Structure).
Recent Change: Recently, the price has had a minor structural shift (M-MSS or ChoCH - Change of Character) by breaking the most recent low within the bullish structure. This signals that a downward correction might be underway.
Current Status: After the structural shift, the price has created a lower high and is currently in a corrective downward movement.
Analysis of Key Zones
Support/Buy Zone (BUY ZONE OB):
Location: The price range from ~199.000 to ~199.200.
Significance: This is a crucial Order Block (OB). This zone is where "Smart Money" placed large buy orders to push the price up, creating a BOS beforehand. After the price corrects, it is highly likely to retrace to this zone to "fill" the remaining orders and continue the uptrend. This is the most potential entry point for a long position.
Resistance/Sell Zones (OBS and Imbalance):
Location:
OBS: The price range from ~200.400 to ~200.600.
Imbalance: The price range from ~199.600 to ~200.400.
Significance: These are temporary resistance zones. The Imbalance is a liquidity void created by the rapid price drop, and the price might retrace to fill it before continuing its decline towards the BUY ZONE. The OBS is an area with a cluster of sell orders, and the price has reacted to this zone in the past.
Stop Loss Points:
SL for a short trade: Placed above the highest peak (~200.800) to protect a potential sell order.
SL for a long trade: Placed below the BUY ZONE (~198.800) for risk management.
Detailed Trading Plan
Based on the analysis, there are two main trading scenarios:
Scenario 1 (Wait for a Buy - Primary Plan):
Strategy: Wait for the price to continue its corrective pullback to the strong support zone.
Entry: Place a pending buy order in the BUY ZONE OB (~199.000 - 199.200).
Reasoning: This is the strongest support zone where the price is highly likely to reverse to continue the long-term uptrend.
Take Profit:
TP1: The OBS zone (~200.400 - 200.600).
TP2: The recent highest peak (~201.200).
Stop Loss: Place it below the BUY ZONE (~198.800).
Scenario 2 (Short-Term Sell - Secondary Plan):
Strategy: A short-term trade, against the main trend.
Entry: Consider a short-term sell trade when the price retraces to fill the Imbalance (~199.600 - 200.400) or touches the OBS zone (~200.400 - 200.600).
Reasoning: This scenario capitalizes on the corrective downward move before the price potentially turns around.
Take Profit: The BUY ZONE OB (~199.000).
Stop Loss: Place it above the peak of the OBS zone (~200.800).
Conclusion:
The primary trading plan is to wait for a buy entry in the BUY ZONE OB because it aligns with the main trend and offers a better risk-to-reward ratio. The sell scenario should be treated as a short-term, higher-risk trade, going against the primary trend. Strict risk management is essential for both scenarios.

GBPJPY Analysis – Bullish Outlook and Market ForecastGBPJPY Analysis – Bullish Outlook and Market Forecast
GBP/JPY Market Outlook
The structure of GBP/JPY continues to highlight an orderly bullish cycle. Price action is showing clear phases of expansion, retracement, and continuation, reflecting strong market rhythm rather than random volatility. Recent break-of-structure signals confirm that short-term corrections are consistently being absorbed, with liquidity cycles providing fuel for further upside development.
The current pullback is part of a healthy market rotation, where positioning is reset before the next directional move. This type of behavior often signals strength, as it reflects deeper participation rather than exhaustion. The broader flow suggests that buyers remain in control, with momentum favoring sustained upside progression over the medium term.
In summary, GBP/JPY is maintaining structural integrity, with corrections serving as opportunities within an established bullish framework. The outlook remains constructive, supported by consistent market behavior and trend alignment.

GBPJPY GJ is continuing its decline and is approaching a key demand zone around 194.800, which previously initiated bullish order flow.
I’ll definitely be monitoring this area closely for potential buy setups, as I’m anticipating a possible retracement. As always, confirmation will come from observing the 15-minute structure—once that aligns, I’ll adapt accordingly.

GBPJPYThe 4-hour structure on GBP/JPY has turned bullish following a strong upward move that flipped the previous structure after several days of consolidation and limited volatility.
Price has now entered a Demand zone and is likely to retrace toward the 197.500 level, which aligns with a key psychological handle.
This area may present a high-probability trading opportunity, depending on how price reacts. We'll monitor for confirmation before entering a position.

GBPJPY Short Setup- Momentum Rejection from ResistanceThis chart explores a potential short opportunity in GBPJPY on the 15-minute timeframe following a visible loss of bullish momentum near the upper structure.
🔍 Key Observations:
Sell Labels appeared after a strong upside move, near a key resistance zone.
A Caution Marker was triggered near the high — typically indicates a potential trend exhaustion.
Price lost support from short-term moving averages and began to trade below them.
A downside continuation setup is now active with price targeting prior demand levels.
🎯 Target Area:
A previous structure low and untested support zone around 197.699 is being monitored as a potential target, pending continued bearish momentum.
🧠 Educational Notes:
This idea highlights how momentum-based tools can help identify potential intraday turning points. The confluence of resistance rejection, caution labeling, and sell signals offers a clean example of short-term reversal structure.
⏱ Timeframe:
15-Minute (Intraday)

GBPJPY Breakout Retest-Bullish Continuation in PlayGBPJPY showing potential breakout continuation after reclaiming a key intraday resistance zone.
Retest confirmation occurred near 198.72 support-turned-demand.
SignalPro structure highlights:
📍Clear high-probability buy signal
🟨 Caution label earlier flagged trend shift risk
📦 Liquidity Control Box now acting as base
Target set at 199.970 with defined risk below recent structure low.
Key Observations:
Breakout aligned with momentum recovery after multiple failed sell attempts.
Risk-to-reward is favorable for potential trend continuation toward upper liquidity levels.
🔍 Timeframe: 15-min
⚙️ Tool Used: Leola Lens SignalPro
📘 For learning use only – not financial advice.

GBP/JPY 4H Chart Analysis – Bullish Channel Setup📈 Trend:
Price is moving in an ascending channel
🔵 Support line below
🔴 Resistance line above
---
Key Zones & Levels:
📍 Demand Zone (Buy Area):
Between 191.753 – 194.016
Price might bounce here before continuing up
🔵 Likely pullback expected here
🎯 Target Point:
202.500
🚀 If price respects the demand zone, this is the upside target
🟢 Entry Point:
Around 193.964 – 194.016
Optimal buying zone before the projected rise
❌ Stop Loss:
Below 191.700
🛑 Placed to minimize losses if price breaks down
---
Indicators:
📉 EMA (70):
Currently at 192.816
✅ Acting as dynamic support
---
Trade Plan Summary:
🔄 Wait for a retracement into the Demand Zone
🛒 Enter long near 193.964
⛔ Stop loss at 191.700
🎯 Target at 202.500

YEN STRIKES BACK- GBPJPY UNDER PRESSURE - POSSIBLE PRICE DECLINESymbol - GBPJPY
The GBPJPY currency pair is currently exhibiting signs of a localized bearish trend, influenced in part by a broader correction in the US dollar. As a result, the Japanese yen is gaining strength, applying downward pressure on the pair.
Price action is retracing back into a key range and encountering significant resistance levels. The pair has moved below a critical resistance zone and is consolidating within a selling area, suggesting potential for a continued decline toward identified support and liquidity zones.
From a technical perspective, the broader trend remains neutral; however, GBPJPY appears to be reacting to a notable resistance level, potentially initiating a corrective pullback. Should bearish momentum persist and the price remain below the 193.45-193.74 resistance band, further downside movement is likely.
Key Resistance Levels: 193.45, 193.74, 194.22
Key Support Levels: 193.04, 192.35, 191.65
Sustained consolidation below the 193.45-193.74 resistance zone would confirm bearish control over the range top. In such a scenario, a continuation of the sell-off is anticipated, with price likely targeting the aforementioned support and liquidity zones.
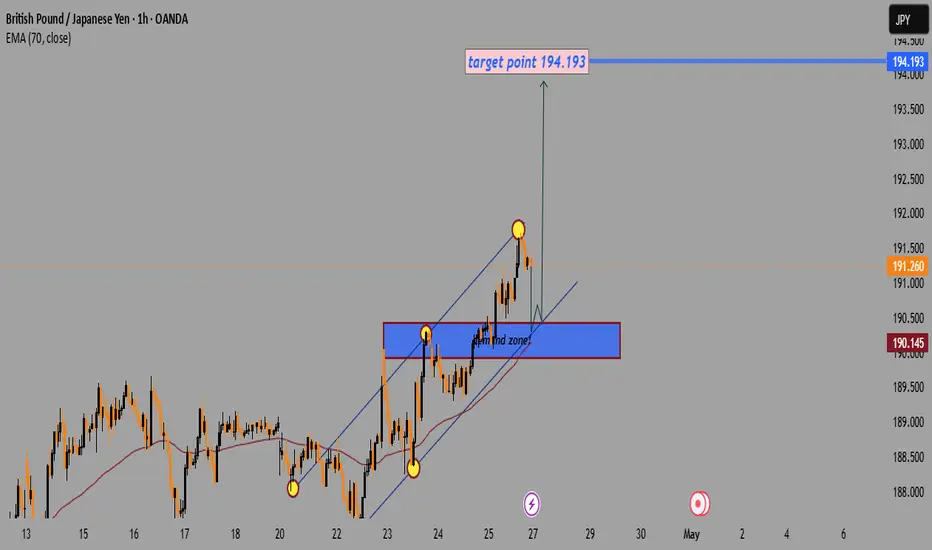
GBP/JPY Bullish Setup:Targeting194.193 After Demand Zone RetestTrend:
📈 Uptrend inside a rising channel (blue lines).
Key Zones:
🟦 Demand Zone: Between 190.400 - 190.700.
🧲 Acts as strong support where buyers previously stepped in.
Indicators:
📉 EMA 70 at 190.145 (below price) → bullish support.
Price Action:
📍 Current price: Around 191.260.
🔥 Recently touched upper channel resistance and pulled back slightly.
Target:
🎯 Target Point: 194.193.
Scenario:
🔄 Expecting a small pullback towards the demand zone or channel support.
🚀 Then a bullish continuation towards the target (194.193).
Risk Warning:
⚠️ If the price breaks below the demand zone and EMA, the bullish idea might be invalid.
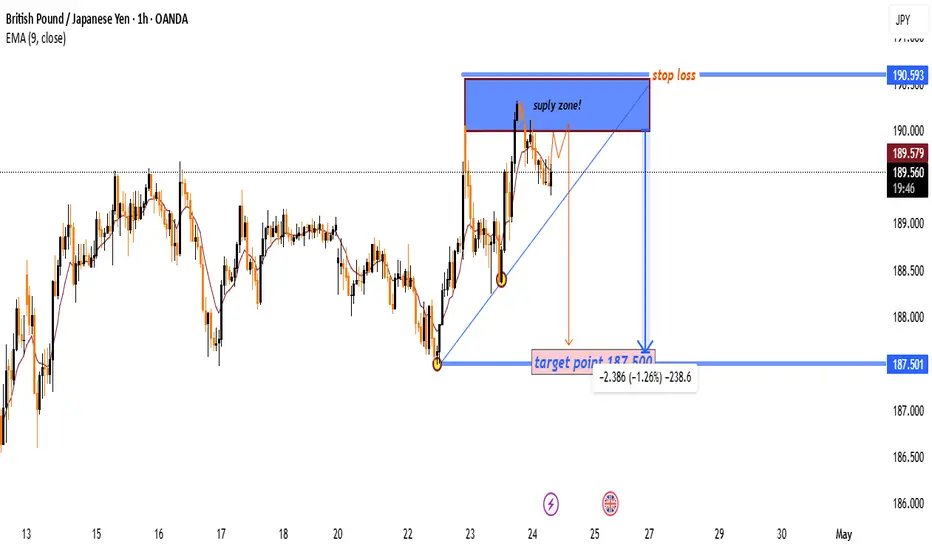
“GBP/JPY Supply Zone Short Setup – Precision Entry with 1:2 R:R!Strategy: Short/Sell Setup
🔵 Current Price: 189.536
📉 Trend Bias: Bearish setup forming
🔷 SUPPLY ZONE (Sell Area)
📍 Zone: 190.000 – 190.593
🟦 Marked in blue on the chart
⚠️ Sellers likely to step in here!
🔺 Action:
Enter SELL here if rejection confirms
🔴 Bearish candles / wicks are key signals.
🔸 STOP LOSS 🔸
❌ Above supply zone:
📍 190.593
🛡️ Protects against false breakouts.
🎯 TARGET POINT 🎯
📍 187.501
💰 Strong support zone
✅ Risk:Reward ≈ 1:2+
📊 Price Movement Projection
🔵 Dotted trendline shows rising support
⚠️ A break of this could trigger the drop
⬇️ Potential fall from supply zone to target
📌 Summary:
* 🔼 Wait for price to test supply zone
* ⏳ Confirm rejection
* 🔽 Target: 187.501
* 🛑 SL: 190.593
* ✅ High R:R setup!
GBP/JPY Bearish Reversal Setup–Eyeing Breakdown from Supply Zone1. Supply Zone (Resistance Area) 🟦 Supply Zone:
Located around 189.500–190.000
🔺 Price got rejected here multiple times — strong selling pressure.
2. Ascending Trendline Support
📈 Trendline connecting higher lows (marked with yellow dots)
🟡 Support tested multiple times, acting as a rising wedge structure.
3. EMA (7) — Exponential Moving Average
⚫️ EMA (black line) is currently near price — indicating short-term trend stalling.
4. Bearish Breakout Setup
🔻 Anticipated price drop shown with red/orange arrows
📉 If price breaks below trendline:
🎯 Target Point: 186.600
⬇️ Expected drop: ~1.51%
5. Price Movement Outlook
🔁 Possible minor pullback before breakdown
⛔️ Bearish signal increases if the trendline fails.
Summary (with emojis):
📍 Entry Idea: Short near resistance zone (189.500–190.000)
⛓ Trigger: Break of trendline support
🎯 Target: 186.600
⚠️ Stop-loss: Above 190.000 (above supply zone)

GBP/JPY) Bearish analysis Read The ChaptianSMC Trading point update
GBP/JPY 2-hour chart outlines a clear bearish setup within a well-defined downtrend. Here's a breakdown of the trading idea:
---
Technical Overview:
Downtrend Channel:
The pair is respecting a downward-sloping channel, with repeated rejections at the upper boundary, confirming bearish control.
Resistance Zone (~187.8 - 188.5):
Price has reached a highlighted resistance area that aligns with previous swing highs and trendline resistance — marked with red arrows for prior rejections.
Bearish Projection:
The analysis anticipates a rejection from this resistance zone followed by a downward impulse move. A pullback is expected, but continuation toward the target support zone around 179.150 is likely.
Target Zone (~179.150):
This level lines up with previous price action and matches the measured move (blue vertical box), adding confluence.
EMA 200 (around 190.36):
Price is well below the 200 EMA, reinforcing the bearish structure and trend bias.
RSI Indicator (~52):
RSI is slightly above 50 but not bullish — this neutral reading suggests the pair has room to drop if resistance holds.
Mr SMC Trading point
---
Trading Idea Summary:
Bias: Bearish
Entry Zone: 187.8 – 188.5 (resistance)
Confirmation: Bearish candlestick pattern or rejection signal
Target: 179.150
Invalidation: Break and close above 190.365 (above EMA 200 and prior highs)
---
plase support boost 🚀 analysis follow)

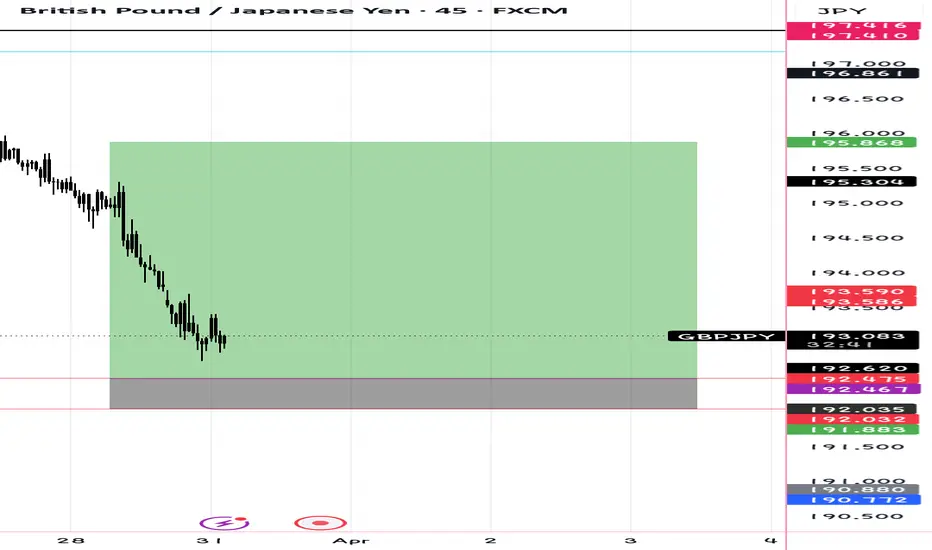
Gbpjpy - Buy Setup - It appears you are inquiring about GBP/JPY, the currency pair representing the exchange rate between the British Pound Sterling (GBP) and the Japanese Yen (JPY). This pair indicates how many Japanese Yen are needed to purchase one British Pound. As of March 28, 2025, the GBP/JPY exchange rate was approximately 193.94 JPY, reflecting a decrease of 0.85% from the previous trading session .
The GBP/JPY pair is known for its volatility, influenced by factors such as economic indicators, interest rate differentials between the UK and Japan, and geopolitical events. Traders often monitor this pair closely due to its potential for significant price movements.
For real-time charts, historical data, and technical analysis, platforms like TradingView provide comprehensive resources . Additionally, financial news outlets such as Reuters offer up-to-date information on exchange rates and market trends .
If you have specific questions about GBP/JPY or need further details, feel free to ask.
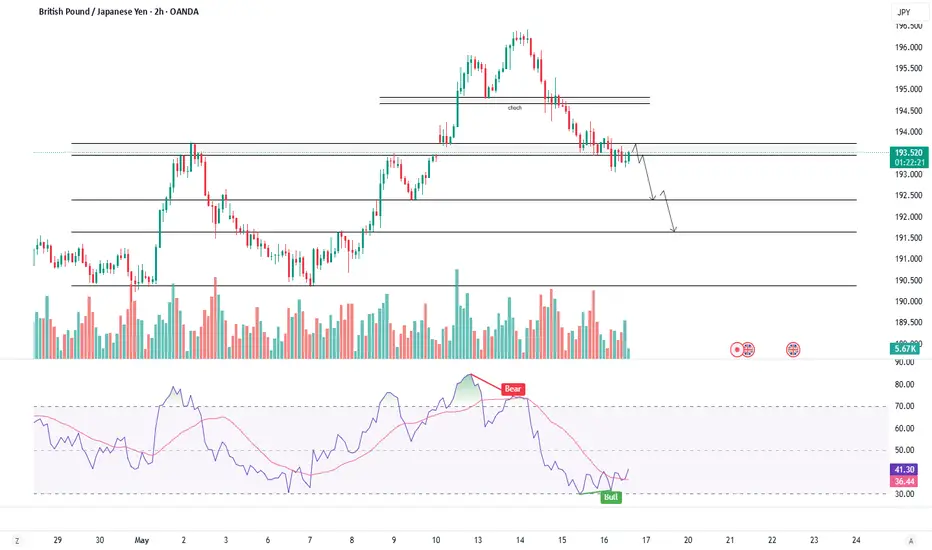
GBP/JPY Short Trade Setup – Bearish Reversal PotentialThis chart represents a GBP/JPY (British Pound to Japanese Yen) 1-hour timeframe trade setup with a clear short (sell) position strategy. Here's a breakdown:
Key Levels:
Entry Point: 📍 192.894 (near current price 192.771)
Stop Loss: ❌ 193.542 (above entry, marking a point where the trade will be exited if it moves against expectations)
Take Profit Targets:
TP1: 🎯 192.258
TP2: 🎯 191.688
Final Target: 🎯 190.755
Trade Strategy:
The trader is anticipating a downward movement in GBP/JPY from the entry zone.
Stop loss is placed above recent highs, ensuring risk management.
Take profit levels are structured to secure partial profits as the price moves down.
Market Context:
Current Price: 🟡 192.771 (slightly below entry)
If price rejects from the entry zone (192.894) and starts moving down, the trade could play out successfully.
A break above 193.542 would invalidate this trade, suggesting further bullish momentum.
Conclusion:
📉 Bearish Bias – Expecting a drop in GBP/JPY price
🎯 Risk-Reward Setup Looks Favorable
⚠️ Watch for Rejections at Entry Zone & Market Trends

GBP/JPY Trading Strategy - Buy to 194GBP/JPY Trading Strategy - Buy to 194
I. Technical Analysis
1. Overall Trend
On the H4 timeframe, GBP/JPY shows signs of a bullish reversal:
The price has broken through the previous resistance zone 190.4 - 191.0 and is holding above it.
EMA 33 & EMA 50 are starting to slope upwards, indicating an uptrend.
Volume is increasing as the price bounces off the support zone.
On the D1 timeframe, GBP/JPY is recovering from a correction, aiming for the next resistance zone 194.0 - 194.2.
2. Key Support & Resistance Levels
✅ Strong Support (Potential Buy Zone):
190.2 - 190.4: Newly established support after the breakout.
189.2: Strong support; if broken, the uptrend may be invalidated.
✅ Target Resistance (Take Profit - TP):
194.0 - 194.2: Significant resistance on H4 & D1 charts.
✅ Trend Confirmation Indicators:
RSI > 55, not overbought, still has room to rise.
Volume increasing on price rise, confirming buyers' control.
II. Trade Setup
1. Entry Point
BUY entry when price retraces to 190.4 - 191.0.
Split orders:
50% of the position at 190.4.
Remaining 50% at 190.0 if the price continues to correct.
2. Stop Loss (SL)
189.2: If the price breaks this level, the uptrend is invalidated.
3. Take Profit (TP)
TP1: 192.5 → Close 50% of the position and move SL to breakeven.
TP2: 194.0 - 194.2 → Close the remaining position.
4. Risk/Reward Ratio (R:R)
Average Entry: 190.7
SL: 189.2 (-1.5 pips)
TP: 194.0 (+3.3 pips)
R:R = 2.2:1 → Favorable risk-reward ratio for swing trading.
III. Risk Management & Market Scenarios
🔸 If price moves in our favor:
✅ When the price reaches 192.5, move SL to breakeven to secure capital.
🔸 If price drops to 189.2:
❌ Exit all positions as the uptrend is invalidated.
🔸 Key signals to watch:
⚠️ If price surges past 191.8 without a pullback, consider waiting for a retracement before entering.
IV. Conc......
BUY GBP/JPY at 190.4 - 190.0, TP 194.0, SL 189.2.
Good R:R ratio (2.2:1), suitable for swing trading.
Holding period: Within this week, monitor closely.
Welcome Follow Me, Thanks!
