GBPJPY Analysis – Bullish Outlook and Market ForecastGBPJPY Analysis – Bullish Outlook and Market Forecast
GBP/JPY Market Outlook
The structure of GBP/JPY continues to highlight an orderly bullish cycle. Price action is showing clear phases of expansion, retracement, and continuation, reflecting strong market rhythm rather than random volatility. Recent break-of-structure signals confirm that short-term corrections are consistently being absorbed, with liquidity cycles providing fuel for further upside development.
The current pullback is part of a healthy market rotation, where positioning is reset before the next directional move. This type of behavior often signals strength, as it reflects deeper participation rather than exhaustion. The broader flow suggests that buyers remain in control, with momentum favoring sustained upside progression over the medium term.
In summary, GBP/JPY is maintaining structural integrity, with corrections serving as opportunities within an established bullish framework. The outlook remains constructive, supported by consistent market behavior and trend alignment.
Gbpjpyforecast

YEN STRIKES BACK- GBPJPY UNDER PRESSURE - POSSIBLE PRICE DECLINESymbol - GBPJPY
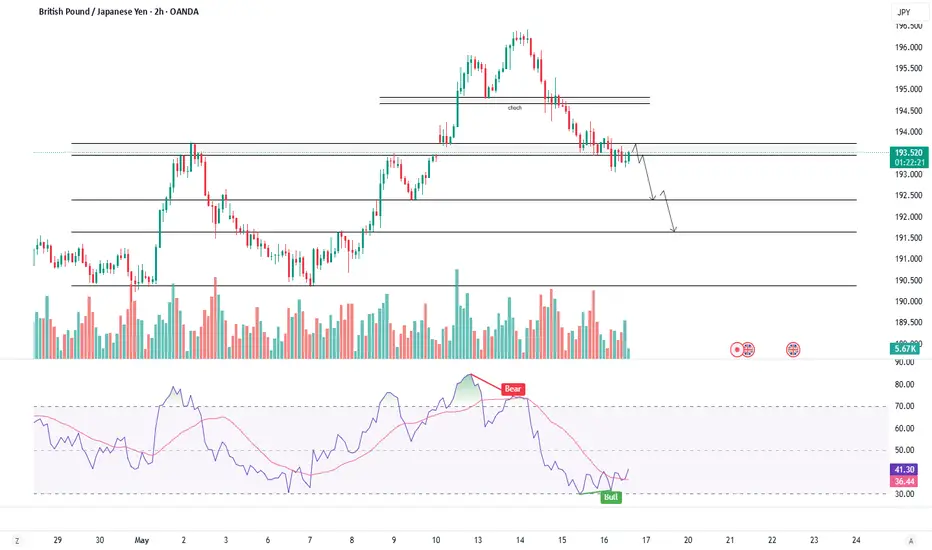
The GBPJPY currency pair is currently exhibiting signs of a localized bearish trend, influenced in part by a broader correction in the US dollar. As a result, the Japanese yen is gaining strength, applying downward pressure on the pair.
Price action is retracing back into a key range and encountering significant resistance levels. The pair has moved below a critical resistance zone and is consolidating within a selling area, suggesting potential for a continued decline toward identified support and liquidity zones.
From a technical perspective, the broader trend remains neutral; however, GBPJPY appears to be reacting to a notable resistance level, potentially initiating a corrective pullback. Should bearish momentum persist and the price remain below the 193.45-193.74 resistance band, further downside movement is likely.
Key Resistance Levels: 193.45, 193.74, 194.22
Key Support Levels: 193.04, 192.35, 191.65
Sustained consolidation below the 193.45-193.74 resistance zone would confirm bearish control over the range top. In such a scenario, a continuation of the sell-off is anticipated, with price likely targeting the aforementioned support and liquidity zones.
GBP/JPY Bearish Reversal Setup–Eyeing Breakdown from Supply Zone1. Supply Zone (Resistance Area) 🟦 Supply Zone:
Located around 189.500–190.000
🔺 Price got rejected here multiple times — strong selling pressure.
2. Ascending Trendline Support
📈 Trendline connecting higher lows (marked with yellow dots)
🟡 Support tested multiple times, acting as a rising wedge structure.
3. EMA (7) — Exponential Moving Average
⚫️ EMA (black line) is currently near price — indicating short-term trend stalling.
4. Bearish Breakout Setup
🔻 Anticipated price drop shown with red/orange arrows
📉 If price breaks below trendline:
🎯 Target Point: 186.600
⬇️ Expected drop: ~1.51%
5. Price Movement Outlook
🔁 Possible minor pullback before breakdown
⛔️ Bearish signal increases if the trendline fails.
Summary (with emojis):
📍 Entry Idea: Short near resistance zone (189.500–190.000)
⛓ Trigger: Break of trendline support
🎯 Target: 186.600
⚠️ Stop-loss: Above 190.000 (above supply zone)

GBP/JPY) Bearish analysis Read The ChaptianSMC Trading point update
GBP/JPY 2-hour chart outlines a clear bearish setup within a well-defined downtrend. Here's a breakdown of the trading idea:
---
Technical Overview:
Downtrend Channel:
The pair is respecting a downward-sloping channel, with repeated rejections at the upper boundary, confirming bearish control.
Resistance Zone (~187.8 - 188.5):
Price has reached a highlighted resistance area that aligns with previous swing highs and trendline resistance — marked with red arrows for prior rejections.
Bearish Projection:
The analysis anticipates a rejection from this resistance zone followed by a downward impulse move. A pullback is expected, but continuation toward the target support zone around 179.150 is likely.
Target Zone (~179.150):
This level lines up with previous price action and matches the measured move (blue vertical box), adding confluence.
EMA 200 (around 190.36):
Price is well below the 200 EMA, reinforcing the bearish structure and trend bias.
RSI Indicator (~52):
RSI is slightly above 50 but not bullish — this neutral reading suggests the pair has room to drop if resistance holds.
Mr SMC Trading point
---
Trading Idea Summary:
Bias: Bearish
Entry Zone: 187.8 – 188.5 (resistance)
Confirmation: Bearish candlestick pattern or rejection signal
Target: 179.150
Invalidation: Break and close above 190.365 (above EMA 200 and prior highs)
---
plase support boost 🚀 analysis follow)

GBPJPY SHOWING A GOOD DOWN MOVE WITH 1:5 RISK REWARD GBPJPY SHOWING A GOOD DOWN MOVE WITH 1:5 RISK REWARD
DUE TO THESE REASON
A. its following a rectangle pattern that stocked the market
which preventing the market to move any one direction now it trying to break the strong resistant lable
B. after the break of this rectangle it will boost the market potential for break
C. also its resisting from a strong neckline the neckline also got weeker ald the price is ready to break in the outer region
all of these reason are indicating the same thing its ready for breakout BREAKOUT trading are follws good risk reward
please dont use more than one percentage of your capitalfollow risk reward and tradeing rules
that will help you to to become a bettertrader
thank you

GBPJPY - TRADING WITHIN TRAINGLE PATTERN FORMATIONSymbol - GBPJPY
The GBPJPY is currently trading within a symmetrical triangle pattern and recently experienced an attempt to breach resistance levels and rise. However, the momentum has proven insufficient, as market participants remain skeptical of any bullish movement, primarily due to the actions of the Bank of Japan. The Bank of Japan recently increased its interest rate by 0.25%, marking the highest level since 2008, in response to accelerating inflation and a slowing economy. The central bank has signaled that further rate hikes are possible if inflation continues to rise.
From a fundamental perspective, this could lead to a potential decline in the GBPJPY currency pair, although the strength of the British Pound against the US Dollar may mitigate this effect. Technically, the recent attempt to break resistance appears to be a false breakout, with the medium-term outlook influenced by both the technical structure and the Bank of Japan's actions.
Key resistance level: 195.00
Key support levels: 192.00, 190.50
It is possible that another attempt to test resistance will occur before a subsequent decline. Traders are increasingly building long positions on the Japanese Yen, which could result in a bearish correction for the currency pair.

GBPJPY BUY SETUP R:R 1:5This is short term Trade
Wait for Marked demand zone.
Wait for CHoCH in LTF
Then Enter with the LTF OB.
Please do your own research before entering the trade.

GBPJPY BUY SETUPReasons to Take Trade
4Hr Imbalance Filled
50% of FIB Mitigated
Hidden OB Mitigated
Stop Hunt and QML Present
Please do your own research before entering the trade

GBPJPY SHOWING A GOOD UP MOVE WITH 1:5 RISK REWARD GBPJPY SHOWING A GOOD D
UP MOVE WITH 1:5 RISK REWARD
DUE TO THESE REASON
A. its following a rectangle pattern that stocked the market
which preventing the market to move any one direction now it trying to break the strong resistant lable
B. after the break of this rectangle it will boost the market potential for break
C. also its resisting from a strong neckline the neckline also got weeker ald the price is ready to break in the outer region
all of these reason are indicating the same thing its ready for breakout BREAKOUT trading are follws good risk reward
please dont use more than one percentage of your capitalfollow risk reward and tradeing rules
that will help you to to become a bettertrader
thank you

GBPJPY SHOWING A GOOD UP MOVE WITH 1:7 RISK REWARDGBPJPYSHOWING A GOOD
UP MOVE WITH 1: 7 RISK REWARD
DUE TO THESE REASON
A. its following a rectangle pattern that stocked the market
which preventing the market to move any one direction now it trying to break the strong resistant lable
B. after the break of this rectangle it will boost the market potential for break
C. also its resisting from a strong neckline the neckline also got weeker ald the price is ready to break in the outer region
all of these reason are indicating the same thing its ready for breakout BREAKOUT trading are follws good risk reward
please dont use more than one percentage of your capitalfollow risk reward and tradeing rules
that will help you to to become a bettertrader
thank you

A ACCENDING TRIANGLE PATTERN SHOWING ON GBPJPY GBPJPY SHOWING A GOOD UP MOVE
DUE TO THESE REASON
A. its following a ACCENDING TRIANGLE PATTERNn that stocked the market
which preventing the market to move any one direction now it trying to break the strong resistant lable
B. after the break of this rectangle it will boost the market potential for break
C. also its resisting from a strong neckline the neckline also got weeker ald the price is ready to break in the outer region
all of these reason are indicating the same thing its ready for breakout BREAKOUT trading are follws good risk reward
please dont use more than one percentage of your capitalfollow risk reward and tradeing rules
that will help you to to become a bettertrader
thank you

GBPJPY SHOWING A GOOD UPWARD MOVE WITH 1:10 RISK XAUUSD SHOWING A UPWARD MOVE WITH 1:10 RISK REWARD
DUE TO THESE REASON
A. its following a rectangle pattern that stocked the market
which preventing the market to move any one direction now it trying to break the strong resistant lable
B. after the break of this rectangle it will boost the market potential for break
C. also its resisting from a strong neckline the neckline also got weeker ald the price is ready to break in the outer region
all of these reason are indicating the same thing its ready for breakout BREAKOUT trading are follws good risk reward
please dont use more than one percentage of your capitalfollow risk reward and tradeing rules
that will help you to to become a bettertrader
thank you

GBPJPY SHOWING A GOOD D UP MOVE WITH 1:10 RISK REWARD GBPJPY SHOWING A GOOD D
UP MOVE WITH 1:10 RISK REWARD
DUE TO THESE REASON
A. its following a rectangle pattern that stocked the market
which preventing the market to move any one direction now it trying to break the strong resistant lable
B. after the break of this rectangle it will boost the market potential for break
C. also its resisting from a strong neckline the neckline also got weeker ald the price is ready to break in the outer region
all of these reason are indicating the same thing its ready for breakout BREAKOUT trading are follws good risk reward
please dont use more than one percentage of your capitalfollow risk reward and tradeing rules
that will help you to to become a bettertrader
thank you

SELL GBPJPYSell GBPJPY as it is in downtrend also it has made a pull back on important level and made bearish flag pattern good opportunity to sell

GBPJPY LONG INFLATION IS COMING SOON INFLACTION EXPECTED TO COME DOWN FROM 10.1 TO 8
WHICH IS GOOD FOR CURRENCY
STRONG SUPPORT BELOW
200EMA IS BELOW THE PRICE
BEST 1:8 TRADE
Forex factory analysis link below

Possible Elliot wave counts of GBPJPY (now down then up)Hello Friends, here we had shared possible Elliot wave counts of GBPJPY on hourly time frame chart, in which wave structure says that currently we are in wave (c) of wave 2 of wave (C) of some complex correction heading towards north, on bigger scale post (C) again we may start journey towards south directions, Right now on hourly chart we can assume that we may witness fall as a wave iii, iv & v of (c) of 2 of (C), (c) can be an equal of (a) so it may show us 164.858 levels as an equality. Now down then up, Overall it's suggesting buy on dips only. My studies are for educational purpose only. Please Consult your financial advisor before trading or investing. I am not responsible for any kinds of your profits and your losses.
RK's mass psychological cloud is also suggesting good support at same buying zone area
Bigger picture
Most investors treat trading as a hobby because they have a full-time job doing something else.
However, If you treat trading like a business, it will pay you like a business. If you treat like a hobby, hobbies don't pay, they cost you...!
Disclaimer.
I am not sebi registered analyst.
My studies are for educational purpose only.
Please Consult your financial advisor before trading or investing.
I am not responsible for any kinds of your profits and your losses.

GBPJPY Next Move (One Week Forecast)All major points are mentioned on the chart itself...
These points are as per previous chart history with my calculation...
Do your own research before entering into the market...
Thanks for your support...

GBPJPY Next Move Either SideSet Buy Stop @ 161.017
with TP1 @161.344
TP2 @161.000
TP3 @161.275
Alternatively,
Set Sell Stop below 160.530
with Stop Loss 161.000
TP1 @160.204
TP2 @160.007
TP3 @159.807

GBPJPY Buying Opportunity One Hour Time FrameAll buy/sell points with TPs and SL are mentioned on chart... You can observe the candles before quick trade setup...
For accuracy of my forecast, you can check my previous chart of GBPJPY in my profile section...
Please do your own research before entering into the market...
Thanks for your support...

GBPJPY Buying Opportunity One Hour Time FrameAll selling and buying points are mentioned on the chart...
Be prepare for huge profit...
Thanks for your support...

GBPJPY Next Move (One Week Forecast)All Major Points are mentioned on the chart itself and this forecast is valid till next week...
Do your own research before making any trade setup on either side...
Thanks for your support...

GBPJPY - Go for LongGBPjpy for long - pulling back from Demand zone - expected to go the resistance draw for more details see the chart

GBPJPY ANALYTIS DAILY CHART
The market may move in either two directions:
1. if the candle closes below 152.9 the target is 148.9
2. if the candle is closed above 152.8 and the price is increasing the target is 157.43
THIS IS JUST FOR EDUCATIONAL PURPOSE. THIS ANALYSIS IS NOT FOR FINANCIAL PURPOSE.
