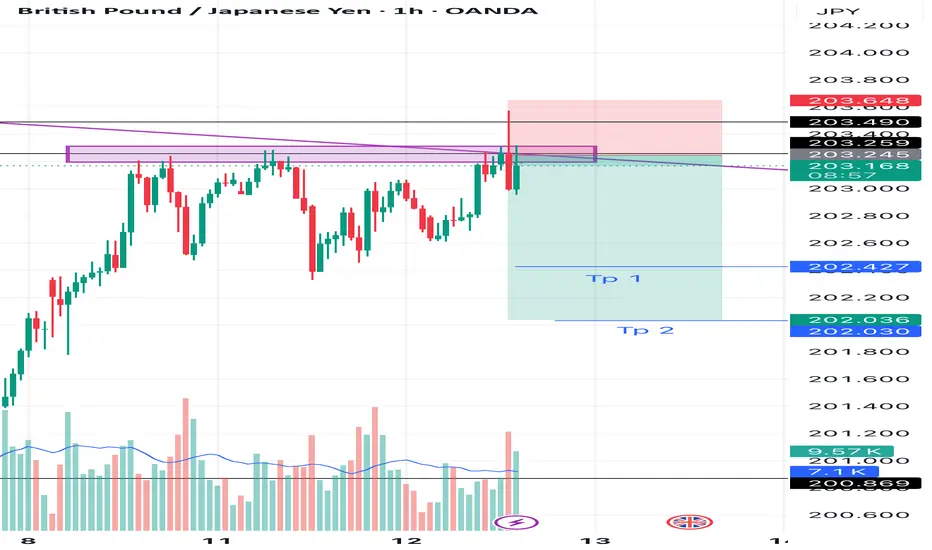
GBPJPY SHORT 1H TIME FRAME I am sitting in short of GBPJPY on 1H Time frame
Logic :- i can clearly see a good rejection with huge volumes from resistance and buyers are trapped, Sellers are gaining control so i am going for 1:2/3.
Let’s see one can take with proper SL gand targets given ✅
Trust the process 🚀, A lot more to come
Thank you guys, Like and comment for more uploads
Gbpjpyshort
YEN STRIKES BACK- GBPJPY UNDER PRESSURE - POSSIBLE PRICE DECLINESymbol - GBPJPY
The GBPJPY currency pair is currently exhibiting signs of a localized bearish trend, influenced in part by a broader correction in the US dollar. As a result, the Japanese yen is gaining strength, applying downward pressure on the pair.
Price action is retracing back into a key range and encountering significant resistance levels. The pair has moved below a critical resistance zone and is consolidating within a selling area, suggesting potential for a continued decline toward identified support and liquidity zones.
From a technical perspective, the broader trend remains neutral; however, GBPJPY appears to be reacting to a notable resistance level, potentially initiating a corrective pullback. Should bearish momentum persist and the price remain below the 193.45-193.74 resistance band, further downside movement is likely.
Key Resistance Levels: 193.45, 193.74, 194.22
Key Support Levels: 193.04, 192.35, 191.65
Sustained consolidation below the 193.45-193.74 resistance zone would confirm bearish control over the range top. In such a scenario, a continuation of the sell-off is anticipated, with price likely targeting the aforementioned support and liquidity zones.
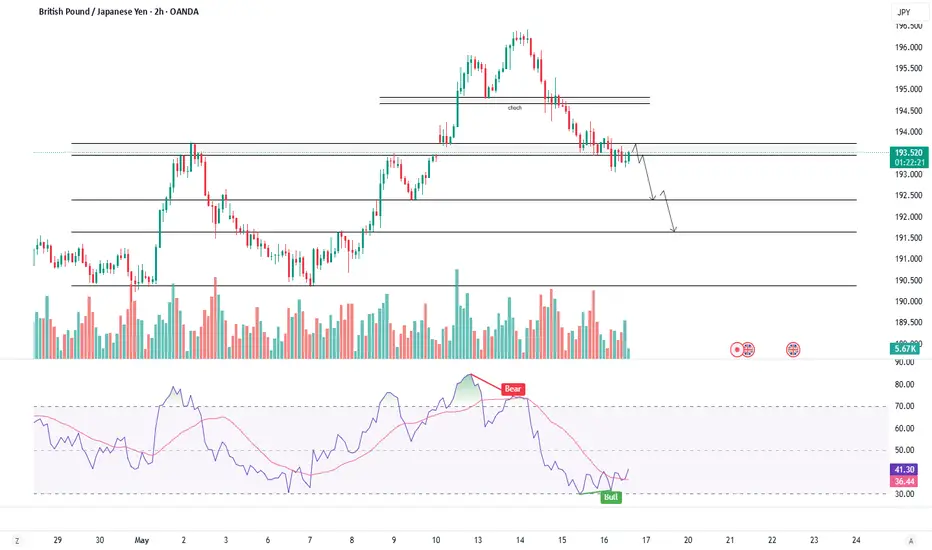
GBP/JPY) Bearish analysis Read The ChaptianSMC Trading point update
GBP/JPY 2-hour chart outlines a clear bearish setup within a well-defined downtrend. Here's a breakdown of the trading idea:
---
Technical Overview:
Downtrend Channel:
The pair is respecting a downward-sloping channel, with repeated rejections at the upper boundary, confirming bearish control.
Resistance Zone (~187.8 - 188.5):
Price has reached a highlighted resistance area that aligns with previous swing highs and trendline resistance — marked with red arrows for prior rejections.
Bearish Projection:
The analysis anticipates a rejection from this resistance zone followed by a downward impulse move. A pullback is expected, but continuation toward the target support zone around 179.150 is likely.
Target Zone (~179.150):
This level lines up with previous price action and matches the measured move (blue vertical box), adding confluence.
EMA 200 (around 190.36):
Price is well below the 200 EMA, reinforcing the bearish structure and trend bias.
RSI Indicator (~52):
RSI is slightly above 50 but not bullish — this neutral reading suggests the pair has room to drop if resistance holds.
Mr SMC Trading point
---
Trading Idea Summary:
Bias: Bearish
Entry Zone: 187.8 – 188.5 (resistance)
Confirmation: Bearish candlestick pattern or rejection signal
Target: 179.150
Invalidation: Break and close above 190.365 (above EMA 200 and prior highs)
---
plase support boost 🚀 analysis follow)

GBP/JPY Technical Analysis: Bearish Rejection at Key Resistance?This chart represents a GBP/JPY (British Pound / Japanese Yen) 30-minute timeframe analysis. Here are the key takeaways:
Technical Indicators & Levels
Exponential Moving Averages (EMAs)
200 EMA (Blue Line): 193.586 – A long-term trend indicator.
30 EMA (Red Line): 193.182 – A short-term trend indicator.
Key Levels
Resistance Zone (Stop Loss Level): 193.968
Support/Target Zone: 191.628
Current Price: 193.255 (as per the last recorded candle)
Trade Setup & Market Structure
Bearish Outlook (Sell Scenario)
The price is approaching a strong resistance zone (193.968), which aligns with the 200 EMA.
The price might reject this level and drop toward the target area of 191.628 (approx. 1.00% downside).
The drawn price path suggests a possible retest of resistance before a bearish move.
Bullish Reversal (Invalidation of Bearish Setup)
If the price breaks and holds above 193.968, it could invalidate the bearish setup and push higher.
A sustained move above the 200 EMA may indicate a trend shift to bullish.
Conclusion
Bearish bias as long as the price stays below 193.968.
A possible short trade opportunity if resistance holds, targeting 191.628.
Caution: If price breaks above resistance, it could lead to a bullish breakout

GBP/JPY Short Trade Setup – Bearish Reversal PotentialThis chart represents a GBP/JPY (British Pound to Japanese Yen) 1-hour timeframe trade setup with a clear short (sell) position strategy. Here's a breakdown:
Key Levels:
Entry Point: 📍 192.894 (near current price 192.771)
Stop Loss: ❌ 193.542 (above entry, marking a point where the trade will be exited if it moves against expectations)
Take Profit Targets:
TP1: 🎯 192.258
TP2: 🎯 191.688
Final Target: 🎯 190.755
Trade Strategy:
The trader is anticipating a downward movement in GBP/JPY from the entry zone.
Stop loss is placed above recent highs, ensuring risk management.
Take profit levels are structured to secure partial profits as the price moves down.
Market Context:
Current Price: 🟡 192.771 (slightly below entry)
If price rejects from the entry zone (192.894) and starts moving down, the trade could play out successfully.
A break above 193.542 would invalidate this trade, suggesting further bullish momentum.
Conclusion:
📉 Bearish Bias – Expecting a drop in GBP/JPY price
🎯 Risk-Reward Setup Looks Favorable
⚠️ Watch for Rejections at Entry Zone & Market Trends

GBP/JPY Trading Strategy – Short to Target 185I. Technical Analysis
1. Overall Trend
On the H4 timeframe, GBP/JPY remains in a downtrend, as indicated by:
Lower highs and lower lows.
Price trading below both the EMA 50 & EMA 200, confirming bearish momentum.
A weak pullback formation, suggesting a continuation of the downtrend.
On the D1 timeframe, GBP/JPY is moving within a descending channel, encountering resistance around 191.4 - 192.8 (previous swing high and descending trendline).
2. Key Resistance & Support Levels
✅ Strong Resistance (Sell Zone):
190.2 - 191.45: Confluence of the descending trendline + EMA 50 on H4.
192.8: Major resistance level and a logical Stop Loss placement.
✅ Target Support (Take Profit):
185.2 - 185.0: A strong support zone from the previous low.
✅ Indicators Confirmation:
Decreasing volume on price pullback, indicating weakening bullish momentum.
RSI below 50, not yet oversold, leaving room for further downside movement.
II. Trading Strategy
1. Entry Points
Sell GBP/JPY around 190.2 - 191.45 upon price testing resistance.
Consider splitting the order:
Sell 50% at 190.2
Sell remaining 50% at 191.45 (if price continues upward).
2. Stop Loss (SL)
192.8: A break above this level invalidates the bearish setup.
3. Take Profit (TP)
TP1: 187.0 → Close 50% of the position and move SL to breakeven.
TP2: 185.2 - 185.0 → Fully close the trade.
4. Risk/Reward Ratio (R:R)
Average Entry: 190.8
SL: 192.8 (-2.0 pips)
TP: 185.2 (+5.6 pips)
R:R = 2.8:1 → Reward is 2.8 times the risk, making this an attractive swing trade setup.
III. Risk Management & Market Scenarios
🔸 If Price Moves in Favor
✅ Upon reaching 187.0, move SL to breakeven, ensuring no risk exposure.
🔸 If Price Hits 192.8
❌ Exit the trade entirely, as the bearish structure is broken.
🔸 Key Observations
⚠️ If price aggressively rises to 191.45 with strong volume, wait for bearish confirmation before entering.
IV. Conclusion of me
Short GBP/JPY at 190.2 - 191.45, TP at 185.2 - 185.0, SL at 192.8.
Strong R:R ratio (2.8:1), suitable for swing trading.
Expected Holding Period: Until mid-week, closely monitoring price action.
Follow me now, good luck evrybody!

GBPJPY SHOWING A GOOD DOWN MOVE WITH 1:5 RISK REWARD GBPJPY SHOWING A GOOD DOWN MOVE WITH 1:5 RISK REWARD
DUE TO THESE REASON
A. its following a rectangle pattern that stocked the market
which preventing the market to move any one direction now it trying to break the strong resistant lable
B. after the break of this rectangle it will boost the market potential for break
C. also its resisting from a strong neckline the neckline also got weeker ald the price is ready to break in the outer region
all of these reason are indicating the same thing its ready for breakout BREAKOUT trading are follws good risk reward
please dont use more than one percentage of your capitalfollow risk reward and tradeing rules
that will help you to to become a bettertrader
thank you

GBPJPY - TRADING WITHIN TRAINGLE PATTERN FORMATIONSymbol - GBPJPY
The GBPJPY is currently trading within a symmetrical triangle pattern and recently experienced an attempt to breach resistance levels and rise. However, the momentum has proven insufficient, as market participants remain skeptical of any bullish movement, primarily due to the actions of the Bank of Japan. The Bank of Japan recently increased its interest rate by 0.25%, marking the highest level since 2008, in response to accelerating inflation and a slowing economy. The central bank has signaled that further rate hikes are possible if inflation continues to rise.
From a fundamental perspective, this could lead to a potential decline in the GBPJPY currency pair, although the strength of the British Pound against the US Dollar may mitigate this effect. Technically, the recent attempt to break resistance appears to be a false breakout, with the medium-term outlook influenced by both the technical structure and the Bank of Japan's actions.
Key resistance level: 195.00
Key support levels: 192.00, 190.50
It is possible that another attempt to test resistance will occur before a subsequent decline. Traders are increasingly building long positions on the Japanese Yen, which could result in a bearish correction for the currency pair.


SELL GBPJPYSell GBPJPY as it is in downtrend also it has made a pull back on important level and made bearish flag pattern good opportunity to sell

GBPJPYGreetings!
Welcome traders.
By choosing to "Follow", you can stay updated with the latest information promptly. Kindly consider clicking "Boost" as well.
Wishing you a pleasant day.

GBPJPYGreetings!
Welcome traders.
By choosing to "Follow", you can stay updated with the latest information promptly. Kindly consider clicking "Boost" as well.
Wishing you a pleasant day.

Sell Trade in GBPJPYBased on various data analysis like fib, structure etc. I see a potential sell opportunity in GBPJPY at the marked area.
Kindly do follow your own analysis as this not a trade recommendation.

GBPJPYGreetings!
Welcome traders.
By choosing to "Follow", you can stay updated with the latest information promptly. Kindly consider clicking "Boost" as well.
Wishing you a pleasant day.

Gbpjpy short possible Gbpjpy sell now 184.861
Sl 186.147
Tp 181.950
Lot size recommended 0.01 for 100 usd equity
Lot size recommended 0.10 for 1000 usd equity
Follower fxlifestylemanpritfx for more updates ✌️

GBPJPY SELLGreetings!
Welcome traders.
By choosing to "Follow", you can stay updated with the latest information promptly. Kindly consider clicking "Boost" as well.
Wishing you a pleasant day.

GBPJPY SELLGreetings!
Welcome traders.
By choosing to "Follow", you can stay updated with the latest information promptly. Kindly consider clicking "Boost" as well.
Wishing you a pleasant day.

GBPJPY ShortFOREXCOM:GBPJPY
Hello traders , here is the full multi time frame analysis for this pair, let me know in the comment section below if you have any questions, the entry will be taken only if all rules of the strategies will be satisfied. wait for more Smart Money to develop before taking any position . I suggest you keep this pair on your watchlist and see if the rules of your strategy are satisfied...
Keep trading
Hustle hard

gbp/jpy sell gbpjpy has broken down from the head and shoulder reversal pattern and is now heading lower. Yen has been strengthening overall and it is interesting to see that even the USDJPY pair has been struggling. There is some risk off in the financial markets as a whole and that seems to help yen. The target is the depth of the pattern and is marked on the chart. There can be a partial entry at the current price and then some more when the neckline is re-tested if at all.


GBPJPY MONTH TIME FRAME@717.347 All time High on 01Jan1975
@116.837 All time Low on 01Sep2011
GBPJPY market is falling down from 01Jan1975
As you see I marked 4 POI on month TF @208.117 and @188.631 this two POI are for short position. And if we see price is going to mitigate @188.631 my POI is calling them to mitigate there if you want to place order then place @188.631 short SL 198.358 TP 169.115 RR 1:2
Second short order @208.117 SL 221.481 TP 181.454 If price give us a breakout @215.892 which is high on 01Jun2008 we can see a BULL RUN ?! I don't know! But if price give us another breakout @251.115 which is also a high on 02Jun2007 then we can see a retrace and BULL RUN!
And another 2 POI is for long position @161.976 and @139.478
I Think GBPJPY market is doing good going good.
CHART LOOK'S GOOD AND CLEAR
WHOEVER IS READING THIS COMMENT, YOUR THOUGHTS, THANK YOU.

gbpjpy overbought #GBPJPY is in overbought area it can fall down most probably if it breaks this minor support
entry can be taken in 1hr tf

UPCOMING "GBPJPY" MOVEAs we can see the GBPJPY is moving in a channel in one day frame + in one week time frame too . In addition when RSI get above 70 level it retests but it reached above 80 lvl so there is a high chance of a retest and there is a rectangular zone which is a strong resistance which was tested for almost 13 times so another great reason for a rejection and now it has also get overbought in RSI in weekly timeframe . Now all we have to wait is for a perfect rejection so that we can open our short positions. GBPJPY has been reached to this lvl after 6-7 years.
