Bitcoin (BTC/USDT) 1-Hour Chart Analysis
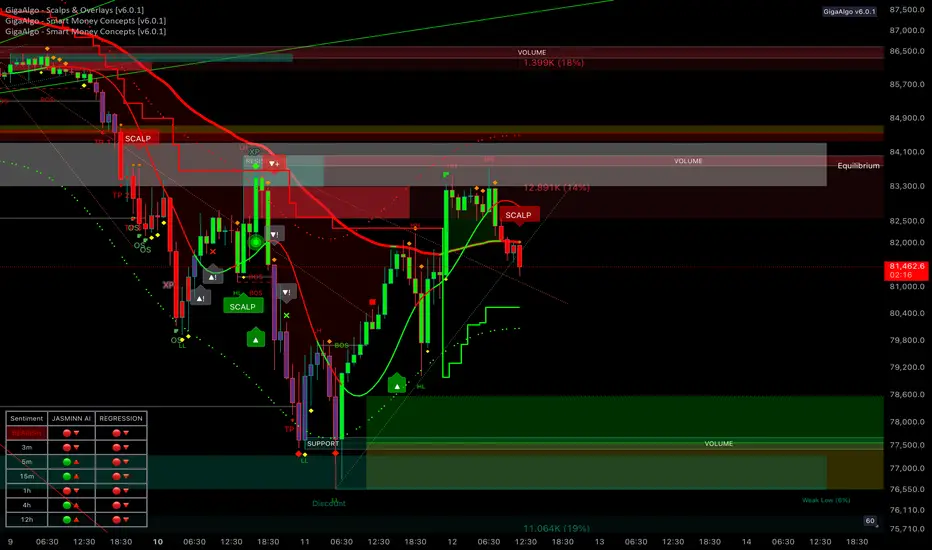
Bitcoin is showing signs of bearish pressure on the 1-hour chart after a recent rejection from a key resistance zone. The market structure reflects a mixed trend, with signs of higher and lower lows indicating ongoing volatility. A recent break of structure and expansion suggest that the market is at a turning point.
There’s a clear resistance zone where sellers have stepped in, creating strong selling pressure. On the other hand, a support zone below shows signs of buyer interest, which could act as a floor if the price continues to decline. The equilibrium point near the middle of this range represents a potential decision area for future price movement.
Market sentiment remains bearish across multiple timeframes, reinforcing the downside bias. If the price continues to reject resistance, it could drop toward the support zone, with further downside possible if buyers fail to hold the level. Conversely, a breakout above resistance could signal renewed bullish momentum and lead to higher levels. The current outlook remains bearish, with selling pressure dominating near resistance and moderate buyer interest at support.
Gigaalgo
Bitcoin Analysis: Testing Support LevelsAfter breaking down the critical support level at 95k, Bitcoin is showing strong downward momentum, heading toward the 89k zone. There’s significant buy volume building around the 89k level, indicating potential interest for a reversal or at least a temporary bounce.
Key areas to watch:
• If 89k holds, we could see a reversal or consolidation before another move.
• A break below 89k with sustained sell volume might open the door to lower levels.
I’ll monitor price action and volume closely to confirm any reversal signals or further downside continuation. Trade cautiously and always stick to your risk management strategy.
Let me know your thoughts in the comments!

CHZCHZUSDT is experiencing bearish momentum, with key support levels at $0.065-$0.068 potentially aiding a reversal. If support holds, the next target to watch is $0.089. RSI suggests oversold conditions, hinting at recovery potential. Monitor for bullish signals near support before entering.

Bank Nifty Under Bearish Radar: 50,000 in FocusAfter weeks of strong bullish momentum, Bank Nifty is now showing signs of bearish price action. The index faces selling pressure, likely due to profit booking and weak sentiment near recent highs.
Key support is seen around the 50,000 level, which could act as a critical zone for buyers to step in. However, with monthly options expiry approaching, volatility is expected to remain high, potentially leading to exaggerated moves.
Key Levels to Watch:
• Resistance: 52,500–53,000
• Support: 50,000
If 50,000 holds, we may see a rebound post-expiry, but a decisive break below this level could trigger further downside. Keep an eye on global cues, sectoral strength, and institutional activity for directional confirmation.
Strategy:
• Short-term Bears: Look for shorting opportunities below 50,000 with strict stop losses.
• Swing Traders: Wait for a bounce or reversal pattern near support for long opportunities.
• Options Traders: Use neutral strategies like straddles or strangles to capitalize on volatility.
Trade safe, and always manage your risk effectively.

BITCOIN 107600 BREAKOUTBitcoin’s breakout above 107,600 could signal a highly bullish move. Recent price action has been strong, almost unstoppable, with bulls liquidating shorts and driving the market toward new all-time highs.
Technicals align with this momentum, favoring continued upward action. However, the 107,600 resistance remains a key level, acting as a ceiling for now. A decisive breach with strong volume could open the doors to the next ATH. It’s a pivotal moment—watch closely!
