Wave‑C Done? Glenmark Primed for Trend ResumptionGlenmark Pharma (NSE: GLENMARK) – Professional Chart Analysis, Price Path & Trading Advice (educational)
Market structure and thesis
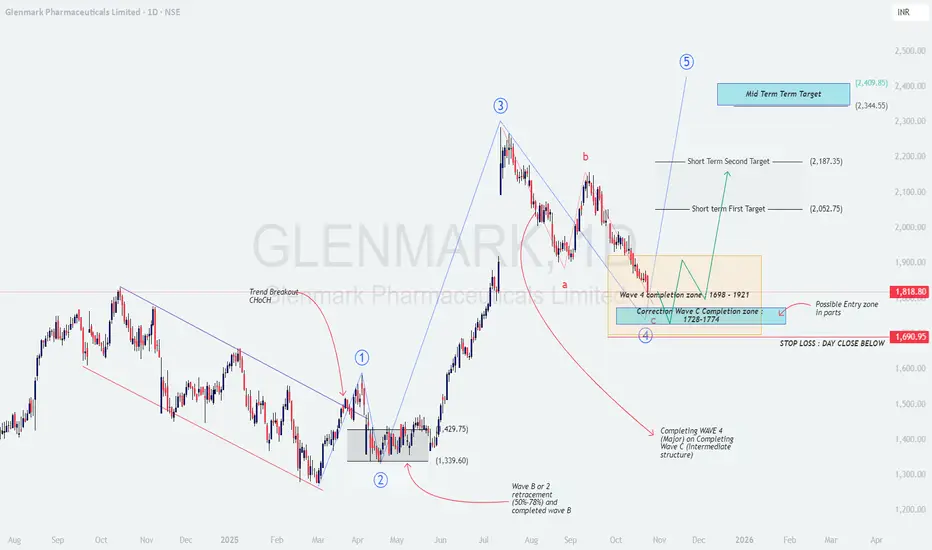
The chart shows a completed impulsive advance into Wave 3, followed by a corrective a‑b‑c decline progressing into the Wave‑4 completion zone 1,698–1,921 that overlaps with a deeper Wave‑C completion band 1,728–1,774 . This clustering of supports, plus a prior change‑of‑character (ChoCH) earlier in the cycle, suggests the correction is maturing and a new advancing leg is probable if price holds above the invalidation.
Candles in the box are showing decelerating downside and overlapping ranges, consistent with late‑stage corrective behavior; a higher low inside 1,74x–1,82x followed by a break of recent swing supply would confirm a trend inflection toward Wave‑5 projections.
Key levels to watch
Demand zones: 1,728–1,774 (C completion), 1,698–1,921 (Wave‑4 box).
Trigger levels: Reclaim and daily close above 1,880–1,900 improves odds; a stronger confirmation is a close above 1,940–1,960 (box top/supply shelf).
Invalidation: Day close below ~1,691 cancels the bullish swing setup and opens risk to lower retracements.
Price movement prediction
Base case (probability favored): Stabilization above 1,74x–1,82x → break and hold above 1,900 → push to Short‑Term T1 ≈ 2,053 , then Short‑Term T2 ≈ 2,187 as supply pockets get cleared. Sustained momentum and broader sector tailwinds can extend toward a mid‑term Wave‑5 objective 2,345–2,410 .
Alternate (bearish): Failure to hold 1,74x–1,80x with a daily close below 1,691 shifts bias to distribution; expect a slide to prior swing supports before a fresh base is attempted. In this path, avoid bottom‑fishing and wait for a new ChoCH and higher‑low structure.
Trade plan ideas
Accumulate in parts: Stagger entries 1,74x–1,82x with a core risk defined by a day‑close stop below 1,691.
Confirmation add: Add on daily close above 1,900–1,920 and again above 1,940–1,960 if volume expands.
Profit taking: Scale 30–40% near 2,05x, another tranche around 2,18x; trail the remainder with a daily/weekly higher‑low stop for a potential run toward 2,35x–2,41x.
Logic and validation checklist
Confluence: Wave‑4 price box overlaps Wave‑C termination band → strong probability of correction end if defended.
Structure: Need a higher low plus break/retest of 1,90x–1,96x to confirm demand dominance.
Momentum: Look for improving RSI/MACD and rising green‑day volume on pushes through supply.
Disclaimer: This post is for education only and not investment advice or a solicitation to buy/sell securities; I am not a SEBI registered analyst .
Glenmark_analysis
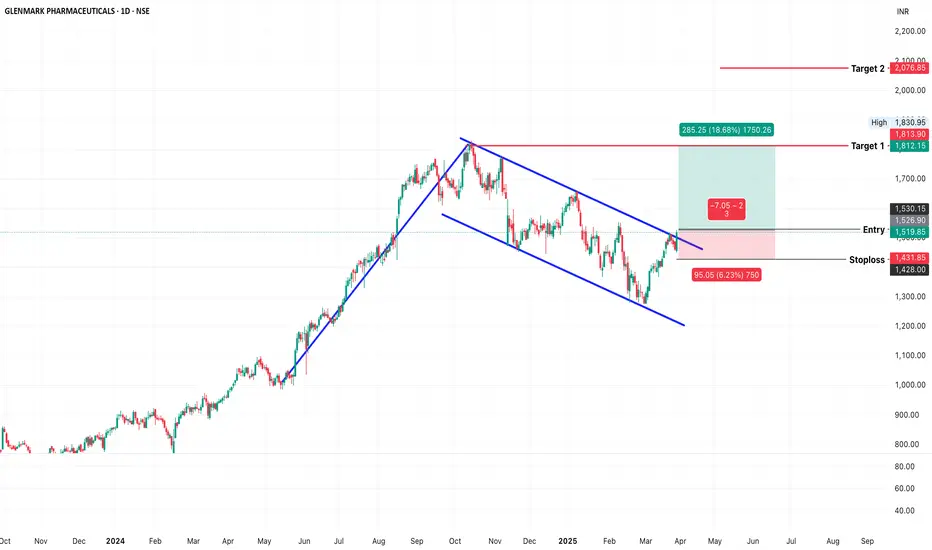
GLENMARK PHARMA (NSE: GLENMARK) – Confirmed Channel BreakoutGlenmark Pharma has confirmed a breakout from a falling wedge and flag & pole pattern , supported by strong volume and a bounce from the 200 EMA . Price structure and momentum suggest bullish continuation.
Key Observations:
Pattern Formation: Falling wedge + flag & pole since September 2024
Breakout Confirmation: Closed above upper trendline at ₹1,519.85 on March 27, 2025
200 EMA Support: Price took support at 200 EMA and reclaimed both key moving averages
Volume Spike: High volume on breakout candle validates the move
Support & Resistance Levels:
Immediate Support: ₹1,432
Breakout Level (Entry): ₹1,520
Target 1: ₹1,813
Target 2: ₹2,076
Major Resistance: ₹2,100
Indicators & Risk-Reward:
✅ RSI: 64.92 – showing strong bullish momentum
✅ Volume: Significant volume surge during breakout
✅ Risk-to-Reward: ~1:3 – ideal for swing setup
Verdict: Bullish
With pattern breakout, volume confirmation, and RSI strength, Glenmark is poised for a potential up-move.
Plan of Action:
BUY: ₹1,520
Stop Loss: ₹1,432
Target 1: ₹1,813
Target 2: ₹2,076
Trailing SL: Start trailing above ₹1,650 to protect profits