Wave‑C Done? Glenmark Primed for Trend ResumptionGlenmark Pharma (NSE: GLENMARK) – Professional Chart Analysis, Price Path & Trading Advice (educational)
Market structure and thesis
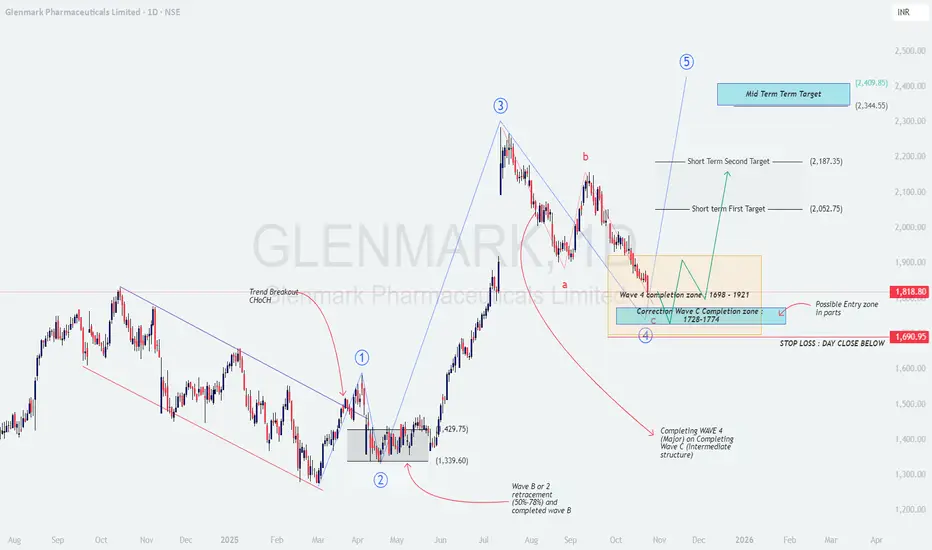
The chart shows a completed impulsive advance into Wave 3, followed by a corrective a‑b‑c decline progressing into the Wave‑4 completion zone 1,698–1,921 that overlaps with a deeper Wave‑C completion band 1,728–1,774 . This clustering of supports, plus a prior change‑of‑character (ChoCH) earlier in the cycle, suggests the correction is maturing and a new advancing leg is probable if price holds above the invalidation.
Candles in the box are showing decelerating downside and overlapping ranges, consistent with late‑stage corrective behavior; a higher low inside 1,74x–1,82x followed by a break of recent swing supply would confirm a trend inflection toward Wave‑5 projections.
Key levels to watch
Demand zones: 1,728–1,774 (C completion), 1,698–1,921 (Wave‑4 box).
Trigger levels: Reclaim and daily close above 1,880–1,900 improves odds; a stronger confirmation is a close above 1,940–1,960 (box top/supply shelf).
Invalidation: Day close below ~1,691 cancels the bullish swing setup and opens risk to lower retracements.
Price movement prediction
Base case (probability favored): Stabilization above 1,74x–1,82x → break and hold above 1,900 → push to Short‑Term T1 ≈ 2,053 , then Short‑Term T2 ≈ 2,187 as supply pockets get cleared. Sustained momentum and broader sector tailwinds can extend toward a mid‑term Wave‑5 objective 2,345–2,410 .
Alternate (bearish): Failure to hold 1,74x–1,80x with a daily close below 1,691 shifts bias to distribution; expect a slide to prior swing supports before a fresh base is attempted. In this path, avoid bottom‑fishing and wait for a new ChoCH and higher‑low structure.
Trade plan ideas
Accumulate in parts: Stagger entries 1,74x–1,82x with a core risk defined by a day‑close stop below 1,691.
Confirmation add: Add on daily close above 1,900–1,920 and again above 1,940–1,960 if volume expands.
Profit taking: Scale 30–40% near 2,05x, another tranche around 2,18x; trail the remainder with a daily/weekly higher‑low stop for a potential run toward 2,35x–2,41x.
Logic and validation checklist
Confluence: Wave‑4 price box overlaps Wave‑C termination band → strong probability of correction end if defended.
Structure: Need a higher low plus break/retest of 1,90x–1,96x to confirm demand dominance.
Momentum: Look for improving RSI/MACD and rising green‑day volume on pushes through supply.
Disclaimer: This post is for education only and not investment advice or a solicitation to buy/sell securities; I am not a SEBI registered analyst .
Glenmarkanalysis
GLENMARK - Strong Option Chain Signals for Potential Trade SetupBias:
Bullish Bias with Aggressive Call Writing Unwinding and Strong Call Long Build-Up
Strong OI additions in OTM Calls; downside Put writing limited
________________________________________________________________________________
Best CE:
Strike: 2000
LTP: ₹42.1
OI: 28,83,750 (+12,32,625 | +74.65%)
Volume: 15,350
Build-Up: Long Build-Up
Interpretation: Strong aggressive buying; potential breakout above 2000
________________________________________________________________________________
Best PE:
Strike: 1700
LTP: ₹10.0
OI: 9,27,000 (+3,60,750 | +63.71%)
Volume: 4,059
Build-Up: Short Build-Up
Interpretation: Put writing — indicates strong support near 1700
________________________________________________________________________________
Best Strategy:
Bull Call Spread
(Buy 2000 CE, Sell 2120 CE)
- Capitalizes on upward momentum
- Defined risk & reward
- High probability based on CE buildup from 1920 to 2120
________________________________________________________________________________
Why:
- Multiple strikes (1920, 1960, 2000, 2120) with **Long Build-Up in Calls**
- Lower strikes (1860–1900) showing **Short Covering**, confirming up-move strength
- No significant Put Long Build-Up — bearish bets not seen
- 2000 CE has highest bullish action → Key breakout level
- Spot at ₹1904 is very close to these active strikes
________________________________________________________________________________
⚠️ Disclaimer (Please Read):
• This chart is shared for educational purposes only and is not investment advice.
• I am not a SEBI-registered advisor.
• The information provided here is based on personal market observation.
• No buy/sell recommendations are being made.
• Please do your own research or consult a registered financial advisor before making any trading decisions.
• Trading involves risk. Always use proper risk management.
________________________________________________________________________________
💬 Found this helpful?
Drop your thoughts or questions in the comments below ⬇️
🔁 Share this post with your trading community.
✅ Follow simpletradewithpatience for price-action backed technical setups.
🚀 Let’s trade with patience, logic, and clarity!
Be Self-Reliant | Trade with Patience | Learn with Logic
________________________________________________________________________________
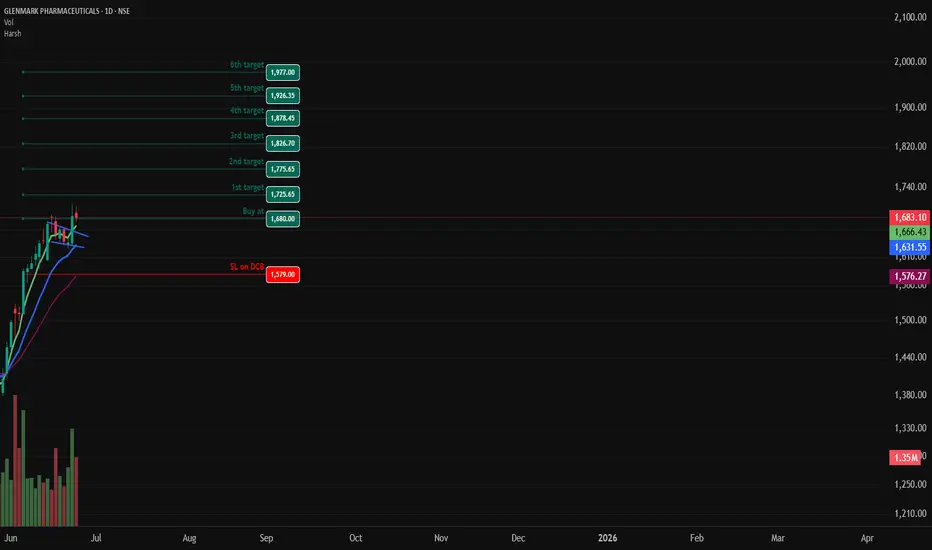
GLENMMAR PHARMACUITCAL- Bullish Flag & Pole Breakout (Daily T/F)Trade Setup
📌 Stock: GLENMARK PHARMACUITICALS ( NSE:GLENMARK )
📌 Trend: Strong Bullish Momentum
📌 Risk-Reward Ratio: 1:3 (Favorable)
🎯 Entry Zone: ₹1680.00 (Breakout Confirmation)
🛑 Stop Loss: ₹1579.00 (Daily Closing Basis) (-6 % Risk)
🎯 Target Levels:
₹1725.65
₹1775.65
₹1826.70
₹1878.45
₹1926.35
₹1977.00 (Final Target)
Technical Rationale
✅ Bullish Flag & Pole Breakout - Classic bullish pattern confirming uptrend continuation
✅ Strong Momentum - Daily RSI > 60, Weekly RSI >60 Monthly rsi >60
✅ Volume Confirmation - Breakout volume 1.93M vs previous day's 1.16M
✅ Multi-Timeframe Alignment - Daily and weekly charts showing strength
Key Observations
• The breakout comes with significantly higher volume, validating strength
• Well-defined pattern with clear price & volume breakout
• Conservative stop loss at recent swing low
Trade Management Strategy
• Consider partial profit booking at each target level
• Move stop loss to breakeven after Target 1 is achieved
• Trail stop loss to protect profits as price progresses
Disclaimer ⚠️
This analysis is strictly for educational purposes and should not be construed as financial advice. Trading in equities involves substantial risk of capital loss. Past performance is not indicative of future results. Always conduct your own research, consider your risk appetite, and consult a financial advisor before making any investment decisions. The author assumes no responsibility for any trading outcomes based on this information.
What do you think? Are you watching NSE:GLENMARK for this breakout opportunity? Share your views in the comments!
Glenmark Pharmaceuticals | Downside PossibleMaking lows in all higher time frames
Current area is a daily supply zone as well as a trend line rejection zone
Current area of entry near 1400 - 1420
Upside SL above 1440
Downside targets near 1280 - 1300
Lower time frame confirmation compusory
Glenmark - BeraishStock in DBD - Base Zone
It also happens to be a flip zone
Zone area from 1390 - 1435
Rejection in this area very much possible
Any signs of bearishness in LTF will be significant for entry
Expect downside Targets upto 1340 / 1300

Glenmark - Expecting a fallStock at Supply zone
as well as Flip (Support turned Resistance Zone)
Expecting stock to resist between 1650 to 1680
Will wait to at least form some bearish pattern in LTF chart
View negates above 1685
Downside target 1530 - 1510

Glenmark Life Sci - nice long setupA bullish flag & pole Chart Pattern Breakout on the Weekly Time frame of NSE:GLS
Price Action supported by very good volume.
The stock is currently in uptrend making higher highs and higher lows.
One can add this stock into their stocks to buy list and initiate the long trade as per the levels mentioned on the chart
Stop loss will be on a Weekly closing basis.
Trend Analysis :- UP Trend
Chart Pattern :- Bullish flag & pole Chart Pattern
Technical Indicator :- possible Positive MACD Crossover
Disclaimer: This is for educational purpose only.

GLENMARK IMPORTANT LEVELSAnalyzing Glenmark on a follower's request. Glenmark is current trading in a range where the upper level is 925 and lower level is 840. No trade until the stock breaks the range. If it breaks the support trend line on the downside, much lower levels can be seen.
To motivate us, Please like the idea If you agree with the analysis.
Happy Trading!
InvestPro India

GLENMARK: Swing tradeBouncing from th support zone making higher highs and higher lows on lower degree time frame. Stock is likely to hold above 670 zone and move up towards 830-840 in the coming days.

Glenmark Analysis 52W BOStock is trading near 52W high BO, if broken, will move to future targets as indicated on chart.

GlenMark Pharma BreakoutA Perfect breakout happend in GlenMark Pharma at 1D Candle & Looking at Weekly chart its also looking best now we can see such good move in Upcoming Session.
KEEP AN EYE ON IT.....

Glenmark Ascending Triangle formation Glenmark Ascending Triangle formation
bullish only above 410 closing for tp of 457-460
sl 378 on dc basis

#GLENMARK ANALYSISAs we can see that pharma sector started to trade above 200 DMA, and all pharma companies showing good green colours, follow chart for proper entry and exit. Auropharma worked well as analysed.

Glenmark pharma Glenmark Pharmaceuticals Limited is an Indian multinational pharmaceutical company headquartered in Mumbai, India.
Support and Resistance level

Glenmark breaking out from a structure The Scrip is trying to move out from a range after almost 5 months of consolidation, The Scrip was on a LL pattern on monthly/weekly chart but looking like it is about to break the trend.
For Swing traders
Can initiate longs once price sustain above 410 for a target target of 40 points, SL below 410 on Day closing basis,
#Note - The idea is shared for educational purpose and not a trade recommendation, Please trade after consulting your trade advisor. We don't give any assurance of profit or loss.

GLENMARK T1 Hit, T2 UpdatedNSE:GLENMARK
#NSE:GLENMARK T1 reached and T2 Updated !!
All the analysis shared in earlier chart.

GLENMARK Triangle BO !!NSE:GLENMARK
#NSE:GLENMARK formed Beautiful symmentrical triable and given BO.
Sustaining above trendline/400, may show very good momentum.
SL for safe players can mark 383.
Target Open.
*Only for Practice.


Glenmark Pharmaceuticals Ltd - 27.05.2022Glenmark Pharmaceuticals Ltd - 27.05.2022
The stock is trading @ 398 levels
There is a HAMMER & DOJI in Weekly Charts
The prices are below EMA
There is a HAMMER & DOJI in Daily Charts
There is a STOCHASTIC Bullish Divergence in Daily Charts
Let the prices go above 414 to initiate a BUY Position with support @ 376
watch out for the price action

GLENMARK Ascending triangle !!NSE:GLENMARK
#NSE:GLENMARK formed Ascending triangle.
Levels marked for practice.
Happy LEarning.

Glenmark...cmp 516...keep an eyeGlenmark...nice structure
Cmp 516
high probability setup
for a possible upswing soon

Glenmark Pharma in question Hello Traders, the last stock given here i.e Titan is still on the same levels we are waiting for a breakout so we can make a long position.
Now speaking of glenmark pharma, this stock is trading in a expanding wedge/triangle kind of pattern there are two trade possibilities to go long on this stock both are mentioned in the chart above so you can trade accordingly.
All the information required for the trade are mentioned in the chart above, please refer to the same
Please LIKE, COMMENT and SHARE to motivate and support me. I'll keep on posting new ideas on Indices & Stocks. Be sure to follow so that you don't miss any good trades that might have been rewarding.
Any comments and critiques will be appreciated even if it's of opposite view as a trader can also be right so many times.

GLENMARK READY FOR ROCKET MOVE......???GLENMARK IS TRADING IN A VERY TIGHT RANGE.......
Good Risk-Reward Ratio........
