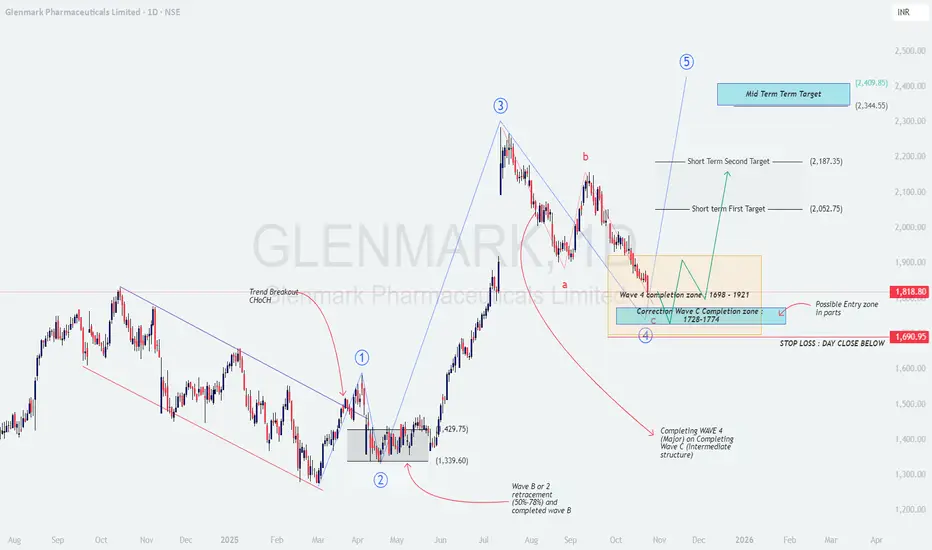
Wave‑C Done? Glenmark Primed for Trend ResumptionGlenmark Pharma (NSE: GLENMARK) – Professional Chart Analysis, Price Path & Trading Advice (educational)
Market structure and thesis
The chart shows a completed impulsive advance into Wave 3, followed by a corrective a‑b‑c decline progressing into the Wave‑4 completion zone 1,698–1,921 that overlaps with a deeper Wave‑C completion band 1,728–1,774 . This clustering of supports, plus a prior change‑of‑character (ChoCH) earlier in the cycle, suggests the correction is maturing and a new advancing leg is probable if price holds above the invalidation.
Candles in the box are showing decelerating downside and overlapping ranges, consistent with late‑stage corrective behavior; a higher low inside 1,74x–1,82x followed by a break of recent swing supply would confirm a trend inflection toward Wave‑5 projections.
Key levels to watch
Demand zones: 1,728–1,774 (C completion), 1,698–1,921 (Wave‑4 box).
Trigger levels: Reclaim and daily close above 1,880–1,900 improves odds; a stronger confirmation is a close above 1,940–1,960 (box top/supply shelf).
Invalidation: Day close below ~1,691 cancels the bullish swing setup and opens risk to lower retracements.
Price movement prediction
Base case (probability favored): Stabilization above 1,74x–1,82x → break and hold above 1,900 → push to Short‑Term T1 ≈ 2,053 , then Short‑Term T2 ≈ 2,187 as supply pockets get cleared. Sustained momentum and broader sector tailwinds can extend toward a mid‑term Wave‑5 objective 2,345–2,410 .
Alternate (bearish): Failure to hold 1,74x–1,80x with a daily close below 1,691 shifts bias to distribution; expect a slide to prior swing supports before a fresh base is attempted. In this path, avoid bottom‑fishing and wait for a new ChoCH and higher‑low structure.
Trade plan ideas
Accumulate in parts: Stagger entries 1,74x–1,82x with a core risk defined by a day‑close stop below 1,691.
Confirmation add: Add on daily close above 1,900–1,920 and again above 1,940–1,960 if volume expands.
Profit taking: Scale 30–40% near 2,05x, another tranche around 2,18x; trail the remainder with a daily/weekly higher‑low stop for a potential run toward 2,35x–2,41x.
Logic and validation checklist
Confluence: Wave‑4 price box overlaps Wave‑C termination band → strong probability of correction end if defended.
Structure: Need a higher low plus break/retest of 1,90x–1,96x to confirm demand dominance.
Momentum: Look for improving RSI/MACD and rising green‑day volume on pushes through supply.
Disclaimer: This post is for education only and not investment advice or a solicitation to buy/sell securities; I am not a SEBI registered analyst .
Glenmarkshare
Glenmark Pharmaceuticals | Downside PossibleMaking lows in all higher time frames
Current area is a daily supply zone as well as a trend line rejection zone
Current area of entry near 1400 - 1420
Upside SL above 1440
Downside targets near 1280 - 1300
Lower time frame confirmation compusory
Glenmark - BeraishStock in DBD - Base Zone
It also happens to be a flip zone
Zone area from 1390 - 1435
Rejection in this area very much possible
Any signs of bearishness in LTF will be significant for entry
Expect downside Targets upto 1340 / 1300

Glenmark - Expecting a fallStock at Supply zone
as well as Flip (Support turned Resistance Zone)
Expecting stock to resist between 1650 to 1680
Will wait to at least form some bearish pattern in LTF chart
View negates above 1685
Downside target 1530 - 1510

GLENMARK PHARMA for 75% (approx..) GainGLENMARK PHARMA is showing inverted Head and Shoulders Pattern Breakout on Monthly chart. Chart Pattern is 70% success rate and if it is show on higher timeframe success rate increase.
CMP : 690
TG : 1180
SL : Below 21 EMA
Stock's selection based on 5 Point Analysis:
1: Idea : Breakout.
2: Support : Volume, Delivery & VWAP.
3: Technical : 9/21/55/200-EMA, RS>0, MACD, RSI & Super trend up.
4: Fundamental : PE, PAT, Industry & peer PE and sector performance.
5: Timing : Entry Timing on Daily chart.
Disclaimer : It is my personal view as a trader and for educational purpose only. Equity market involves risk.
Please consult your financial adviser before taking any decision.

GLENMARK IMPORTANT LEVELSAnalyzing Glenmark on a follower's request. Glenmark is current trading in a range where the upper level is 925 and lower level is 840. No trade until the stock breaks the range. If it breaks the support trend line on the downside, much lower levels can be seen.
To motivate us, Please like the idea If you agree with the analysis.
Happy Trading!
InvestPro India

Glenmark pharma Glenmark Pharmaceuticals Limited is an Indian multinational pharmaceutical company headquartered in Mumbai, India.
Support and Resistance level


Glenmark Pharmaceuticals Ltd - 27.05.2022Glenmark Pharmaceuticals Ltd - 27.05.2022
The stock is trading @ 398 levels
There is a HAMMER & DOJI in Weekly Charts
The prices are below EMA
There is a HAMMER & DOJI in Daily Charts
There is a STOCHASTIC Bullish Divergence in Daily Charts
Let the prices go above 414 to initiate a BUY Position with support @ 376
watch out for the price action

Glenmark...cmp 516...keep an eyeGlenmark...nice structure
Cmp 516
high probability setup
for a possible upswing soon


Glenmark Ready to Bounce BackGLENMARK
Buy-Above 530
Sl-510
Target-580 600
This is a pullback trade as of now. It may me a long buildup candidate after some time.

GLENMARK Bullish Trend Alerttrend Details
1. primary trend chennel formation movement
2. secondary trend Rasing wedge pattern formation move up
3. red line upper level trade price you can expect the next speical circular level

Glenmark Pharma – Resistance Breakout above 531Stock has also broken out of Bearish Channel of 356 Points.
Target for same – 470+356 = 826
Fundamentally Stock can be valued at 776*30 ie 23280crs vs Current Market Cap of 15909 crs
Hence at 825 Rs Stock will be Fairly Priced
Technically Stock has broken and retested important Resistance level of 531. Hence more upside can be expected.
Long term Targets – 735, 940, 1154
SL – 514.85 (Weekly Close)
Duration -3 Years
Disc. : Views Shared for Education Purpose only. Consult your Financial Advisor before taking any position.


GLENMARK possibility of breakout (support level) SHORT STRATEGY
when price breaches 455.20 levels confirm it with retest then enter the trade.
exit - 407
(there is support level at 407 - if bears are still strong with increasing volume then hold it till you see otherways)
FUNDAMENTALS - glenmark fake rumor on covid vaccine had increased the price of the share drastically, later there was a correction in price. glenmarks recent quater result were not imperessive due to wish there was selling pressure in market.


Glenmark ShortIts a Narrow Cpr. Floor Pivots Says 200 SMA Hate candles. Take Short at 200 SMA...
Charts for educational purpose only

Glenmark in Range BoundGlenmark Range Bound
A little upmove can be seen
in good market condition.
Resistance is around 439 while
Support is around 413.
If breakdown, we may see
level of 405-400 In near term.
Updated on : 20 July 2020 8.00am.
Disclaimer: Only for Learning Purpose.


Glenmark clear BUYMonthly chart -
Target 675 - 740
1. Price Volume breakout over trendline.
2. MACD positive cross over
3. RSI down trendline is broken on the upside.
4. RSI and William at favorable values supporting a BUY.


