GMDC - Chart of The Week, Testing Trendline, Change of PolarityNSE:GMDCLTD has a beautiful structure on the Weekly Timeframe to qualify for my Chart of the Week idea. It saw Decent Above-Average Volumes and confirmed a Change of Polarity and is Now Testing the Falling Trendline with RSI and MACD trending upwards.
About:
NSE:GMDCLTD is primarily engaged in 2 sectors, i.e. mining and power. Its projects include Lignite, Bauxite, Fluorspar, Multi-Metal, Manganese, Power, Wind and Solar.
Trade Setup:
It could be a good Swing Trade if it breaks the trendline and the Change of Polarity is Still Intact.
If the Trade gets activated after breaking the trendline, then keep this Week's Low as the Stop Loss or Even Take RSI and MACD as a Stop Loss Signal.
📌Thank you for exploring my idea! I hope you found it valuable.
🙏FLLOW for more
👍BOOST if useful
✍️COMMENT below with your views.
Meanwhile, check out my other stock ideas on the right side until this trade is activated. I would love your feedback.
Disclaimer: "I am not SEBI REGISTERED RESEARCH ANALYST AND INVESTMENT ADVISER."
This analysis is intended solely for informational and educational purposes and should not be interpreted as financial advice. It is advisable to consult a qualified financial advisor or conduct thorough research before making investment decisions.
Gmdc

GMDC- HEADING FOR Rs.525?Government-Backed & Debt-Free
It’s a state-owned PSU with a debt-free balance sheet, offering financial stability and lower risk.
Consistent Profit Growth
Total Income: ₹904.5 Cr (↑ ~10% YoY)
Net Profit: ₹226.2 Cr (↑ ~20.8% YoY; ↑ ~53% QoQ from ₹147.7 Cr in Q3)
EBITDA: ₹311.8 Cr (↑ ~51% QoQ)

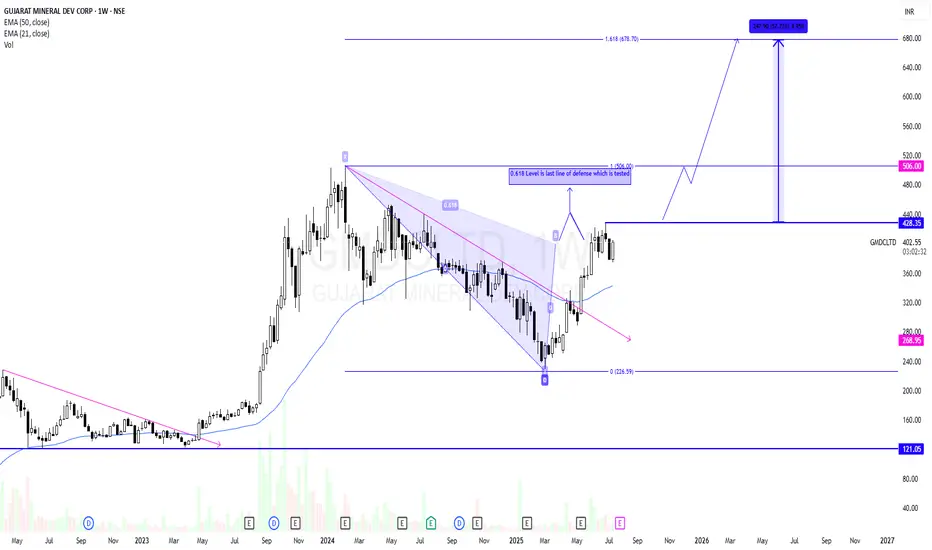
GMDCLTD - Potential Swing CandidateGMDCLTD has recently ended its correction phase and reversed. It has retraced till 0.618 level and has got a small rejection. 0.618 is last line of defence for sellers in many cases. Above 0.618 level a strong momentum likely to come.
Risk will be previous swing low after breakout.
As per price structure 430 is the last swing high. Breakout will start a strong momentum towards ATH and above that it is likely to test 678 as per Fib extension.
So put an alert to track this for your learning.
Learning Part :-
A rise in price then a correction in a channel formation is good to buy on breakout.
I am Not SEBI Registered
This is my personal analysis for my personal trading. Kindly consult your financial advisor before taking any actions based on this.
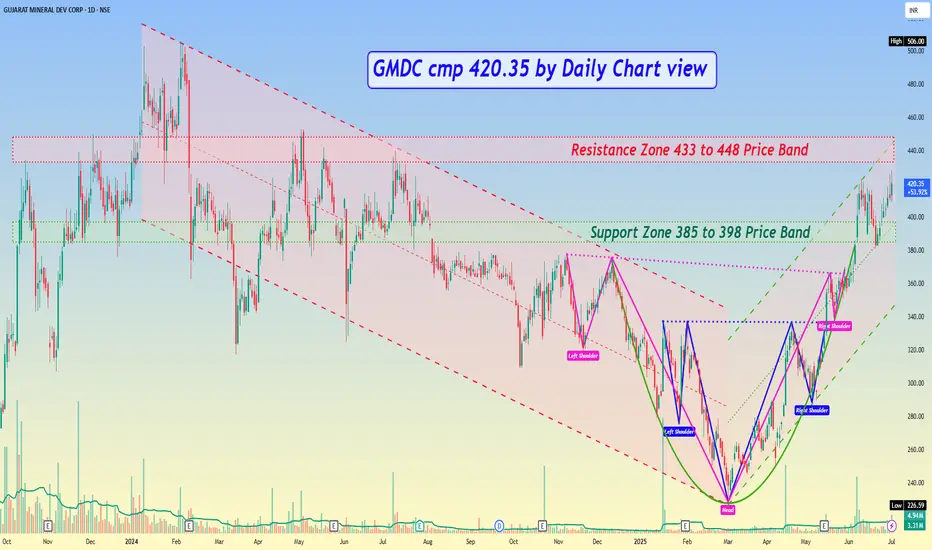
GMDC cmp 420.35 by Daily Chart viewGMDC cmp 420.35 by Daily Chart view
- Support Zone 385 to 398 Price Band
- Resistance Zone 433 to 448 Price Band
- Falling Price Channel to Rising Price Channel transition
- Volumes are in good sync with average traded quantity
- Double Head and Shoulders inclusive of Bullish Rounding Bottom
- Support Zone was tested retested and now attempts to crossover Resistance Zone
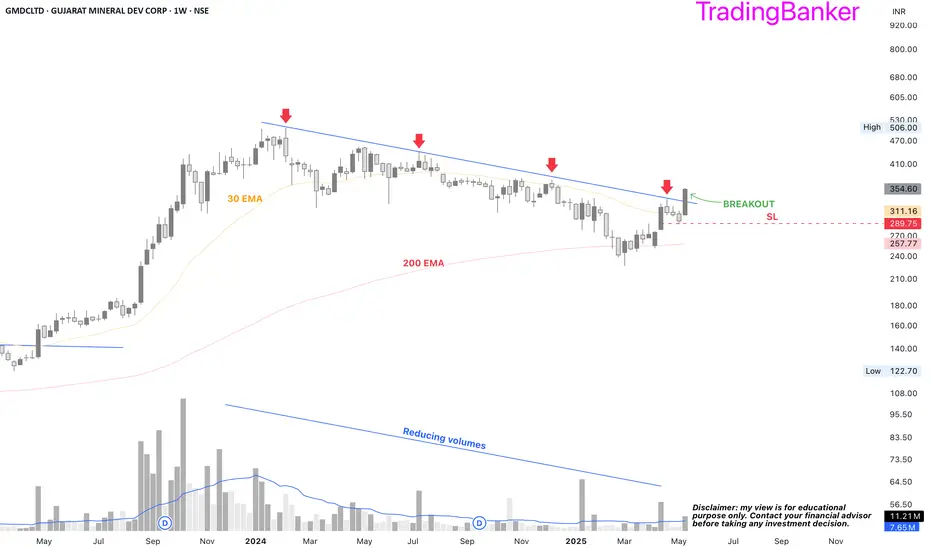
GMDC: a probable long🔸Trendline breakout
🔸30 EMA breakout
🔸Decent financials with 2nd highest ever sales and 3rd highest PAT
🔸Substantial promoter holding
🔸Increase in FII folding although marginal
🔸Capacity expansion underway would pave the way for the highest ever sales and PAT
🔸PE below the industry PE and PEG below 0.50
GMDC - Swing Trade Analysis - 9th July #stocksGMDC (1D TF) - Swing Trade Analysis given on 9th July, 2024
Pattern: SYMMETRICAL TRIANGLE BREAKOUT
- Resistance Trendline Breakout - Done ✓
- Strong Pullback candle with Volumes after consolidation - Done ✓
- Demand Zone retest for a Small SL and a better RR - In Progress
* Disclaimer
#GMDC #niftymetal #nifty500

GMDC predictions - not trade advise, sharing just for educationGMDC at important level to cross 510. Any long must be initiated above 510-520 range looking at price action.
Below 480 it can again move back the consolidation range so that is short opportunity level

GMDCLTD - Long Setup, Move is ON..NSE:GMDCLTD
✅ #GMDCLTD trading above Resistance of 471
✅ Next Resistance is at 588
Related charts:
Charts are self-explanatory. Levels of breakout, possible up-moves (where stock may find resistances) and support (close below which, setup will be invalidated) are clearly defined.
Disclaimer: This is for demonstration and educational purpose only. This is not buying or selling recommendations. I am not SEBI registered. Please consult your financial advisor before taking any trade.

MMTC 10 Year Breakouts1. **Technical Analysis**:
- The stock has experienced breakouts on multiple time frames: daily, weekly, and monthly. This is generally considered a positive sign in technical analysis, as it indicates strong upward momentum.
2. **Trading Recommendation**:
- The recommendation is to buy NSE:MMTC at around Rs 70.
- The target price (TRG) is set at Rs 100-125, which suggests an expectation of significant price appreciation.
- A stop-loss is placed at Rs 53.50, which is intended to limit potential losses in case the trade goes against the investor.
3. **News Event**:
- The stock's rise is attributed to the Indian government's approval of royalty rates for mining strategic minerals, specifically lithium, niobium, and rare-earth elements.
- This approval allows the government to auction blocks for these minerals in India for the first time.
- The royalty rates are specified as 3% for lithium and niobium and 1% for rare-earth elements.
- Royalty rates are important financial considerations for bidders in the auction of mineral blocks.
- India is currently conducting exploration for critical and strategic minerals.

GMDCLTD - Long Setup, Move is ON..NSE:GMDCLTD
✅ #GMDCLTD trading above Resistance of 375
✅ Next Resistance is at 471
Related charts:
Charts are self-explanatory. Levels of breakout, possible up-moves (where stock may find resistances) and support (close below which, setup will be invalidated) are clearly defined.
Disclaimer: This is for demonstration and educational purpose only. This is not buying or selling recommendations. I am not SEBI registered. Please consult your financial advisor before taking any trade.

GMDCLTD: 15 Year BreakoutGMDCLTD is breaking a 15 year close and reaching to All time high on good volumes and RSI

Getting ready for the good upside moveGMDC is providing a very good opportunity to go long.
Buy above 155 for a target of 244 in the next 1-3 months


GMDC | SWING TRADE SWING TRADE OPPORTUNITY
Stock has contracting and making triangular pattern from last year april and finally gives breakout in april this year with very good volumes. And from May, the stock is in consolidation phase which seems to an end. As soon as it comes out of consolidation its major resistance is 225, which is 28% from this price. Company is fundamentally strong and metal sector also done seems good from last 6 months.

GMDCNote:
1. Views are personal and for educational purposes only. Recheck and take the trade as per your RR.
2. Always remember SL is your lifeline, not the big target...
3. Follow us for more patterns and like, share so that we feel it is helpful to many and share more patterns...
3. Views given here is not a tip rather it is for educational purpose... Aftermarket opens, the condition might change so learn to handle different conditions...
Keep an eye ladies and gentlemen. Cheers and Happy Trading

Strong breakout in GMDCChart -> GMDC Limited Daily
A simple line, which acted as support and resistance before. Today broke out with volume.
CMP: 167
Good Range: 150 to 165
Target: 186.50, 218.50
SL: 148.50 Daily Close
Disclaimer: This is for educational purposes only, not any recommendations to buy or sell. As I am not SEBI registered, please consult your financial advisor before taking any action.

GMDC - DAY CHART - 14.01.2023 - BAHAVAN CAPITALGUJARAT MINING DEVELOPMENT CORPORATION as per day chart analysis
Stock ABOVE 163 TARGET 163
Wishing you a very Happy Pongal...

GMDC - DAY CHART - 11.01.2023 - BAHAVAN CAPITALGUJARAT MINING DEVELOPMENT CORPORATION as per day chart analysis
Stock ABOVE 157 TARGET 160
Once again FII Net selling had increased today at 2109.34 Cr and FII Net buying was at 1806.62 Cr.
From Jan 2nd - Jan 10th in these 7 trading sessions alone FII Net selling at 10125.91 Cr and DII Net Buying at 6286.99 Cr.
Bank Nifty looks weak with support at 41569 / 41295.
Nifty looks weak with Support at 17771
Happy Profitable Trading to all...

GMDC : Trendline Breakout#GMDC Beautiful Trendline Breakout
>> Good Risk Reward Ratio
>> Gujarat Election
>> Good Strength & Volumes
Happy Trading !!!
Keep Showing Love, Sharing & dont forget to follow

Price Action Chart Of #GMDCLTDIf looks like a breakout to happen in Gujarat Mineral, if the price sustains above 155 then it can hit 178 and 200.
CMP 155
TP1 178
TP2 200
TP3 220
#GMDCLTD

Time for next move?Chart -> GMDC Daily
Look at the red resistance line, from the same cup and handle breakout we got big up move. Now at same level, a cup handle breakout with volume is done.
CMP: 151
Targets: 162, 178
SL: 144 Daily Close
Disclaimer: This is for educational purposes only, not any recommendations to buy or sell. As I am not SEBI registered, please consult your financial advisor before taking any action.

Beautiful GMDCChart -> GMDC Daily
GMDC is forming a beautiful rounding bottom pattern, and also following all Fibonacci levels.
Today it gave brake out above 0.382 level and looks ready to test more levels.
CMP: 170
Target: 175, 188, 206
SL: 158
Disclaimer: This is for educational purposes only, not any recommendations to buy or sell. As I am not SEBI registered, please consult your financial advisor before taking any action.

GMDC….Make or BreakMake or break for GMDC…..if breakdown happens on Daily charts for Head & Shoulder Pattern….Big fall can be witnessed….Keep your SL 160 on closing basis…Also to be noted there is positive divergence on 1Hourly chart as well…Interesting to see price action tomorrow…Stay vigilant !
