GODREJ INDUSTRIES - Bullish Inverted H&S Breakout (Daily T/F)Trade Setup
📌 Stock: GODREJ INDUSTRIES ( NSE:GODREJIND )
📌 Trend: Strong Bullish Momentum
📌 Risk-Reward Ratio: 1:3 (Favorable)
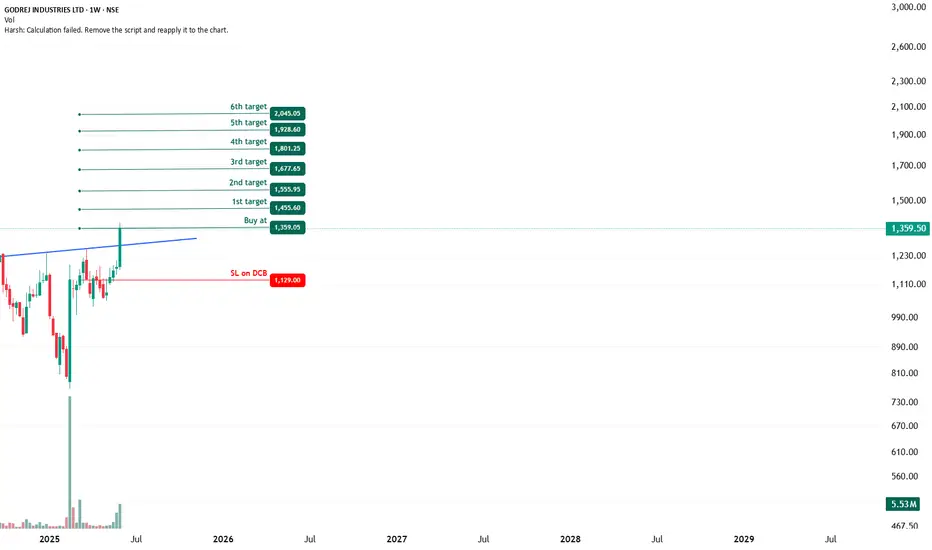
🎯 Entry Zone: ₹1359.05(Breakout Confirmation)
🛑 Stop Loss: ₹1129.00(Daily Closing Basis) (~5.6% Risk)
🎯 Target Levels:
₹1455.60
₹1555.95
₹1677.65
₹1801.25
₹1928.60
₹2045.05 (Final Target)
Technical Rationale
✅ Bullish Inverted Head & Shoulder Breakout - Classic bullish pattern confirming uptrend continuation
✅ Strong Momentum - Daily, Weekly & Monthly RSI >60 (Bullish Zone)
✅ Volume Confirmation - Breakout volume 5.53M(while posting) vs previous day's 3.46M (Nearly 1.8x surge )
✅ Multi-Timeframe Alignment - Daily, Weekly and €Monthly charts showing strength
Key Observations
• The breakout comes with significantly higher volume, validating strength
• Well-defined pattern with clear price & volume breakout
• Conservative stop loss at recent swing low
Trade Management Strategy
• Consider partial profit booking at each target level
• Move stop loss to breakeven after Target 1 is achieved
• Trail stop loss to protect profits as price progresses
Disclaimer ⚠️
This analysis is strictly for educational purposes and should not be construed as financial advice. Trading in equities involves substantial risk of capital loss. Past performance is not indicative of future results. Always conduct your own research, consider your risk appetite, and consult a financial advisor before making any investment decisions. The author assumes no responsibility for any trading outcomes based on this information.
What do you think? Are you watching NSE:GODREJIND for this breakout opportunity? Share your views in the comments!
Godrejindustriesprediction
Breakout: Godrej Ind Sustaining Above 1120, Targeting 1200+Details:
Asset: Godrej Industries Limited (GODREJIND)
Breakout Level: Sustaining above 1120
Potential Target: 1200+
Stop Loss: Below 1120 or as per risk tolerance
Timeframe: Short to medium-term
Rationale: Godrej Industries Limited (GODREJIND) has recently given a bullish breakout and is now sustaining above the 1120 level. This breakout suggests a continuation of the upward momentum, with the potential to reach or exceed the 1200 mark.
Market Analysis:
Technical Breakout: The breakout above 1120 indicates a strong bullish trend, suggesting further upside potential as the stock attracts more buying interest.
Market Sentiment: Positive sentiment around Godrej Industries, possibly driven by favorable market conditions or strong fundamentals, is likely supporting this bullish move.
Price Target:
The target for GODREJIND is set at 1200+, based on the sustained breakout above 1120 and the current bullish momentum.
Risk Management:
Implementing a stop loss strategy below 1120 is essential to manage risk in case of unexpected price reversals.
Timeframe:
The move towards 1200+ is anticipated in the short to medium-term, but actual timing may vary depending on market conditions.
Risk-Reward Ratio: Consider individual risk tolerance and adjust position size accordingly to maintain a favorable risk-reward ratio.
As with any investment opportunity, conduct thorough analysis and consider factors such as market trends, company fundamentals, and risk management strategies before making trading decisions.
