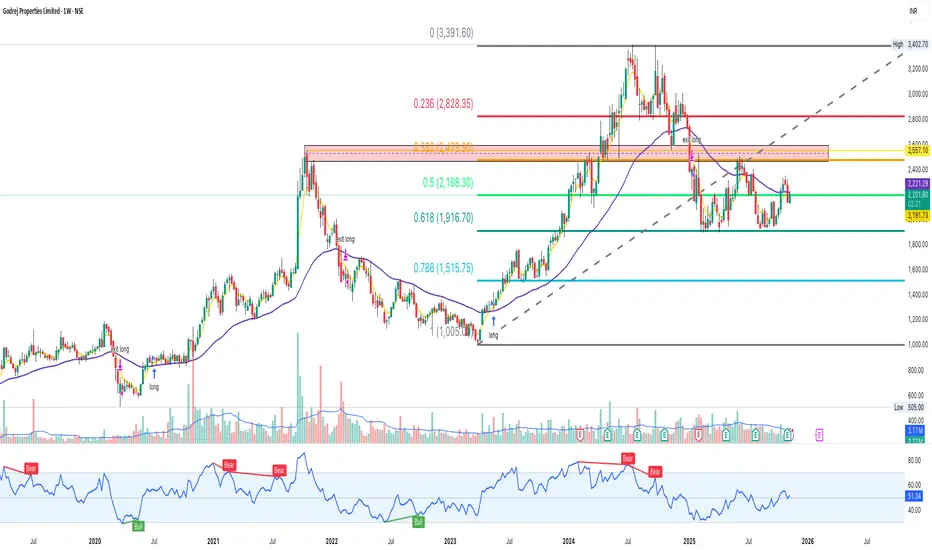
Godrej Properties #Screener — Hold Fib Levels After CorrectionGodrej Properties (NSE: GODREJPROP) is stabilising after a prolonged correction from the ₹3400 zone.
The stock has held key Fibonacci retracement levels and is now forming a base between ₹1900–₹2250 — a critical structure zone for trend continuation.
This behaviour is typical of strong mid-large caps that correct deeply, reset sentiment, and then rebuild a trend.
📌 Structure Highlights
Held 0.618 retracement (₹1916) perfectly — strong long-term support
0.50 level ₹2198 reclaimed → bullish sign
Price still below major supply around ₹2479–2557 (orange box)
Higher lows forming since the ₹1005 bottom
Trendline support from 2023 still valid (grey dotted line)
RSI showing slow momentum recovery after bearish cycle
📌 Key Levels to Track
Support Zones:
₹2190
₹1916 (major Fibonacci support)
₹1515 (0.786) — deeper trend support
Resistance Zones:
₹2221 (near-term resistance)
₹2479–2557 (strong supply zone)
₹2828 (0.236 retracement)
₹3390–3400 (major ATH resistance)
A clean weekly close above ₹2479–2557 would unlock higher trend continuation.
📌 Technical Snapshot
✅ Holding major Fibonacci structure
✅ Trendline support intact
✅ Slow volume expansion near base
✅ Higher lows forming
✅ Recovery setup, not breakout-chasing
Bias stays neutral to bullish above ₹1916, turning stronger above ₹2221.
📌 View
The stock is in a large consolidation zone after a strong multi-year rally.
Watching for a breakout from the ₹2479–2557 supply region to confirm trend continuation.
📒 Educational market structure analysis — not investment advice.
Godrejproperties
Godrej Properties Ltd : Dual Rounding Bottoms Pattern1. Overview
Godrej Properties Ltd. has exhibited a significant dual rounding bottom price pattern, indicating strong bullish reversals over extended periods. The first rounding bottom, spanning December 2021 to December 2023, was successfully completed, and its target was achieved according to the classical measurement rule.
Currently, the stock is forming a second rounding bottom between December 2024 and June 2025, signaling a potential new upward trend once confirmed. The RSI (Relative Strength Index) indicator also reflects this pattern by forming corresponding rounding bottoms, confirming positive momentum building at the indicator level.
2. Rounding Bottom Pattern: The rounding bottom is a long-term reversal pattern characterized by a smooth “U”-shaped price action that typically unfolds in three distinct phases:
Phase 1: Falling Prices with Rising Volume : Strong downtrend accompanied by rising volume reflects intensified selling pressure.
Phase 2: Falling Prices with Declining Volume: Price continues to drop but with diminishing volume, indicating that sellers are losing conviction.
Phase 3: Signs of Bullishness with Rising Volume: The emergence of bullish candles with rising volume signals growing demand and buyer interest.
3. Accumulation and Its Importance
Accumulation occurs during the rounding bottom's base formation, characterized by:
Three or more bottoms forming at nearly the same price level.
Volume contracting during price declines and expanding on minor upswings.
This pattern of price and volume confirms strong accumulation by informed investors, setting a foundation for the impending breakout.
The accumulation phase is crucial, as it represents the shift from seller dominance to buyer control, often preceding a significant price rally.
4. First Rounding Bottom (Dec 2021 – Dec 2023): Recap
The first rounding bottom completed a textbook formation over two years.
Following breakout above the neckline, the target price was met as per the classical measurement rule (distance from bottom to neckline projected upward).
Breakout was confirmed by a strong candle close above the neckline with rising volume, validating the reversal.
5. Current Second Rounding Bottom (Dec 2024 – June 2025)
Price action currently mirrors the classical three-phase rounding bottom structure:
Initial price drop with rising volume (Phase 1).
Subsequent price decline with decreasing volume (Phase 2).
Emerging bullish candles with increasing volume (Phase 3).
The key resistance level to watch is the neckline at ₹2500.
A sustained breakout above ₹2500 with a positive candle close and rising volume will confirm the pattern’s completion and trigger a strong bullish move.
6. RSI Confirmation
The RSI indicator is also forming a rounding bottom pattern synchronized with the price action. This alignment strengthens the validity of the pattern by confirming that momentum is gradually shifting from bearish to bullish territory. The RSI rounding bottom indicates that selling pressure is fading. Increasing RSI levels with rising volume provide a strong signal of increasing demand and improving momentum.
7. Conclusion & Trading Outlook
Godrej Properties shows a strong dual rounding bottom formation, with the first pattern successfully completed and the second underway:
The current phase suggests growing accumulation and increasing demand.
Confirmation awaits a breakout above ₹2500, validated by strong volume and bullish candle close.
The RSI rounding bottom adds conviction to this bullish setup.
Traders and investors should monitor volume and price action around the ₹2500 neckline for a confirmed breakout, which is likely to provide an attractive buying opportunity.
8. Risk Considerations
False breakouts or weak volume could invalidate the bullish outlook.
Broader market and sector-specific risks remain relevant.
Employ prudent risk management strategies with appropriate stop-loss placement.
Disclaimer: This report is intended for educational purposes and should not be considered financial advice. Please perform your own analysis or consult a professional before making investment decisions.

Godrej Properties Chart Analysis: Bullish or Bearish Move Ahead? Godrej Properties – Chart Analysis & Trading Strategy
Company Background:
Godrej Properties, a branch of the renowned Godrej Group, began its journey in the real estate sector in 1990.
The company has gained recognition for its focus on innovative and sustainable construction methods.
It actively develops eco-friendly housing and commercial infrastructure projects, especially in the mid-income segment.
Core Business Areas
Residential Projects: Offers a wide range—from budget homes to premium apartments—with sustainability as a core design principle.
Commercial Developments: Develops business parks, malls, and office complexes.
Sustainable Construction: Implements green building practices and energy-efficient technologies across its developments.
Subsidiaries Include:
Godrej Construction
Godrej Fund Management
Why Consider Godrej Properties for Long-Term Investment?
📈 Rising Demand in Mid-Segment Housing: Driven by demographic shifts and urban growth.
🔗 Smart Business Partnerships: Asset-light model helps reduce risk and capital expenditure.
🌱 Sustainability Appeal: Well-aligned with global ESG goals, making it attractive for ethical and green investors.
Godrej Properties Technical Analysis – Key Levels to Watch
Godrej Properties is currently trading near ₹2,460, showing strong momentum after a recent recovery. However, the stock is approaching a critical resistance zone that will determine its next major move.
Key Resistance Zone
Major Resistance: ₹2,550 – ₹2,575
This zone is crucial. A decisive breakout above ₹2,575 on strong volume can lead to significant upside.
Bullish Scenario (Breakout)
If the stock closes above ₹2,575, it may trigger a fresh rally.
First Target: ₹2,800
Second Target: ₹3,000
Momentum traders should watch for price action confirmation above this level for potential long entries.
Bearish Scenario (Rejection at Resistance)
If ₹2,575 is not breached, the stock may face selling pressure.
Immediate Support: ₹2,240 – ₹2,215
If this zone breaks, the next key level to watch is ₹2,000, which acted as a strong support in the past.
A breakdown below ₹2,000 could shift the trend to bearish in the medium term.
Summary
Current Price: ₹2,460
Critical Resistance: ₹2,550 – ₹2,575
Upside Targets: ₹2,800 → ₹3,000 (after breakout)
Downside Supports: ₹2,240 → ₹2,215 → ₹2,000
Traders should closely track price behavior around the ₹2,575 level, which is likely to define the next directional move. As always, use proper risk management and wait for confirmation before entering trades.
Like this analysis?
👍 Don’t forget to like, comment your views, and follow for more actionable stock insights and breakout trade setups!
📈 Stay tuned for latest updates, key level revisions, and momentum alerts on Godrej Properties and other trending stocks.

Godrej Properties - Possible scenario for results aheadAs the company is approaching for its results day & even the sector is expecting some surprises for them in this budget session. stock may try to go a little higher near areas 2225 - 2260
The above mention area happens to be a flip zone now and also DBD supply zone
Any selling pressure seen in LTF will trigger sell call with SL above 2265
If not then will have to wait till the stock approaches 2390 - 2450 area for sell

Godrej Properties - Expecting pullbackBelow 2500 up to 2400 seems to be a resting zone
Stock may spend some time in the zone before making an up move from here
View negation level 2390 (1 Hour close)
Options strategic entry possible if gives any sign in 1 hour chart

Godrej Properties cmp 2855.95 by Daily Chart viewGodrej Properties cmp 2855.95 by Daily Chart view
- Support Zone 2715 to 2788 Price Band
- Daily Support at 2715 > 2580 > 2455 with the Resistance at 2981 > 3121 > 3256
- Stock Price on the verge of either reversing from current status above Falling Resistance Trendline
- Stock Price is sustaining above Rising Support Trendline but may take a break down if selling continues

Godrej property Price Action.Godrej Prop form Cup and Handle pattern. It was given Break out of neck line 2550. As per chart it may test 4000 soon

Tagets Fibonacci Godrej PropertiesHELLO traders.
Kindly take the Trebding godrej properties target. Once it has been Closed above 3000 Levels Today. The Possible Target could be 3500 .
Plan accordingly great Place for Stop loss 3010 levels.

Swing Trade GODREJ PROP.In A Very bullish zone Right now.
Break of above resistance Channel. Changed the Move to the New degree.
Plan out for an Momentum swing trade .
Thank You

Buy Godrej Properties Short Term Trading Advice by Goodluck Capital
Buy Godrej Properties
Buy Range- 2760 - 2810
Target- 3000 - 3050
StopLoss- below 2680
Potential Return- 8-10%
Approx trade duration 14 - 15 days

Bullish Breakout: Godrej Properties Indicates Potential UpsideDetails:
Asset: Godrej Properties Limited (GODREJPROP)
Breakout Level: Sustaining above 2810
Potential Target: Upside momentum expected
Stop Loss: Below breakout level or as per risk tolerance
Timeframe: Short to medium-term
Rationale: Godrej Properties Limited (GODREJPROP) has recently broken out of a flat pattern and touched the 2810 level. Sustaining above this level could signify a bullish sentiment shift and pave the way for a significant upmove.
Market Analysis:
Technical Breakout: Breaking out of the flat pattern and sustaining above 2810 suggests a technical breakout, potentially attracting buying interest and driving the price higher.
Market Sentiment: Positive market sentiment or company-specific factors may be contributing to the anticipated breakout in GODREJPROP.
Price Target:
The potential upside target for GODREJPROP is not specified but is expected to be significant if the breakout sustains.
Risk Management:
Implementing a stop loss strategy below the breakout level is crucial to manage risk in case of unexpected price reversals.
Timeframe:
The projected upside move for GODREJPROP is based on a short to medium-term outlook, but actual timing may vary based on market conditions.
Risk-Reward Ratio: Consider individual risk tolerance and adjust position size accordingly to maintain a favorable risk-reward ratio.
As with any investment opportunity, conduct thorough analysis and consider factors such as market trends, company fundamentals, and risk management strategies before making trading decisions.

Property ke Bhav badhne Wale hai Hello Friends,
If you are looking for a blockbuster stock keep watch on Godrej property. All the other stocks in the same category have performed extra ordinarly. The reason I m bullish on this stock is because of their land ownership in Mumbai along with many other key places .This stock can be a Multibagger among all others .

GODREJPROPERTIES F&P BREAKOUTGodrej properties f&p pattern breakout
trading above 20 ema
good volume and rsi
EDUCATIONAL IDEA

Godrej Properties Ready to Fly !!#Godrej Properties showing strong signs for medium to long term.
#After a solid bull run since April 2023, consolidating for the past four months while maintaining a bullish structure.
#Weekly charts indicate a change-in-polarity pattern at Rs 1,500, confirming bullish sentiment.
#Detailed daily analysis reveals consistent trading above key moving averages and a bullish higher top higher bottom pattern.
#RSI consistently above 55 on all time frames, signaling a durable positive momentum.
#Anticipate upward movement with a potential target of Rs 2,125-2200. Recommend a stop-loss at Rs 1,500 for risk mitigation.
#CMP: 1784
#Potential Long Entry: 1800
Target 1: 2000-2050
Target 2: 2125-2230
Target 3: 2440-2490
#Stoploss: 1500
=> # Please do your own research before initiating any trade. Always use stoploss in order to protect your capital.
=> #If you are Unable to trade properly and dissatisfied with your manual trading results due to psychological disadvantages or busy schedule or "Fear & Greed" emotions, then Algorithmic trading can be the most useful solution to overcome such problems. Kindly follow us and join using details mentioned below the idea.
=> # Try our recently published indicators from the profile section if you find it useful give it a like.
=> # Follow us for more such information, educational ideas and Indicators. Give it a like if you appreciate the idea. Queries will be answered in comment section.
#Disclaimer: This is just a view and published here only for educational purpose, this should not be considered as a buy or sell signal. Trading in stock market may involve financial risk therefore, do your own research before taking any position.

GODREJ PROPERTIES MAKING INVERSE H&S WCBGodrej properties making inverse h&s pattern
on #weekly #chart
good volume and RSI
looking good for #target of 2500 in long term
educational idea only

godrej properties share name : GODREJ PROPERTIES
call type : positional
- share is forming a falling wedge pattern
- Moring star on C Point on weekly time frame
- we can see a good buying pressure on c point
currently share is in uptrend
- we can accumulate this share at current level
with stop loss of 1100 targets 1428,1544 in
upcoming months
Thanks

Godrej Properties Breakout from Weekly downtrendGodrej Properties has Broken down channel on Weekly Charts & started its Upward Journey again.
Targets coming 4000+ in next 2-3 Years.

godrej propertiesgodrej properties end two complex correction
1 zig zag correction
2 flat correction

Long Godrej PropertiesGodrej Properties is look good to buy. Selling pressure is reduced from the stock. Currently Stock is taking rejection from 200 EMA and support near the 1150 price level. Currently, 1150 INR is looking for good support for the stock and in the last trading price closed crossing 30 EMA. CMP is a good price to go long in the stock because here risk-reward is favorable.
As per the Fibonacci tool, we can consider 1450 INR 1st the target and 1650 INR second target.

Godrej Properties may go further down till 980 SL 1137As per Harmonic PRZ pattern, Godrej Properties may go further down till 980 and Stop loss will be 1137 lead time willbe till 15th April 2023

Godrej Property Short SellingInitiating a short trade at this level (1231) for a target of 1153 with 1284 stop.
Levels are marked on the chart.
Disclaimer: Before investing, please consult your FA.

Godrej Property reversal tradeInitiated a reversal trade in Godrej Properties. All the levels are marked on the chart.
Disclaimer: This is only for educational purpose, pls consult your FA before investing. Happy Trading.

GODREJPROP at Confluence of SupportsGODREJPROP chart on the weekly time frame is holding at a bunch of old supports. The stock is bouncing off its 200WMA from where it has bounced every time it has touched, since the beginning. The stock is also bouncing off 1225 support/resistance zone.
Looks like a great buying opportunity for 1-2 years for the stock to go up and ultimately reach its all-time high zone of 2600. Stop loss at risk-management zone of 1130.
