Gold Trades the Extremes as News Fuels Liquidity Games🟡 XAUUSD – Intraday Smart Money Plan (H1)
📈 Market Context
Gold remains highly sensitive today as markets react to President Trump’s announcement, keeping USD flows unstable and risk sentiment mixed. This environment favors liquidity engineering, not trend chasing. Institutions are exploiting news-driven emotions to distribute at premium and accumulate at discount.
With volatility elevated, expect false breaks, inducements, and stop hunts around key levels rather than clean directional moves.
🔎 Smart Money Technical Read
Current State:
Price is trading inside a managed range after a buy-side liquidity grab. Intraday structure shows distribution from premium, while downside moves are corrective rather than impulsive.
Core Idea:
Let price come to Smart Money — sell premium or buy deep discount only after confirmation.
Structure Observations:
• Buy-side liquidity already delivered
• Multiple CHoCH signals confirm corrective flow
• Price respecting descending internal channel
• Discount aligns with prior sell-side liquidity
• Premium capped by institutional supply & imbalance
Liquidity Zones & Key Levels
• 🔴 SELL GOLD: 5,020 – 5,060
• 🟢 BUY GOLD: 4,720 – 4,760
🧠 Institutional Expectation
Inducement → Liquidity sweep → CHoCH / MSS → BOS → displacement → OB / FVG entry → expansion
🔴 SELL Scenario — Premium Distribution
Sell Zone: 5,020 – 5,060
Conditions:
✔ Price taps premium / prior sell-high
✔ News-driven push into resistance
✔ Bearish CHoCH or MSS on M5–M15
✔ Downside BOS confirms intent
✔ Entry via bearish OB or FVG
Targets:
• 4,950 — internal reaction
• 4,820 — range low
• Trail if momentum expands
🟢 BUY Scenario — Discount Accumulation
Buy Zone: 4,720 – 4,760
Conditions:
✔ Sweep below sell-side liquidity
✔ Discount relative to HTF range
✔ Bullish CHoCH / MSS on LTF
✔ Strong displacement confirms buyers
✔ Entry from refined bullish OB
Targets:
• 4,850 — first reaction
• 4,980 — internal liquidity
• 5,050+ — if expansion resumes
⚠️ Risk Notes
• Expect fake breakouts during headlines
• No trade without structure confirmation
• Reduce size near news spikes
• Patience > prediction
📍 Summary
Gold is a Smart Money range play today:
• Sell strength at premium
• Buy weakness only at deep discount
📌 Follow @Ryan_TitanTrader for daily Smart Money gold breakdowns.
Gold

Breakdown or Breakout – Gold Compression Phase🔎 Market Context
• Gold is compressing within the 5000 – 5080 range
• Accumulation phase after the previous sharp sell-off
• Volatility is contracting → expansion is likely soon
• CPI & Non-Farm Payrolls are key catalysts
➡ Do not predict direction. Wait for a confirmed breakout.
📌 Strategic Zones
Resistance: 5078–5080 | 5100 | 5148 | 5200 | 5300 | 5345
Support: 5000 | 4980 | 4850 | 4830 | 4600 | 4400
• 5078–5080: Upper boundary of the range
• 5000: Lower boundary of the range
• 4980: Market structure decision level
⚖ Trading Bias
• Above 5080 → Favor upside continuation (Wave C extension)
• Below 4980 → Bullish structure breaks → favor downside
• Inside 5000–5080 → Compression phase, avoid FOMO
⚠ Key Notes
• Major data releases may cause false breakouts
• Wait for candle close confirmation
• Volatility likely to increase → manage risk carefully
• Avoid trading mid-range without clear edge

GOLD before Non-Farm: Sideways or a Trap?🌍 Macro Background
Continuing to monitor U.S. – Iran tensions and whether escalation occurs.
Japan: maintaining a weak JPY → USD remains supported.
A heavy news week ahead:
FED speeches (today)
Labor market data
Inflation data later this week
👉 Market sentiment remains cautious, waiting for a clearer directional catalyst.
📈 Trend & Structure
Overall price structure remains unchanged: Gold is in the final phase of a corrective rebound.
Upside momentum still exists, but limited, while reversal risk is increasing.
Price is consolidating near resistance → sideways conditions are favored.
🔴 Resistance – 🟢 Support
🔴 Resistance: 5,050 – 5,100
🟢 Near support: 4,980 – 4,950
🟢 Additional support: 4,930 – 4,936
🟢 Deeper support: 4,880 – 4,850
📊 Trading Scenarios
✅ Primary scenario (higher probability): Sideways – range trading
Sell reactions around 5,050
Condition: rejection candles / bearish confirmation
Buy technical pullbacks at support zones
Focus on M15 – H1, quick and disciplined trades.
⚠️ Alternative scenario (lower probability): Bullish breakout
Mandatory condition: H1 close clearly above 5,100
Only then consider buying the breakout.
🧠 Risk Management
Avoid holding large positions during:
FED speeches
Labor market & inflation releases
No FOMO — wait for candle confirmation.

GOLD before US Jobs & Inflation Data: Key Scenarios?🌍 Macro Context & Market Expectations
This week, the market is closely focused on:
US employment data
US inflation data (CPI / PCE)
Additionally, traders are monitoring:
Developments in US–Iran negotiations
US Supreme Court rulings related to trade tariffs
→ These factors may amplify short-term volatility, especially around key technical levels.
📈 Trend & Market Structure
Medium-term trend: BULLISH
Price has rebounded strongly from the ~4,700 low to around 5,04x
Last week printed a bullish Hammer candle, confirming long-term buying interest
On the H12 timeframe, the A–B–C corrective structure is not yet complete
Short term: price is consolidating within a tightening range, waiting for a clear breakout
🔑 Key Price Levels
🟢 Support:
5,000 | 4,950 | 4,930 | 4,850 | 4,700 | 4,650
🔴 Resistance:
5,050 | 5,095 | 5,100 | 5,110 | 5,200 | 5,300
🎯 Primary Scenarios
✅ Bullish continuation
Price holds above 4,930 and breaks decisively above 5,050
→ Potential upside toward 5,095 – 5,100, and further to 5,200 – 5,300
❌ Failed breakout / Pullback
Price fails to clear 5,050 and closes below 4,930
→ Likely correction toward 4,850, with deeper pullback to 4,700 – 4,650
🧭 Trading Strategy
Prioritize buy-the-dip opportunities in line with the trend
Avoid counter-trend shorts unless clear reversal signals appear at resistance
Stay patient and avoid FOMO — only trade when risk–reward is clearly defined

Gold trades cautiously as strong dollar impacts market.🟡 XAUUSD – Intraday Smart Money Trading Plan (H1)
📈 Market Environment
Gold remains highly reactive today as traders digest ongoing USD volatility driven by U.S. rate expectations and political headlines, keeping safe-haven flows unstable. Instead of clean trends, price action continues to favor range manipulation and liquidity-driven moves.
This backdrop supports a Smart Money environment where institutions engineer price into key extremes to trap late buyers and sellers before the real move unfolds.
🔎 Smart Money Technical Outlook
Current Condition:
Price is trading within a rising internal channel, respecting higher-lows while repeatedly reacting at premium and discount extremes. Recent moves show corrective pullbacks, not impulsive trend continuation.
SMC Bias:
➡️ Sell at premium
➡️ Buy only at deep discount
➡️ Entries only after structure confirmation
Key Observations:
• Prior buy-side liquidity already tapped
• Multiple CHoCH signals confirm rotational flow
• Price respecting internal trendlines
• Discount aligns with bullish order block
• Premium capped near previous target & imbalance
💧 Liquidity Zones & Key Levels
🔴 SELL ZONE: 5,100 – 5,102
🛑 Stop Loss: 5,110
🟢 BUY ZONE: 4,722 – 4,720
🛑 Stop Loss: 4,712
🧠 Institutional Playbook
Inducement → Liquidity sweep → CHoCH / MSS → BOS → displacement → OB entry → expansion
🔴 SELL Setup — Premium Distribution
Sell Area: 5,100 – 5,102
Execution Criteria:
Price reaches premium within channel
News-driven push into prior target zone
Bearish CHoCH / MSS on M5–M15
Clear downside BOS
Entry from bearish OB or FVG
Targets:
• 5,020 — first reaction
• 4,950 — mid-range liquidity
• Trail if downside displacement expands
🟢 BUY Setup — Discount Accumulation
Buy Area: 4,722 – 4,720
Execution Criteria:
Sweep of sell-side liquidity
Deep discount relative to range
Bullish CHoCH / MSS on LTF
Strong bullish displacement
Entry from refined bullish OB
Targets:
• 4,850 — internal reaction
• 4,980 — liquidity magnet
• 5,100 — previous high if expansion continues
⚠️ Risk Management Notes
• Expect fake breakouts during headlines
• No confirmation = no trade
• Reduce risk during news spikes
• Let structure lead, not emotion
📍 Final Takeaway
Gold is not trending — it’s being engineered.
Sell strength at premium.
Buy weakness only at deep discount.
📌 @Follow Ryan_TitanTrader for daily Smart Money gold breakdowns.

Gold at highs; CPI, Fed bets impact liquidity.🟡 XAUUSD — Weekly Smart Money Plan (SMC)
📈 Market Context
Gold enters the new week in a liquidity-driven environment as traders react to hot U.S. CPI expectations, shifting Fed rate-cut odds, and volatile U.S. yields. News is fueling emotion and stop runs, not clean trends. This is prime conditions for Smart Money to distribute at premium and accumulate at discount.
Expect headline spikes, false breakouts, and engineered moves around key weekly levels.
Smart Money Technical Read
Current State:
After an impulsive bearish displacement from highs, price is now rotating inside a managed weekly range. Upside moves look corrective, while sell-offs are sharp and efficient — a classic sign of institutional control.
Core Bias:
Sell premium / Buy deep discount only after structure confirmation.
No chasing. Let price come to Smart Money levels.
Structure Notes:
• HTF buy-side liquidity already swept
• Bearish displacement signals distribution
• Internal rallies show weak follow-through
• Discount aligns with prior sell-side liquidity
• Premium capped by HTF supply zone
Liquidity Zones & Key Weekly Levels
🔴 SELL GOLD: 5150 – 5152 SL: 5160
🟢 BUY GOLD: 4580 – 4578 SL: 4570
🔴 SELL Scenario — Weekly Premium Distribution
Conditions:
✔ Price spikes into 5150–5152 on news or USD weakness
✔ Buy-side liquidity sweep above recent highs
✔ Bearish CHoCH / MSS on H1–M15
✔ Downside BOS confirms institutional intent
✔ Entry via bearish OB or FVG
Targets:
• 5020 — internal reaction
• 4800 — mid-range liquidity
• 4600s — weekly discount expansion
🟢 BUY Scenario — Weekly Discount Accumulation
Conditions:
✔ Sell-side liquidity sweep below 4580
✔ Deep discount vs weekly range
✔ Bullish CHoCH / MSS on LTF
✔ Strong bullish displacement
✔ Entry from refined bullish OB
Targets:
• 4750 — first reaction
• 4950 — internal liquidity
• 5100+ — if weekly expansion resumes
Institutional Playbook
Inducement → Liquidity Sweep → CHoCH/MSS → BOS → Displacement → OB/FVG → Expansion
Risk Notes
• Expect fake moves during CPI & Fed headlines
• No structure = no trade
• Reduce risk during news spikes
• Patience beats prediction
📍 Weekly Summary
Gold is a Smart Money range game this week:
• Sell strength at premium (5150s)
• Buy weakness only at deep discount (4580s)
Trade levels. Respect structure. Let liquidity do the work.
📌 Follow @Ryan_TitanTrader for Smart Money gold breakdowns.

Gold Faces Strong Selling PressureGold came under heavy selling pressure after failing to break above the 5,100 USD level overnight and subsequently falling below 4,900 USD during today’s trading session.
The US dollar climbed to its highest level in two weeks and appears to be extending its recent solid recovery from a four-year low, which is adding notable downside pressure to the precious metal.
In addition, the current corrective move is still struggling, as price remains below the trendline. As long as this trendline—and more importantly the recent high at 5,100 USD—is not convincingly broken, the path of least resistance remains to the downside.
What’s your view? How do you see the next move for OANDA:XAUUSD ?

Chumtrades XAUUSD Has Wave B finished?GOLD – DAILY PLAN
Has Wave B finished?
→ No confirmation yet.
Macro & Market Sentiment
US–Iran negotiations have been cancelled. Geopolitical risks remain, but not strong enough to trigger a new bullish wave.
Gold experienced a relatively calm trading session, failed to break above the key level around 5,100, and saw a moderate pullback during the US session.
The Daily candle formed a Spinning Top, indicating market indecision and consolidation, with a lack of momentum for a breakout.
👉 Macro factors are supporting prices, but not pushing the market into an immediate uptrend.
Technical Structure & Outlook
Price is still moving within a descending price channel.
On the H1 timeframe, price has broken above the 4,888 key level, showing a technical rebound.
However, the higher timeframe structure remains bearish, with no confirmed trend reversal.
→ Therefore, current rebounds are considered pullbacks within a downtrend.
Key Levels
Support: 4,810 | 4,830 | 4,700–4,750 | 4,650–4,624
Resistance: 4,950–5,000 | 5,100
Trading Scenarios
Primary strategy: Sell the rallies within the descending channel.
Look for SELL setups near resistance zones, targeting lower lows.
Momentum SELL may be considered if price clearly breaks below 4,882–4,890, with confirmation on H2 or H4, targeting around 4,810.
No BUY positions while price remains inside the descending channel.
👉 Only if price breaks and holds above 5,100, will we start reassessing a trend-following BUY scenario.
👉 Deeper pullbacks are viewed as potential zones for swing BUY opportunities, not short-term buys at this stage.
Note: The market is in a “confidence-testing” phase. Focus on zone-based trading, trend alignment, reduced position size, and avoid FOMO.

What’s Next for Gold?Gold’s sharp rebound from the recent lows has reignited calls for an immediate continuation toward new highs. But the structure tells a more nuanced story.
The rally so far looks less like fresh upside momentum and more like a classic relief move after forced liquidation.
The recent selloff flushed leverage aggressively. Stops were triggered, weak hands exited, and positioning reset fast. What followed wasn’t accumulation — it was short-covering and mean reversion.
This matters because markets that truly want to trend higher don’t need to retrace this violently first.
The key zone: supply above, not support below
Gold is now approaching a well-defined supply band, roughly around the 5,250–5,300 region.
This zone is important for three reasons:
It was a prior distribution area before the breakdown
It aligns with VWAP / value rejection from the last impulse down
It represents the level where trapped longs may look to exit breakeven
In other words, this is where selling interest naturally returns, not where new longs should feel comfortable.
If Gold were truly in a strong continuation phase, it would have:
Built a base
Absorbed supply
Then expanded higher
Instead, price is walking straight back into overhead resistance.
Liquidity behavior doesn’t confirm strength
Despite the bounce, liquidity behavior remains defensive.
• Rallies are corrective, not impulsive
• Volume expands on down moves, not up moves
• Buyers are reactive, sellers are proactive
This is typical of a market inside a larger corrective phase, not the start of a fresh leg higher.
Gold often rallies hardest after fear peaks — but it doesn’t trend sustainably until supply is fully absorbed. That process takes time.
Macro tailwinds aren’t immediate triggers
Yes, long-term macro drivers for gold remain intact.
But markets don’t move on narratives alone — they move on timing and positioning.
If global liquidity remains tight or even mildly restrictive, gold doesn’t collapse — but it also doesn’t trend freely. It oscillates, frustrates, and cleans up positioning.
That’s exactly what current structure suggests.
The probable path from here
From a trader’s perspective, the higher-probability sequence is:
• Price tests the 5,250–5,300 supply zone
• Sellers re-engage into strength
• Volatility compresses or rejection appears
• Market either ranges or pulls back before the next real move
A clean break and acceptance above this zone would invalidate the view — but until then, this is resistance, not confirmation.
Bottom line
Gold’s bounce is real — but bounces are not trends.
This move looks like:
A reaction, not initiation
Short-covering, not accumulation
Repair work, not breakout
Strong markets build value below resistance.
Weak or corrective markets rush into it.
Right now, Gold is doing the latter.

XAUUSD – H2 Technical AnalysisXAUUSD – H2 Technical Outlook: Bullish Structure Rebuild as Precious Metals Surge | Lana ✨
Precious metals are back in focus as silver surges sharply, adding momentum to the broader metals complex. In this context, gold is showing signs of structure rebuilding after a healthy correction, setting the stage for potential continuation.
📈 Market Structure & Technical Context
After a strong impulsive drop, gold successfully defended the 4,420–4,450 strong support zone, where buyers stepped in decisively. Since then, price has been forming higher lows along an ascending trendline, signalling a shift from distribution into recovery.
The current price action suggests this move is corrective-to-bullish, not just a short-lived bounce.
🔍 Key Levels to Watch
Strong Support: 4,420 – 4,450
This zone remains the structural base. As long as price holds above it, bullish scenarios stay valid.
Mid Resistance / Reaction Zone: ~5,050 – 5,080
Price is currently consolidating here, absorbing supply after the rebound.
Next Resistance: ~5,135
A clean break and acceptance above this level would confirm continuation strength.
Upper Targets: ~5,300 – 5,350
Aligned with Fibonacci extensions and prior supply zones.
Higher Objective: ~5,580
Only in play if bullish momentum accelerates across the metals market.
🎯 Bullish Scenarios
If gold continues to respect the upper trendline and holds above the 5,000 psychological level:
A brief pullback into 5,000–5,050 could offer structure for continuation.
Acceptance above 5,135 opens the path toward 5,300+.
Strong momentum, supported by silver’s breakout, could extend moves toward 5,580.
Any pullbacks toward support are currently viewed as constructive corrections, not weakness.
🌍 Intermarket Insight
Silver’s sharp rally highlights renewed demand across precious metals, often acting as a leading signal for broader sector strength. This backdrop supports the idea that gold’s recent correction was a reset, not a reversal.
🧠 Lana’s View
Gold is rebuilding its bullish structure step by step. The focus is not on chasing price, but on how price reacts at key levels. As long as structure and momentum remain aligned, the broader trend stays constructive.
✨ Stay patient, respect the zones, and let the market confirm the next expansion.

XAUUSD (H3) – Liam PlanXAUUSD (H3) – Liam Plan
Safe-haven bid is back, but structure is still corrective | Trade the zones, not the headlines
Quick summary
Gold is up for a second day as US–Iran tensions revive safe-haven demand. At the same time, expectations for Fed rate cuts keep the USD on the defensive, which typically supports non-yielding assets like gold. However, with ADP and ISM Services PMI ahead, short-term volatility can spike fast — and that’s exactly where gold tends to run liquidity before choosing direction.
My approach: respect the macro tailwind, but execute based on structure.
Macro context
Gold usually benefits when:
geopolitical risk rises (risk-off flows),
rate-cut expectations increase (lower real yields),
the USD weakens or struggles to sustain a bounce.
That said, pre-data sessions often produce fake moves. The market will likely “test” both sides before committing.
Technical view (H3 – based on the chart)
Price rebounded sharply from the recent low, but the overall swing structure is still in a correction / rebalancing phase after a major impulse down.
Key zones on the chart:
Major supply / premium target: 5570 – 5580 This is the clear “sell reaction” zone if price expands higher.
Current decision area: around 5050 – 5100 Price is pushing back into a key mid-range level — where continuation must prove acceptance.
Deep demand / liquidity base: 4408, then 4329 If the market fails to hold higher supports, these are the next magnets for sell-side liquidity.
This is a classic: bounce → retest → decide environment.
Trading scenarios (Liam style: trade the level) Scenario A: Continuation bounce
If price holds above the current base and continues to reclaim levels:
Upside rotation can extend toward 5200 → 5400 → 5570–5580
Expect reactions near each resistance band, especially approaching premium.
Logic: safe-haven flows + softer USD can fuel continuation, but only if price accepts above the mid-range.
Scenario B: Rejection and rotation lower
If price fails to hold above 5050–5100 and prints rejection:
Expect a pullback back into prior demand
Deeper continuation opens toward 4408, then 4329
Logic: corrective rallies often redistribute before the next leg lower, especially around major data.
Execution notes
With ADP + ISM ahead, avoid chasing candles.
Wait for price to tag the zone and show a clear reaction.
Trade smaller if spreads widen.
My focus: If price accepts above the mid-range, I’ll respect the bounce. If it rejects, I’ll treat the move as a corrective rally and look for rotation lower. Either way, I’m trading levels — not headlines.
— Liam

Wave B Has Rebounded 15% Bottom Confirmed at 4,400?Wave B Has Rebounded 15% – Final Bottom or a Trap Before Wave C?
After a strong rally in yesterday’s Asian session, gold moved into consolidation during the European and US sessions, with a failed breakout late in the US session. In today’s Asian session, price broke above the 4,882–4,960 range, confirming it as a new buy-side base.
Gold has rebounded ~15% from the 4,404 area, driven by dip-buying demand and rising US–Iran geopolitical tensions, which remain a key catalyst alongside this week’s economic data.
From an Elliott Wave perspective, 4,400 marks the Wave A bottom. The market is now in a Wave B corrective rebound, with potential upside toward 5,140 – 5,200 – 5,220. Once Wave B completes, Wave C may follow, where signs of weakness and distribution will be watched to identify new swing-buy zones after the correction.
Support: 4,990–4,950 | 4,880–4,890 | 4,780–4,750 | 4,650–4,624
Resistance: 5,140 | 5,200 | 5,220
Note: Volatility remains elevated. Trade cautiously with strict risk and capital management.

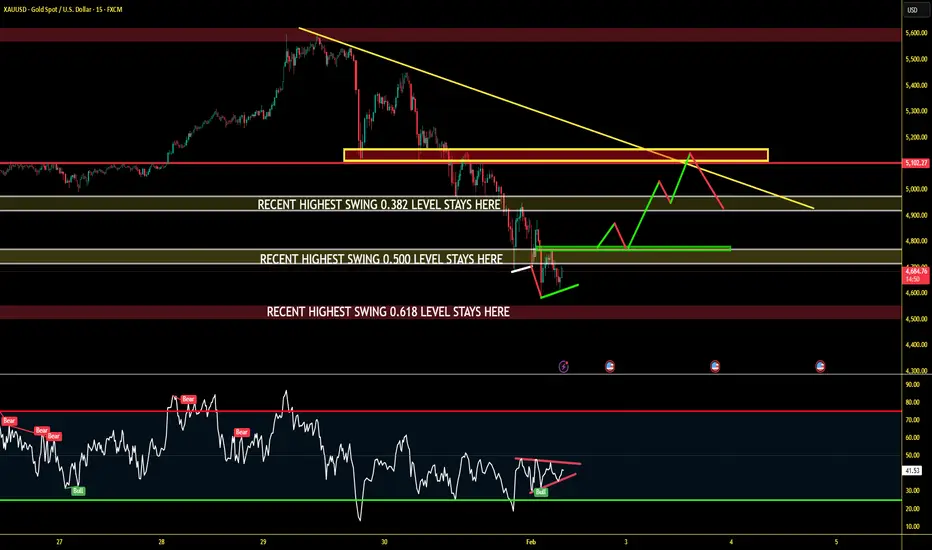
IM LONG IN XAUUSD: HTF 0.5 Fibonacci Magnet in Play (4950–5000)*Gold is holding trendline support and targeting the 0.5 Fibonacci level of the higher timeframe.
What I Have Mentioned is the Clear HTF bias, defined by zone, defined reaction zone, which shows both bullish & corrective scenarios
****Strongly it educates, not hypes***
XAUUSD Price ( 4950 – 5000 ) remains the key upside zone if support continues to hold.
Market Context:
XAUUSD is currently trading around 4810, holding above a rising yellow trendline support.
Technical Confluence:
• Higher timeframe 0.5 Fibonacci retracement lies between 4950 – 5000
• This zone is marked as a major reaction area (highlighted rectangle)
• Trendline support + structure holding adds bullish probability
Price Expectation:
As long as the price respects the trendline support, gold can continue its move higher towards the 0.5 HTF Fibonacci zone.
The green and red projected paths indicate possible market reactions based on support and resistance behavior — not prediction, but preparation.
Trading Insight:
This is a buy-on-support, sell-into-resistance setup.
Strength near 4950–5000 must be watched closely for either continuation or rejection.
Let price confirm at HTF levels — patience pays more than prediction.

(XAUUSD) – Bearish Continuation From Major Supply Zone (45m)
Market Structure
Clear trend reversal from the highs → strong impulsive sell-off.
The curved marking shows a distribution/top formation, followed by aggressive downside momentum.
Overall structure is lower highs & lower lows → bears in control.
Key Zones
Resistance / Supply Zone (~4,700–4,750)
Previous support flipped into resistance.
Price has retested this zone multiple times and failed to break above → strong seller presence.
Target / Demand Zone (~4,350)
Prior demand area and liquidity pool.
Logical downside objective if resistance continues to hold.
Entry Logic (as drawn)
Short entry after rejection inside the resistance zone.
Confirmation comes from:
Weak bullish candles
Long upper wicks
Failure to reclaim the zone
Price Action Read
The small bounces are corrective pullbacks, not reversals.
Each push up is being sold → classic bearish continuation / pullback-to-supply setup.
Bias & Expectation
Bias: Bearish
Expectation:
Rejection from resistance → continuation toward 4,350 target
Invalidation if price accepts and closes above the resistance zone
Summary
This chart shows a textbook support-to-resistance flip after a strong sell-off. As long as price remains below the highlighted resistance, the path of least resistance is down, targeting the lower demand zone.

Gold bounced from 100 MAGold bounced back from it's 100 MA. Recovery could be seen faster than Silver.

XAUUSD 15M – Bullish Reversal Setup Explained Above 4700 Level After a strong sell-off, Gold is now reacting near a high-probability demand zone.
🔍 My Analysis & Thinking:
• Price has reached the 61.8% Fibonacci retracement of the recent major swing
• RSI (15 Min) is showing a clear bullish divergence
• Selling momentum is weakening after the big fall
• Structure suggests a potential higher low formation
📈 Trade Plan (IF–THEN Logic):
✅ IF price breaks above 4700 (yellow resistance zone)
✅ AND gives a clean retest + bullish confirmation
➡️ THEN BUY
🎯 Upside Targets:
4800 , 4900, 5000 zone (major supply & trendline confluence)
🛑 Invalidation:
Breakdown below 61.8% (4500 -4550 level ) support with strong momentum
⚠️ This is a patience trade — confirmation > prediction.
📊 KEY LEVELS TO MENTION IN CAPTION
Support Zone:
🔹 61.8% Fib – Major demand area
Breakout Level:
🟡 4700 (Yellow Rectangle)
Targets:
🎯 4800 → 4900 → 5000
Bias:
🔄 Short-term bullish after confirmation
XAUUSD 15M – Bullish Reversal Setup Explained Above 4700 Level
XAUUSD "BULLISH" BIAS IDEA.Symbol + Timeframes: XAUUSD — HTF (Daily) & ITF (H4)**
Bias: Bullish (as long as price holds above key support zone)
Structure: – Higher lows intact on HTF
– Intermediate pullbacks LIQUIDATING "fomoing" retailers.
Key Levels: – Support: – 4629.989
And if it breaks , the confluential block at - 4633.96 and marked important swing low at - 4267.383.
– Invalidation: daily candle close below 4267.383
Context: – Price reacting to confluence (fair value gap + structural support + confluential block)
– Dollar bearish pullback adds supporting context
Plan: – Look for corrective pullback to support for continuation setups at smaller timeframe to frame trades, I've marked the path
– Targets based on structural levels
This is analysis, not trade advice.

EURUSD - 4H - SHORTFOREXCOM:EURUSD
Hello traders , here is the full multi time frame analysis for this pair, let me know in the comment section below if you have any questions, the entry will be taken only if all rules of the strategies will be satisfied. wait for more Smart Money to develop before taking any position . I suggest you keep this pair on your watchlist and see if the rules of your strategy are satisfied...
Keep trading
Hustle hard
Markets can be Unpredictable, research before trading.
Disclaimer: This trade idea is based on Smart money concept and is for informational purposes only. Trading involves risks; seek professional advice before making any financial decisions. Informational only!!!

XAUUSD – Historic Volatility Doji at 1.618 | Exhaustion SignalXAUUSD – HTF Exhaustion at 1.618 | Major Volatility Signal Formed
GOLD HAS PRINTED ITS BIGGEST DOJI IN ENTIRE HISTORY OF DAY CANDLE NEARLY 490$ FROM LOW TO HIGH AND ENDED WITH INDECISION. LETS SEE WHAT HAPPENS NEXT . WAIT FOR LOW AND HIGH OF DOJI.......?
Gold has reacted precisely from the 1.618 Fibonacci extension zone (~5600), where price printed a high at 5597.04 and faced strong rejection.
The current Daily candle is forming an exceptionally large indecision candle (Doji-like structure) after a strong impulsive move.
With an intraday range of nearly 490$, this candle highlights clear exhaustion and aggressive profit-taking at premium prices.
Technical Perspective
Clear rejection from the 1.618 extension resistance
Strong volatility spike following a vertical price expansion
Daily candle structure suggests weakening bullish momentum
Key HTF Levels to Watch
Resistance / Supply: 5580 – 5615
Immediate Reaction Zone: 5350 – 5400
Major Support / Rebalancing Area: 5000 – 4900
HTF Value Area Low: Below 4900 (only if bearish momentum accelerates)
Expectation (Next Sessions / 1–2 Weeks)
As long as price remains below the 1.618 rejection zone, probability favors:
Consolidation or corrective price action
Gradual rotation toward 5000–4900 HTF demand
No immediate V-shaped recovery unless strong acceptance above 5600 is seen

XAUUSD Gold Next Move In Upcoming 2 Weeks ExpectedGold is Now Moving to 5600 to 5615 Which is Retracement level of 1.618 For Golds Previous Swing Extension levels and can expect a retracement of till 5000 to 5100 Levels In Upcoming Weeks Lets See WhatS Going to Happen..........# XAUUSD .. Check My 4hr chart Frame

If You Want to Catch the Bottom, First Wait for RSI.To Do Nothing.
Right now, staying out is already a win.
The market is moving fast, noisy, and uncomfortable. Both buyers and sellers are getting trapped — not because direction is unclear, but because the market has not finished its process yet.
This is a moment to stay calm and observe, not to force a trade.
Observe how price begins to slow down.
Observe how selling pressure fades.
Note:
Stay focused on RSI behavior. When price decelerates and RSI shows clear convergence / stabilization, that’s when it makes sense to start thinking about potential long ideas — not before.
Until then, observation comes first.
Sometimes, doing nothing is the most disciplined decision you can make.

XAUUSD – H2 Technical AnalysisXAUUSD – H2 Technical Outlook: Short-Term Sell Pressure as Liquidity Gets Cleared | Lana ✨
Gold is showing signs of short-term weakness after an aggressive upside expansion. Price action suggests the market may continue to move lower in the near term, not as a trend reversal, but as a liquidity-driven correction within a broader bullish structure.
At this stage, the focus shifts from continuation to how price behaves while liquidity is being taken below structure.
📈 Market Structure & Price Behavior
The recent vertical rally has left the market overextended, making a corrective phase technically healthy.
Price has broken below short-term support and is now trading under a descending corrective trendline, signaling short-term bearish pressure.
This type of structure often develops when the market needs to clean buy-side positions before rebuilding for the next leg.
While the higher-timeframe trend remains bullish, the intraday bias has shifted to corrective / bearish until liquidity objectives are met.
🔍 Key Liquidity Zones on the Chart
Short-term sell zone: the descending trendline near current price As long as price reacts below this trendline, rallies are more likely to be sold.
Scalping buy liquidity: around 5050–5070 This area may generate temporary bounces, but reactions here should be treated as short-term only.
Key bullish order block: 4825 – 4830 A critical zone where stronger buyer participation may appear if the sell-off extends.
Major swing liquidity zone: 4613 – 4625 This is a high-confidence liquidity pocket where the market could complete a deeper correction and reset the broader bullish structure.
🎯 Trading Scenarios
Primary scenario – Continuation of the pullback: As long as price remains below the descending trendline, gold may continue to move lower to sweep liquidity below recent lows. This favors sell-on-rallies rather than buying strength.
Secondary scenario – Temporary reaction: Short-term bounces may occur around the 5050–5070 area, but without structural reclaim, these moves are more likely corrective than trend-changing.
Structural defense scenario: If price reaches the 4825–4830 or 4613–4625 zones, watch closely for signs of stabilization and absorption, which would signal that the liquidity objective has been completed.
🧠 Lana’s View
This move lower is best seen as liquidity cleanup, not panic selling. Lana stays patient during corrective phases, avoiding early longs and waiting for price to reach clear liquidity zones before reassessing bullish continuation.
✨ Let the market take what it needs, then look for structure to rebuild.
