Market Outlook & Trade Setup – Friday, 30th January 2025Major indices showed a sharp recovery yesterday and even crossed the opening day high. Silver and Gold has corrected by more than 6% overnight so some selling pressure could be seen.
We have the Budget on Sunday, 1st Feb, 2026, so heavy positions might not be build in the market today.
🔹 NIFTY
* Previous Close: 25,418
* Expected Range: 25,000 – 25,500
🔹 SENSEX
* Previous Close: 82,566
* Expected Range: 82,500 - 82,600
🌍 Global & Market Sentiment
* DJIA: +55 | S&P: -9
💰 Institutional Activity (Cash Market)
* FII: Net Sellers: - ₹ 394 Cr
* DII: Net Buyers: + ₹ 2639 Cr
🔥 Events this Week: US --- Trump Speech & FED Rate announcement
📌 Sectoral Focus
Metal, Energy
👉 Commodities in Focus: Gold, Silver, Copper, Crude, Natural Gas
💯 Important Quarterly Results: Cupid, GHCL, HUDCO, IEX, ITC,REC, Voltas
📈 Trade smart. Manage risk. Stay disciplined.
GOLD-SILVER

GOLD/SILVER RatioChart is self explanatory. The price of the TVC:GOLD/TVC:SILVER ratio (XAU/XAG) as of January 1, 2026, is approximately 60.71. This indicates that one ounce of gold is worth roughly 60.71 ounces of silver. Over the past year, the ratio has seen a significant change, trading within a 52-week range of 54.19 to 107.27.
Recent trends
* Market Sentiment and Economic Conditions: When economic uncertainty is high, investors typically flock to gold as a safe-haven asset, which widens the ratio (increases the number).
* Industrial Demand for Silver: Silver has significant industrial applications (electronics, solar panels), so its price often correlates with economic growth and industrial demand, which can narrow the ratio.
* Relative Volatility: Silver is generally more volatile than gold ("high-beta" version of gold); in a bull market for precious metals, silver prices tend to rise faster, lowering the ratio, while in a bear market, gold prices tend to hold up better, increasing the ratio.
Key Insights
* Ratio Fluctuation: The gold-silver ratio is highly volatile. Historically, the all-time high was 125:1 in April 2020.
* Recent Volatility: Both gold and silver have experienced significant price movements in 2025, driven by factors such as interest rate expectations, geopolitical tensions, and industrial demand for silver.
* Price Influences: Domestic gold and silver prices in India are influenced by international market trends, currency exchange rates, local demand, taxes, and import duties.
Gold-Silver Ratio and Future Price Predictions
The gold-silver ratio (calculated by dividing the gold price by the silver price) indicates which metal may be undervalued or overvalued compared to the other and helps anticipate potential out performance.
* High Ratio (e.g., above 80:1 or 90:1): Historically suggests that silver is undervalued relative to gold. This often signals a potential buying opportunity for silver, with expectations that silver's price may rise faster than gold's, causing the ratio to decrease (revert to its mean). A high ratio can also indicate economic uncertainty or a flight to gold's safe-haven appeal.
* Low Ratio (e.g., below 50:1 or 60:1): Historically suggests that silver is overvalued relative to gold. This may signal a potential buying opportunity for gold, with expectations that gold may outperform silver, causing the ratio to increase. A low ratio often coincides with periods of economic optimism and stronger industrial demand for silver.
Current Market Insights
As of late December 2025/early January 2026, the gold-silver ratio has recently fluctuated, with reports placing it around 60.53 to 64:1, down from highs earlier in 2025 that exceeded 100:1. The sharp drop in the ratio during 2025 signaled a strong out performance by silver.
* Silver Out performance Expected: Many analysts believe silver is still cheap relative to its long-term historical average ratio (around 40-60:1 or 60-80:1) and could continue to outperform gold.
* Key Drivers: Silver's strong industrial demand (especially in solar panels and electronics), coupled with persistent supply deficits, provides fundamental support for its price to potentially reach higher levels like $85-$100 per ounce in the medium to long term.
* Volatility and Risk: Silver is generally more volatile than gold, which means it has the potential for higher percentage gains but also larger pullbacks. Investors use the ratio as one of several tools to balance their portfolios, rather than relying on it as a sole predictor.
Disclaimer: This is for demonstration and educational purpose only. This is not buying or selling recommendations. I am not SEBI registered. Please consult your financial advisor before taking any trade.

Silver - CorrectionSeveral signals indicate that a correction is possible around the 60k level (slightly below or above). There’s also an interesting setup in gold, but more on that later in the next chart/idea.”

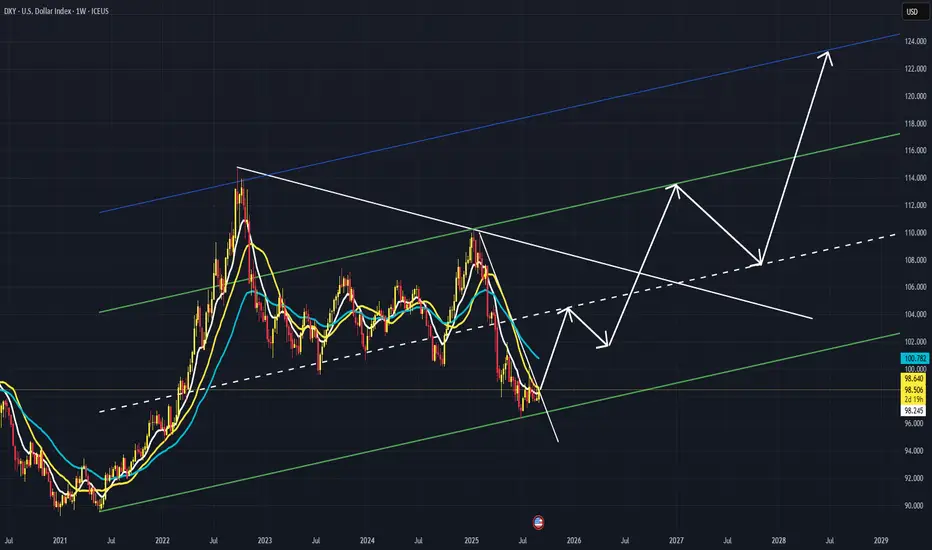
Can DXY make it to 125?Interesting thought as geopolitical forces gather and discuss the fate of USA ... Can DXY make it to 125 in a 5 wave rise in next 3 years or so?
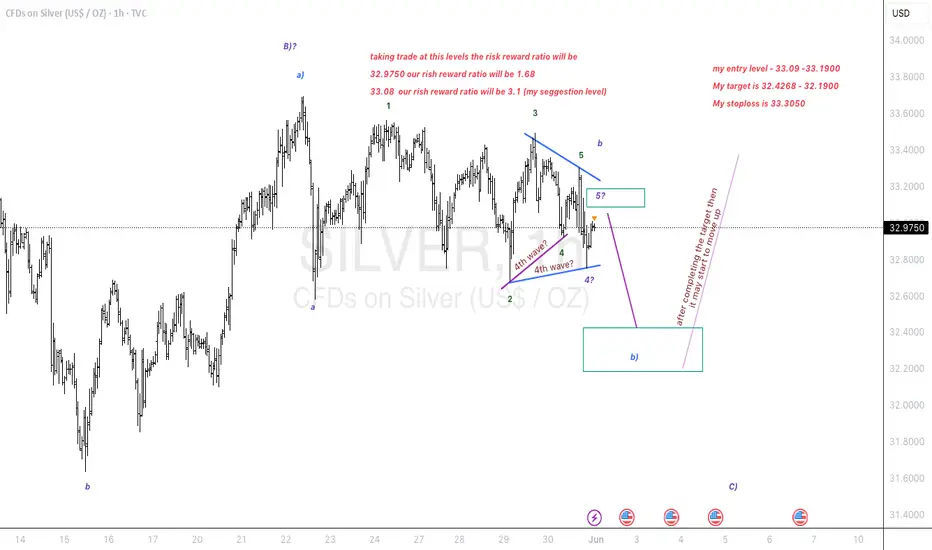
Triangle breakout in silver. Down to earth..
Elliott Wave Analysis:-
1st possibility:- (look Previous chart published)
Silver is in a triangle breakout. if it is getting towards upside breakout then we have a nice opportunity of pullback and and we can add it if the pullback occurs. else we can enjoy this journey quietly.
2nd possibility:-
Silver had already made a pullback towards down side breakout. Once it start the way it will fly towards downside and then it will complete a C wave in whole B wave then upside C wave will be impulsive.
My Entry, Stop, Target all have been discussed.
My suggestion to take a trade at this place to reduce the risk better reward.
I just spoke what chart whisper's in my ear.
I am not a SEBI registered advisor. Before taking a trade do your own analysis or consult a financial advisor. I share chart for education purpose only. I share my trade setup.
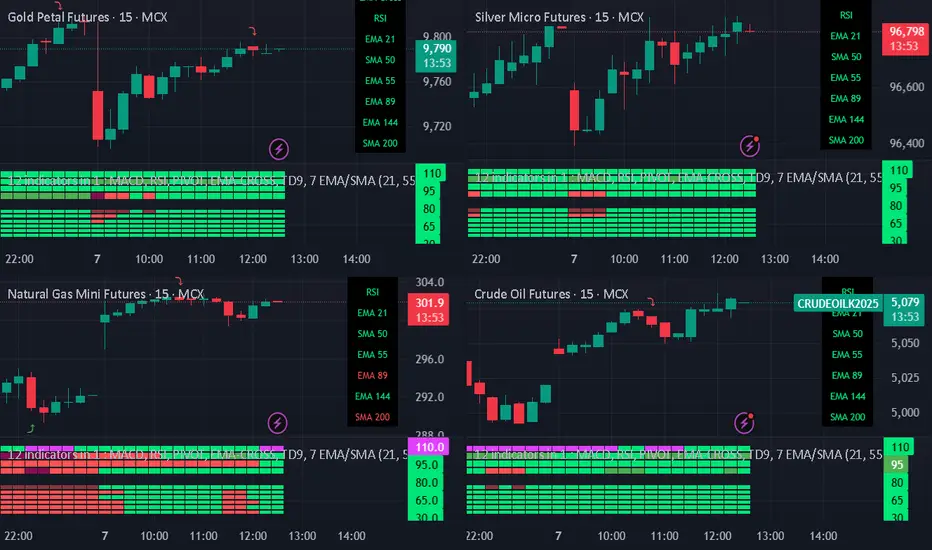
Best Commodity layoutBest Commodity layout
Crafting Your Optimal Commodity Technical Chart Layout in TradingView
The "best" commodity technical chart layout in TradingView is highly personalized, depending on your trading style, strategy, and the specific commodities you're analyzing. However, a well-structured layout should provide a clear, comprehensive view of price action and key technical indicators to aid in decision-making.
Here's a guide to creating an effective commodity technical chart layout in TradingView, incorporating common practices and versatile tools:
1. Choosing Your Main Chart Type:
Candlestick Charts: This is the most popular choice for most traders. Candlesticks provide detailed information about the open, high, low, and close (OHLC) prices for a specific period, making it easier to identify patterns and market sentiment.
Bar Charts: Similar to candlesticks, bar charts also display OHLC data but in a different visual format.
Line Charts: Useful for a quick overview of the overall trend, typically plotting the closing prices.
Heikin Ashi: These charts can help filter out market noise and make trends easier to identify by averaging price data.
Renko or Kagi Charts: These focus solely on price movement, ignoring time, and can be useful for identifying support and resistance levels.
Recommendation: Start with Candlestick charts for their detailed information. You can always switch to other types for different analytical perspectives.
2. Essential Technical Indicators for Commodities:
While the "best" set of indicators is subjective, here are some widely used and effective ones for commodity analysis in TradingView:
Moving Averages (MAs):
Types: Simple Moving Average (SMA) and Exponential Moving Average (EMA) are common. EMAs react faster to recent price changes.
Use: Identify trend direction, support/resistance levels, and potential crossover signals. Common periods include 20, 50, 100, and 200.
Layout: Add 2-3 MAs of different lengths directly onto your main price chart. For example, a 21-period EMA for short-term trends and a 50-period EMA for medium-term trends.
Volume Indicators:
Types: Volume (displays trading activity) and On-Balance Volume (OBV).
Use: Confirm the strength of price movements. A significant price move accompanied by high volume is generally considered more valid.
Layout: Typically displayed in a separate pane below the main price chart.
Oscillators (for identifying overbought/oversold conditions and momentum):
Relative Strength Index (RSI): Measures the speed and change of price movements. Values above 70 often indicate overbought conditions, while below 30 suggest oversold conditions. Standard period is 14.
Moving Average Convergence Divergence (MACD): Shows the relationship between two moving averages of an asset's price. It consists of the MACD line, signal line, and histogram.1 Used for trend identification and momentum.
1.
medium.com
medium.com
Stochastic Oscillator: Compares a particular closing price of an asset to a range of its prices over a certain period. Also used to identify overbought/oversold conditions.
Commodity Channel Index (CCI): Identifies cyclical trends and can signal overbought/oversold levels.
Layout: Oscillators are usually placed in separate panes below the main chart. You might choose 1 or 2 that best suit your strategy (e.g., RSI and MACD).
Volatility Indicators:
Bollinger Bands: Consist of a middle band (typically an SMA) and two outer bands representing standard deviations. They help identify volatility and potential price breakouts or mean reversion.
Keltner Channels: Similar to Bollinger Bands but use Average True Range (ATR) for the outer bands. Can be used for breakout and trend-following strategies.
Average True Range (ATR): Measures market volatility. Useful for setting stop-loss orders.
Layout: Bollinger Bands and Keltner Channels are overlaid on the main price chart. ATR is usually in a separate pane.
Trend-Following Indicators:
Ichimoku Cloud (Ichimoku Kinko Hyo): A comprehensive indicator that defines support/resistance, identifies trend direction, and provides trading signals. It includes several components like the Kumo (Cloud), Tenkan-sen, and Kijun-sen.
Donchian Channels: Plots the highest high and lowest low over a set period. Useful for identifying breakouts and trend direction.
Layout: Ichimoku Cloud and Donchian Channels are overlaid on the main price chart.
Recommendation for a Balanced Layout:
Main Chart: Candlesticks, 2-3 EMAs (e.g., 21, 50, 200), Bollinger Bands or Keltner Channels.
Pane 1 (below main): Volume.
Pane 2 (below main): RSI (14) or MACD.
Pane 3 (optional): CCI or ATR if your strategy heavily relies on them.
3. Drawing Tools:
Effective use of drawing tools is crucial for technical analysis:
Trendlines: Connect swing highs or lows to identify the direction and strength of trends.
Support and Resistance Levels: Horizontal lines drawn at key price levels where the price has historically struggled to break above (resistance) or fall below (support).
Fibonacci Retracement and Extension Levels: Help identify potential support/resistance levels and price targets based on Fibonacci ratios.
Channels: Parallel trendlines that can define a price range.
Chart Patterns: Use tools to identify patterns like head and shoulders, triangles, flags, and pennants.
Layout Tip: Keep your most frequently used drawing tools easily accessible in the TradingView drawing panel.
4. Multi-Timeframe Analysis & Multi-Chart Layouts:
Analyzing commodities across different timeframes can provide a broader market perspective. TradingView allows you to set up multi-chart layouts (the number of charts available depends on your subscription plan).
Common Setup:
Chart 1 (Long-Term): Weekly or Daily chart to identify the major trend.
Chart 2 (Medium-Term): 4-hour or Daily chart for more detailed trend analysis and identifying key levels.
Chart 3 (Short-Term): 1-hour or 15-minute chart for entry and exit signals.
Synchronization: TradingView allows you to synchronize symbols, crosshair, interval, and drawings across multiple charts in a layout, which can be very efficient.
5. Customization and Saving Your Layout:
Appearance: Customize chart colors (background, candles, grids), scales, and lines to your preference for better visual clarity and reduced eye strain. Access these via Chart Settings (the gear icon).
Saving Layouts: Once you have a setup you like, save it as a chart layout in TradingView. You can create multiple layouts for different commodities, strategies, or analytical purposes.
Indicator Templates: Save combinations of indicators as templates for quick application to new charts.
Tips for the "Best" Layout:
Keep it Clean: Avoid cluttering your chart with too many indicators. Focus on a few that you understand well and that complement your strategy.
Consistency: Use consistent settings for your indicators across different charts and timeframes.
Practice: The "best" layout is one that works for you. Experiment with different indicators and setups on a demo account or through backtesting to see what yields the best results for your trading style.
Stay Informed: Be aware that some commodities (e.g., agricultural products) can be influenced by seasonal patterns or specific reports (like USDA reports for crops, EIA for oil). While not a direct part of the "chart layout," integrating this knowledge with your technical analysis is crucial. TradingView has features to display key events like earnings reports or dividends, which can be relevant. Some community scripts on TradingView even offer overlays for planting and harvesting seasons for agricultural commodities.
By following these guidelines and experimenting to find what suits your individual needs, you can create a powerful and effective commodity technical chart layout in TradingView. Remember to regularly review and refine your layout as your trading strategies evolve.
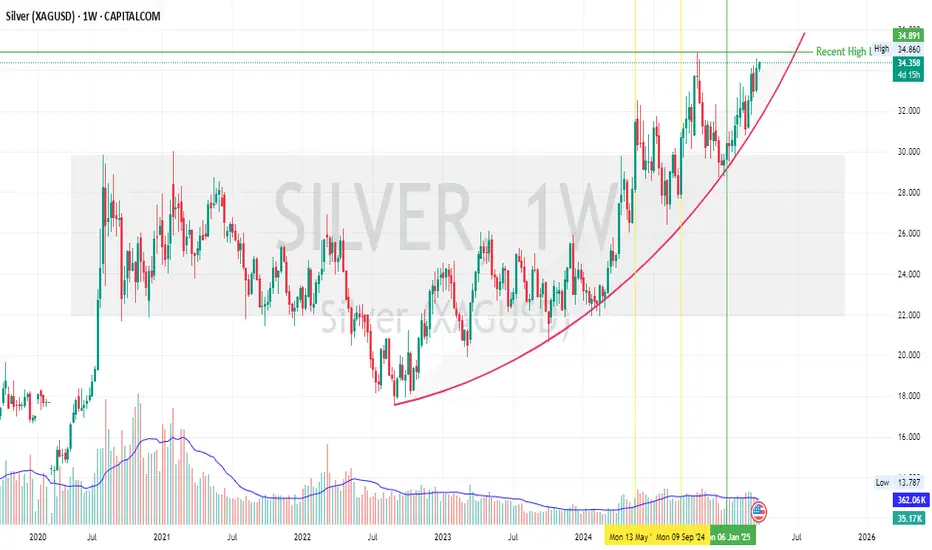
Silver Going Parabolic Silver tried to break out of the horizontal range thrice (marked on chart), but was finally successful only in its third attempt on 6th Jan 2025 and did a retest too.
Post 6th Jan 2025, Silver has been in uptrend keeping up with the Gold in terms of trajectory.
It looks like there is more room upwards as geopolitical events (Tariffs, trade wars etc) shape coming months and uncertainty remains high.
Lets see how it plays out.
Trade Safe
Gold silver update next Our Spot #Gold Range Prediction from 31/03/2025 to 04/04/2025 is as under.
Gold Spot : 3023$-3126$
Gold INR : 88100-91050
Our Spot #Silver Range prediction from 31/03/2025 to 04/04/2025 is as under.
Silver Spot: 33.44$-35.05$
Silver INR: 98400-103200
It must be remembered that price of precious metal depends on so many world wide factors like inflation, Fed interest rate, trade barrier, geopolitical tension, demand, supply, bond yield, dollar index , GDP, payroll data, CPI, currency fluctuation, debt ceiling , expected tax & duty changes, other commodity price crude oil etc. etc. and hence there can not be any accurate barometer of predicting precious metal price.
Gold INR has been calculated taking Gold Spot international price and converting the same assuming fixed Indian rupee rate. However, this is not accurate method as change in rupee value to dollar can substantially impact Gold INR price. Pl. note that price of commodity doesn't depend upon performence of company but depend upon performence of world economy, hence it is extremely risky to trade in commodities. Commodities market also become more volatile during contract expiry.
These are not a recommendation for buy or sell. This view is only for educational purpose. You are requested to consult your financial advisor before entering in to any trade.

Gold silver update Our Spot #Gold Range Prediction from 31/03/2025 to 04/04/2025 is as under.
Gold Spot : 3023$-3126$
Gold INR : 88100-91050
Our Spot #Silver Range prediction from 31/03/2025 to 04/04/2025 is as under.
Silver Spot: 33.44$-35.05$
Silver INR: 98400-103200
It must be remembered that price of precious metal depends on so many world wide factors like inflation, Fed interest rate, trade barrier, geopolitical tension, demand, supply, bond yield, dollar index , GDP, payroll data, CPI, currency fluctuation, debt ceiling , expected tax & duty changes, other commodity price crude oil etc. etc. and hence there can not be any accurate barometer of predicting precious metal price.
Gold INR has been calculated taking Gold Spot international price and converting the same assuming fixed Indian rupee rate. However, this is not accurate method as change in rupee value to dollar can substantially impact Gold INR price. Pl. note that price of commodity doesn't depend upon performence of company but depend upon performence of world economy, hence it is extremely risky to trade in commodities. Commodities market also become more volatile during contract expiry.
These are not a recommendation for buy or sell. This view is only for educational purpose. You are requested to consult your financial advisor before entering in to any trade.

Good silver next wives Our Spot #Gold Range Prediction from 31/03/2025 to 04/04/2025 is as under.
Gold Spot : 3023$-3126$
Gold INR : 88100-91050
Our Spot #Silver Range prediction from 31/03/2025 to 04/04/2025 is as under.
Silver Spot: 33.44$-35.05$
Silver INR: 98400-103200
It must be remembered that price of precious metal depends on so many world wide factors like inflation, Fed interest rate, trade barrier, geopolitical tension, demand, supply, bond yield, dollar index , GDP, payroll data, CPI, currency fluctuation, debt ceiling , expected tax & duty changes, other commodity price crude oil etc. etc. and hence there can not be any accurate barometer of predicting precious metal price.
Gold INR has been calculated taking Gold Spot international price and converting the same assuming fixed Indian rupee rate. However, this is not accurate method as change in rupee value to dollar can substantially impact Gold INR price. Pl. note that price of commodity doesn't depend upon performence of company but depend upon performence of world economy, hence it is extremely risky to trade in commodities. Commodities market also become more volatile during contract expiry.
These are not a recommendation for buy or sell. This view is only for educational purpose. You are requested to consult your financial advisor before entering in to any trade.

GOLD UPDATE Our Spot #Gold Range Prediction from 06/03/2025 to 07/03/2025 is as under.
Gold Spot :2890$-2930$
Gold INR : 85000-86450
Our Spot #Silver Range prediction from 06/03/2025 to 07/03/2025 is as under.
Silver Spot: 31.88$-32.44$
Silver INR: 93500-98100
It must be remembered that price of precious metal depends on so many world wide factors like inflation, Fed interest rate, trade barrier, geopolitical tension, demand, supply, bond yield, dollar index , GDP, payroll data, CPI, currency fluctuation, debt ceiling , expected tax & duty changes, other commodity price crude oil etc. etc. and hence there can not be any accurate barometer of predicting precious metal price.
Gold INR has been calculated taking Gold Spot international price and converting the same assuming fixed Indian rupee rate. However, this is not accurate method as change in rupee value to dollar can substantially impact Gold INR price. Pl. note that price of commodity doesn't depend upon performence of company but depend upon performence of world economy, hence it is extremely risky to trade in commodities. Commodities market also become more volatile during contract expiry.
These are not a recommendation for buy or sell. This view is only for educational purpose. You are requested to consult your financial advisor before entering in to any trade.

GOLD UPDATE THIS WEEKEND Our Spot #Gold Range Prediction from 17/02/2025 to 21/02/2025 is as under.
Gold Spot :2822$-2910$-2936$
Gold INR : 82900-85550-86300
Our Spot #Silver Range prediction from 17/02/2025 to 21/02/2025 is as under.
Silver Spot: 31.03$-32.58$-33.42$
Silver INR: 92250-96850-99350
It must be remembered that price of precious metal depends on so many world wide factors like inflation, Fed interest rate, trade barrier, geopolitical tension, demand, supply, bond yield, dollar index , GDP, payroll data, CPI, currency fluctuation, debt ceiling , expected tax & duty changes, other commodity price crude oil etc. etc. and hence there can not be any accurate barometer of predicting precious metal price.
Gold INR has been calculated taking Gold Spot international price and converting the same assuming fixed Indian rupee rate. However, this is not accurate method as change in rupee value to dollar can substantially impact Gold INR price. Pl. note that price of commodity doesn't depend upon performence of company but depend upon performence of world economy, hence it is extremely risky to trade in commodities. Commodities market also become more volatile during contract expiry.
These are not a recommendation for buy or sell. This view is only for educational purpose. You are requested to consult your financial advisor before entering in to any trade.

Gold silver Outlook next week Our Spot #Gold Range Prediction from 13/01/2025 to 18/01/2025 is as under.
Gold Spot :2605$-2710$
Gold INR : 76200-78800
Our Spot #Silver Range prediction from 13/01/2025 to 18/01/2025 is as under.
Silver Spot: 28.30$-30.80$
Silver INR: 86450-92900
It must be remembered that price of precious metal depends on so many world wide factors like inflation, Fed interest rate, trade barrier, geopolitical tension, demand, supply, bond yield, dollar index , GDP, payroll data, CPI, currency fluctuation, debt ceiling , expected tax & duty changes, other commodity price crude oil etc. etc. and hence there can not be any accurate barometer of predicting precious metal price.
Gold INR has been calculated taking Gold Spot international price and converting the same assuming fixed Indian rupee rate. However, this is not accurate method as change in rupee value to dollar can substantially impact Gold INR price. Pl. note that price of commodity doesn't depend upon performence of company but depend upon performence of world economy, hence it is extremely risky to trade in commodities. Commodities market also become more volatile during contract expiry.
These are not a recommendation for buy or sell. This view is only for educational purpose. You are requested to consult your financial advisor before entering in to any trade.

Stay Ahead: Essential Tips to Avoid Trading PitfallsHello TradingView Community!
I'm excited to share some valuable insights on trading pitfalls and how to navigate them effectively. Trading in financial markets can be a challenging journey, but understanding common pitfalls and methods to avoid them can significantly enhance your success. Here are 10 pitfalls traders often encounter and actionable strategies to help you steer clear of them:
Having No Trading Plan:
Entering trades without a plan can lead to impulsive decisions. Develop a clear trading plan outlining your goals, strategies, entry and exit points, and risk management.
Using Strategies That Don't Match Your Personality:
Align your trading strategies with your personality, risk tolerance, and lifestyle. A good match helps you stay consistent and focused.
Having Unrealistic Expectations:
Set realistic goals based on your initial capital and risk tolerance. Trading is not a quick path to wealth, so be patient and persistent.
Taking Too Much Risk:
Avoid over-leveraging and using excessive position sizes. Implement risk management techniques like stop-loss orders and diversification.
Not Having Rules to Follow:
Create a set of trading rules to guide your decisions. These rules provide structure and help you stay disciplined.
Not Being Flexible to Market Conditions:
Adaptability is key in trading. Monitor the markets and adjust your strategies as conditions change.
Failing to Take Responsibility for Your Results:
Own your successes and mistakes. This mindset empowers you to learn, grow, and improve your trading.
Being Addicted to Volatility:
While volatility can be exciting, avoid chasing it for thrills. Focus on making well-reasoned decisions based on your plan.
Not Having a Process to Keep Track of Your Performance:
Maintain detailed records of your trades and their outcomes. Analyze this data to identify patterns and refine your strategies.
Not Dealing with Your Emotional Risk:
Emotions can cloud your judgment in trading. Practice emotional intelligence and techniques like meditation or journaling to stay composed.
Neglecting Proper Research and Due Diligence:
Relying solely on tips or rumors can lead to poor decisions. Conduct thorough research and due diligence on potential trades and investments.
Overcomplicating Your Trading Strategy:
Complex strategies may not always lead to better results. Simplify your approach to focus on proven methods and avoid overanalyzing the market.
Ignoring the Importance of Continuous Learning:
The markets evolve, and so should your knowledge and strategies. Stay updated on market trends and continuously educate yourself to stay ahead.
There is no trade without a stop-loss:
This point emphasizes the importance of having a stop-loss in place before entering any trade. It highlights risk management as a fundamental part of trading, ensuring that you have a clear exit strategy to limit potential losses.
If you have to re-analyze charts after being in a trade, you might be going in the wrong direction:
This point underscores the importance of trusting your initial analysis and trading plan. It warns against second-guessing or changing your plan mid-trade, which could indicate you may be heading in the wrong direction.
By implementing these strategies, you can enhance your trading experience and improve your performance over time. Remember, successful trading is a journey that requires discipline, patience, and continuous learning.
I hope you find these insights helpful. Feel free to share your thoughts and experiences in the comments. Let's continue to support each other and grow as a community!
Happy trading!
RK💕
I am not Sebi registered analyst.
My studies are for educational purpose only.
Please Consult your financial advisor before trading or investing.
I am not responsible for any kinds of your profits and your losses.
Most investors treat trading as a hobby because they have a full-time job doing something else.
However, If you treat trading like a business, it will pay you like a business.
If you treat like a hobby, hobbies don't pay, they cost you...!
Disclaimer and Risk Warning.
The analysis and discussion provided on in.tradingview.com/u/RK_Charts/ is intended for educational purposes only and should not be relied upon for trading decisions. RK_Charts is not an investment adviser and the information provided here should not be taken as professional investment advice. Before buying or selling any investments, securities, or precious metals, it is recommended that you conduct your own due diligence. RK_Charts does not share in your profits and will not take responsibility for any losses you may incur. So Please Consult your financial advisor before trading or investing.

GDX- Cup & Handle BREAKOUT BUY!Attached: GDX Daily Chart as of 7th April 2023
Price has given a Classic Cup & Handle Breakout Buy Signal on the Charts
What do Technical Indicators say on the Daily Chart?
- RSI is in overbought zone ( > 70) and confirming a Bullish Regime✅
- MACD is trending up and in buy mode, confirming Momentum✅
- DMI is in buy mode and ADX is above 25, confirming a Strong Up Trend✅
Going by Pure Price Action too and especially if you go on the Weekly Chart, you can see last Week put in a Clear Bull Power Candle which is our Breakout Candle
The Green Trend Line serves as the Neckline for the Cup & Handle Pattern
Trade Plan as follows:
Current Market Price= 34.43
Upside Target🎯= 40 to 42 zone
Stop Loss⚠️ can be < 32
This is our Swing/ Positional Trade Call
...............................................
Note:
Not only is GDX Bullish for the IMMEDIATE Short Term (Daily Time Frame as I have put out in this Idea), but it is also Bullish on the Higher Time Frames like the Monthly and the Weekly as well, so there is a Multi Time Frame Alignment too✅
Lastly, Refer to my Related Ideas to see my GDX Analysis on the Monthly Time Frame to get my Long Term View for an INVESTMENT CALL👍

gold 55112 silver 62240 high made in dedcat bouncegold 55112 silver 62240 high made in dedcat bounce gvn here some bounce due to powel speech

Monday market GOLD , SILVER , EURUSD We are seeing good sell with gold as dollar needs retracement of down fall which came on Friday night NFP , If gold breks 1865 beware !

Gold Elliott Wave CountsGold had made triple bottom around 1620 & has made a leading Diagonal in Wave ((1)) of new Impulse so a break down from this leading pattern could result a pullback in Wave ((2)) & in same time DXY should rise in Wave B the larger trend for Gold for this year should remain bullish until we breach 1620 a commodity boom in second half 2023 can push prices to new all time highs.

Right direction is more important than speedHello Friends,
Hope you are doing well,
Today I am sharing a very little and simple fact, which is very much needed to survive long life in market and to be a profitable trader in market,
here we are talking about direction and speed because, when you’re heading towards right direction, every single step you take is real progress, but if you’re going in the wrong direction, every single step is pushing us in minus.
Direction can be decided by analyzing charts and Speed (position sizing) is decided as per money management rules,
One should always digest the initial level first, where he is, and also where he reaches next, one can only survive in market until capital is wiped out, so always remember, to save capital from losses is also gain.
The journey of a thousand miles begins with one single step, make sure that first step is in the right direction.
When making important decisions that have long-term implications like financial decisions, slow down and check carefully risk reward ratios and money management rules and carefully evaluate your available options before starting or executing it.
This post is just for educational purpose,
See you all next week. 🙂
RK 💕
Most investors treat trading as a hobby because they have a full-time job doing something else.
However, If you treat trading like a business, it will pay you like a business.
If you treat like a hobby, hobbies don't pay, they cost you...!
Disclaimer.
I am not sebi registered analyst.
My studies are for educational purpose only.
Please Consult your financial advisor before trading or investing.
I am not responsible for any kinds of your profits and your losses.

DXY BEARISH REVERSALTVC:DXY Finally confirms it's Bearish Reversal
By Breaking down the prolong Uptrend. Now we can expect long term downtrend in DOLLAR to Resume.
It's Highly Bullish for Stocks, Commodities, Precious Metals, Paired Currencies and Cryptocurrencies.

#GOLD $XAUUSD primed to shoot upGOLD and SILVER have been in a downtrend after a surge in Mar of this year which was a reaction to the Ukraine invasion. A lot of "GOLD is a safe haven " traders may have entered in post the invasion and have been stuck for over 6 months as the metal moved down over 21%. Of course the continuous downmove since then may have forced a lot of exits.
We can now see that GOLD is trying to break upwards of the downward sloping trendline. A divergence on the MACD can also be noted.
If GOLD can sustain above the trendline , then we look to catch a sharp upmove reversing the pent-up buying pressure.
Keep stops below recent lows and stay long above the 1650 levels. SILVER should shadow the upmove if this resolves upwards

Natural Gas is taking support of Upward trendline. Natural Gas is taking support of Upward trendline. It may give bounce from here 50-100 points. It can also add more if come 506-516

Gold + Silver + PlatinumPrecious metal has selling pressure and may continue to move bearish until mean price is not met.
This is going to be interested in comparison to equity.
