XAUUSD – Brian | After the rate cutXAUUSD – Brian | After the rate cut, Volume Profile still favours further downside
1. Market snapshot
After the rate cut, gold saw a bounce but failed to sustain the upside and is still hovering below last week’s highs.
In the Asian session, price only ticked up slightly before being sold off again – a sign that buying pressure is not particularly strong at these levels.
Risk-on sentiment has returned and the USD is seeing a modest recovery, which is weighing on XAU/USD.
That said, expectations for the Fed to maintain a dovish tone could still cap USD strength in the medium term.
Overall, in the short term Brian still leans towards a downside move, preferring to sell into liquidity above rather than chase buys.
2. Volume Profile view – Key levels to watch
On the H1 chart, Volume Profile highlights three main areas:
VAL – Buy scalping zone: around 4,207
→ Current lower value area, where a short technical bounce may appear.
Liquidity / Sell zone: around 4,222
→ Liquidity pocket above, lining up with VAH and a volume cluster – an attractive area to look for sells if price is pushed back up for a retest.
Deeper buy zone: around 4,166
→ Broader demand area below; if price flushes lower after sweeping liquidity, this is where dip-buying interest may show up.
3. Trade scenarios (for reference)
Scenario 1 – Sell at the 4,222 liquidity zone (primary idea)
Idea: Wait for price to retrace into the 4,222 liquidity zone and then look for rejection signals on H1/M15.
Sell zone: 4,220–4,223
Suggested SL: Above 4,230
Targets:
TP1: 4,207 (VAL)
TP2: 4,190–4,185
TP3: 4,170–4,166 (deeper buy zone)
This setup follows the current bearish bias, using the logic of “sell the rally into high-volume + liquidity zones”.
Scenario 2 – Light buys at VAL 4,207 & buy zone 4,166
Scalp buy at VAL:
Entry zone: 4,204–4,207
Target: bounce back towards 4,217–4,220 and then exit, not a long hold.
Buy at the deeper 4,166 zone (cleaner level):
Entry zone: 4,164–4,168
SL: Below 4,158
TP: 4,190 → 4,210 if a clear bullish candle reaction forms and the Fed does not turn overly hawkish.
Both buy scenarios are purely short-term corrective plays, so position size should be kept modest as the main bias remains to the downside.
Be patient and only start thinking about sells once price tags the 4,222 area – avoid forcing entries when price is stuck in the middle of the range.
In summary: Selling around 4,222 is the primary plan, while buys at 4,207 and 4,166 are secondary strategies that only come into play if there is a clear reaction from Volume Profile and price action.
Gold-trading

XAUUSD – Brian | Volume Profile before FedXAUUSD – Brian | Volume Profile before Fed: watch for a rebound to sell down
Market snapshot
Ahead of the Fed's interest rate announcement, gold is moving sideways within a fairly wide range, not yet choosing a clear direction.
In the H1 timeframe, the price fluctuates around the value area, making it very suitable for short-term trading according to the Volume Profile instead of trying to predict the meeting outcome.
Volume Profile – Key price areas
Nearest VAL: around 4.197 – the bottom of the current value area, where there was previous buying support.
Above, the FVG area + VAH/POC cluster is around 4.210 – this is an "air pocket" area where selling pressure can easily appear when the price fills the liquidity gap.
Below, the target for a downward wave if the Fed is not too dovish is around 4.13x (area 4.130–4.135) – coinciding with the old buy zone on the chart.
Trading scenario according to Volume Profile
Watch for a light Buy reaction at VAL 4.197
If the price slides to 4.197 and a nice rejection candle appears on H1/M15, a short scalp buy can be considered:
Idea: capture the rebound from VAL back to the middle/top of the value area, do not hold the position long.
Sell when the price fills FVG around 4.210 (priority scenario)
After the rebound from VAL, the FVG area 4.210 will be where Brian prioritizes watching for a Sell:
Reference sell entry: around 4.208–4.212
TP1: 4.185–4.180
TP2: 4.165–4.160
TP3: area 4.13x (4.130–4.135) if a strong sell-off occurs after the Fed
SL should be placed neatly above the FVG/VAH area (e.g., 4.218–4.220), avoid setting it too far.
Fed context – Why trade cautiously?
The focus this week is the FOMC meeting:
The market is waiting to see if Chairman Powell can create enough consensus to continue cutting interest rates with very few members opposing, similar to the previous 25 bps cut.
If the Fed maintains a dovish tone → USD weakens, yields cool down, gold is likely to bounce back after the sweep.
If Powell signals a "hawkish rate cut" (concern about inflation, cut less – talk tough) → yields rise, gold may complete a deep decline to the 4.13x area before stabilizing again.

XAUUSD – Brian | Volume Profile & Fed WeekXAUUSD – Brian | Volume Profile & Fed Week: prioritize Sell at VAH, Buy only when reaching discount price area
1. Market snapshot
On H1, gold retested last week's peak and then dropped immediately, indicating that buying pressure at high price levels remains cautious – investors are not ready to "chase the price."
The current structure does not clearly show a long-term trend, but in the short term, there are signs of distribution around high price levels, favorable for selling scenarios according to Volume Profile.
Today, Brian prioritizes watching for a Sell after the price fills the FVG and touches the VAH, while also preparing a Buy scenario at a lower area if the market sweeps liquidity strongly.
2. Volume Profile & price structure
The VAH area around 4,233–4,235 coincides with the FVG area above:
This is where large volumes were previously traded, making it easy for profit-taking/sell-off forces to appear.
Below, the sell-side liquidity levels are spread around 4,200 – 4,175 – 4,140, coinciding with the lows of previous sessions.
The area 4,172–4,175 is a good balance zone for the Buy scenario: below it is a cluster of liquidity and just above a broader Buy zone around 4,140 on the chart.
3. Trading plan for this week
Scenario 1 – Sell according to Volume Profile (priority)
Entry Sell: 4,233–4,235 (VAH + FVG)
SL: 4,241
TP1: 4,215
TP2: 4,200
TP3: 4,175
TP4: 4,140
Idea: wait for the price to fill the FVG and touch the VAH, observe the H1/M15 candle reaction. If there is a clear rejection signal (long upper tail, pin bar, engulfing…), activate the Sell order. This is a short-term play, based on volume & liquidity, not a chase sell when the price is in the middle of the zone.
Scenario 2 – Buy when the price reaches the discount area
Entry Buy: 4,172–4,175
SL: 4,165
TP1: 4,195
TP2: 4,220
TP3: 4,245
TP4: 4,290
Idea: if the price is strongly sold off sweeping through the sell-side liquidity areas, the area 4,172–4,175 can become a good demand zone to catch the rebound, especially when a nice candle reaction appears on H1. This is a "catch the rebound" buy position in the context of this Fed week, requiring disciplined SL.
4. Macro context – Why is the market hesitant?
Last Friday, gold jumped to 4,260 USD and then quickly fell to 4,200 USD, mainly due to the sharp rise in US bond yields as the market awaited the Fed meeting.
Although the market still prices in a high probability of the Fed cutting 25 bps, sentiment is divided by the "hawkish rate cut" scenario:
The Fed cuts but maintains a tough tone on inflation → yields are unlikely to fall deeply, gold is easily sold at high levels.
USD maintains its range, US economic data is relatively stable, causing money flows to "not dare to all-in" on gold before the dot-plot and Powell's speech.
Therefore, this week is the Fed's week: the short-term direction of gold will depend heavily on the policy message, especially the expected reduction path for next year.
Follow to receive the earliest articles from Brian

XAUUSD – Brian | Volume Profile & TrendlineXAUUSD – Brian | Volume Profile & Trendline: prioritize Sell, wait for a “good deal” in the liquidity zone
1. Market snapshot
On H1, gold is touching the trendline just as yesterday's scenario – this is an area where strong price reactions may occur.
The current structure shows that the price is gradually distributing below the trendline, with no clear signal that buyers have regained control.
In the short term, Brian prioritizes the Sell scenario, utilizing the POC – VAH – FVG areas of the Volume Profile to find entry points.
2. Volume Profile – Key price areas to note
Short-term POC/VAH area around 3,488–3,492 (according to his chart):
This is an area where dense trading occurred, the profile “bulges” out, indicating strong market interest.
When the price returns to this area, a reaction is expected – suitable for entering orders in the current priority direction.
Sell-side liquidity below: If gold cannot hold the POC/VAH area and is pushed down, the liquidity area below will become a reasonable target for the next downward move.
Gold is likely to fluctuate sideways on Friday to close the weekly candle below the trendline, then consider a clearer break at the start of next week.
3. Trading scenario for next week
Scenario 1 – Prioritize Sell at the Volume Profile area
Main mindset: When the price returns to the POC/VAH areas above, prioritize finding short signals instead of chasing buys.
Watch for clear candle reactions (long upper tail, pin bar, engulfing…) at the thick profile area.
Target: Gradually close towards lower liquidity areas (sell-side liquidity) below.
Depending on price behavior, the target can be expanded if selling pressure intensifies at the start of the week.
Scenario 2 – Break trendline & buy the retracement
If gold decisively breaks the downtrend line, closes above, and maintains the new structure:
Then, the strategy will shift to buying the retracement at the trendline itself (now acting as support).
The POC/VAL area below will then become a reasonable “buy zone” to follow the new upward trend.
In summary: before a clear break occurs, Brian still prioritizes selling at high liquidity areas, rather than rushing to catch the bottom.
4. Fundamental context – Large capital still supports gold
Central banks are increasing gold purchases:
In October, global central banks net purchased +53 tons of gold, the highest level since 11/2022.
This figure increased by +194% compared to July, marking the third consecutive month of increased purchasing speed.
This indicates: Short-term selling pressure may appear around the trendline/resistance, but long-term capital flow still favors gold.
Any deep declines later may still attract buying power from large institutions.
5. Risk management suggestions
Maintain the mindset: Sell is the current priority scenario, not the only option – if the structure changes, be ready to switch to buy.
Do not overlook the nearest liquidity/swing low area to place SL – avoid dragging SL too far due to emotions.

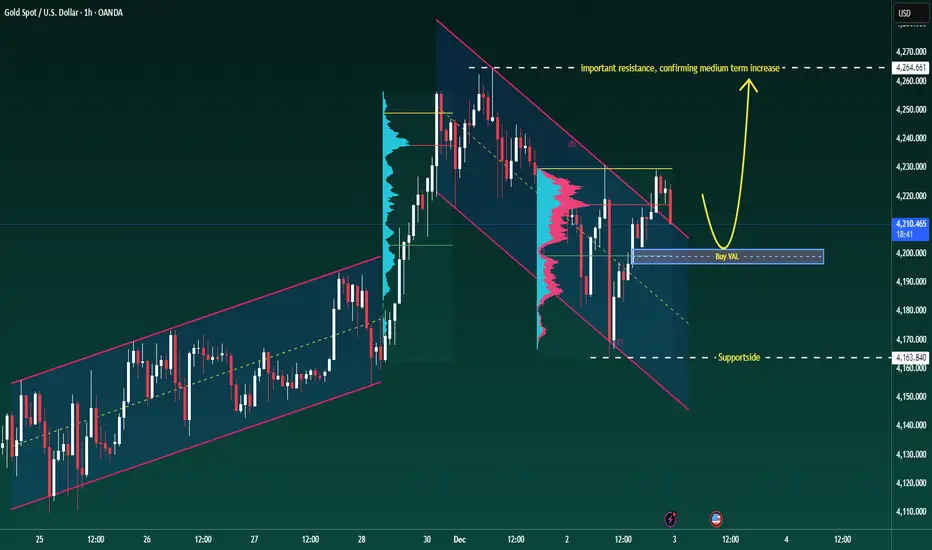
XAUUSD–Volume Profile buy scenario around 4,200, target 4,265+XAUUSD–Volume Profile buy scenario around 4,200, target 4,265+
Brian – Prioritize buying with the trend, use VAL to position entry
Market snapshot
At the end of the US session yesterday, gold had a strong increase and then stabilized, currently moving sideways around 4,216 on H1.
The structure is still an uptrend, the current decline is mainly a technical correction within the value area.
On the chart, the 4,264–4,265 area is marked as important resistance, where if broken, the medium-term uptrend could be unleashed more strongly.
Volume Profile & key price areas
The VAL (Value Area Low) of the Volume Profile is currently around 4,200 – this is an area where the market has previously accepted a large volume of trades, suitable for trend-following buys.
A deeper support area is around 4,164 (Supportsides on the chart), where buyers have previously intervened very clearly.
Above: 4,265 – confirmed resistance, if broken will strengthen the scenario of gold heading to higher price areas, matching the "super cycle 5,000 USD" story in the long term.
Trading plan for next week (according to H1 & Volume Profile)
Priority scenario – Buy at VAL with the trend
Buying area: around 4,200 (VAL of Volume Profile).
Can flexibly range 4,198–4,203 depending on spread and market conditions.
Idea: wait for the price to pull back to the VAL area, observe H1 candle reactions (long lower tail, rejection candles...) before entering the order.
Immediate targets:
TP1: area 4,240–4,245
TP2: 4,265 – important resistance marked as "important resistance, confirming medium term increase".
If the price closes clearly above 4,265 and successfully retests, consider holding part of the position or finding additional entry points, according to the scenario of expanding to higher areas in the new cycle.
Defensive scenario – Deep support
If the 4,200 area does not hold, the 4,164 area will be the next support to watch.
Closing H1/D1 below 4,164 will be a signal to reduce short-term expectations and wait for a new structure instead of trying to "buy every dip".
Fundamental context – Reasons gold is still supported
Gold is heading for its best growth year since 1979, with an increase of over 60% in 2025 – this is the context of a true bull market, not just a recovery wave.
YTD performance of XAU outperforms BTC, showing that large capital flows prioritize stability and gold's safe haven role.
Current supporting factors: US bond yields cooling, USD weakening.
Geopolitical tensions escalating, Russia–US negotiations have not brought clear breakthroughs.
The market prices in nearly a 90% chance of the Fed cutting rates at the next meeting, making non-yielding assets like gold more attractive.
Follow Brian to share the Gold scenario together
XAUUSD – H1 uptrend channel, short-term downside risk increasingXAUUSD – H1 uptrend channel, short-term downside risk increasing Brian – Prioritize short selling at the channel peak, wait to buy back at lower support
I. Strategy Summary Gold is trading in an uptrend channel on H1, but the rise around 4.160 shows signs of weakening, increasing short-term correction risk.
Preferred Scenario: Short sell at the channel peak 4.162–4.164, targeting support areas 4.145 – 4.130 – 4.115 – 4.100.
After the correction, the 4.100–4.080 area may become the foundation for the next rise in the larger trend.
Important price areas to watch: 4.139 – 4.127 – 4.110 – 4.088.
II. Macro Context & News 27/11
02:00 – Fed releases Beige Book This document updates the Fed branches' assessment of the US economic situation.
Describing slower growth, cooling price pressures will further reinforce expectations that the Fed will soon cut interest rates → supporting gold.
Conversely, if the Beige Book describes the economy as still “resilient,” the market may temporarily slow down pricing in rate cuts → causing a short-term adjustment for gold.
19:30 – ECB releases October meeting minutes
If the minutes lean towards the scenario of keeping high interest rates longer, the EUR may be supported, indirectly affecting the USD and gold inflows.
However, the impact is usually not as strong as US data, mainly affecting the overall risk-on/risk-off sentiment.
General Context: Gold has surpassed 4.160 USD/oz as the market increasingly expects the Fed to cut interest rates as early as December, reducing the appeal of interest-bearing assets and increasing the allure of gold – a non-yielding asset. This creates a support foundation for the medium-term uptrend, but after a hot rise, technical adjustments on H1 are normal.
III. Technical Structure – H1 uptrend channel
The price is within the H1 uptrend channel, with rising peaks and troughs, but the upper area near 4.160 coincides with:
The upper boundary of the price channel. The “Sell POC” area on the chart – where liquidity and sell orders are concentrated.
Preferred scenario on the chart: The price may slightly rebound to the POC area 4.162–4.164, then be rejected and slide to the important support area around 4.110 before extending the adjustment down to 4.100–4.080.
The lower trendline of the uptrend channel also acts as a short-term buy area if a clear candle reaction appears.
Notable price areas on H1: Resistance: 4.162–4.164 (channel peak + POC). Intermediate support: 4.139 – 4.127 – 4.110. Deep support: 4.088 – 4.080 – 4.100 (area that may form the bottom for the next rise).
IV. Trading Plan 1. Preferred Scenario – Short sell at the channel peak Idea: Short sell when the price rebounds to the upper boundary of the H1 uptrend channel and POC 4.162–4.164, expecting a correction to support.
Sell: 4.162–4.164 SL: 4.168 TP targets: TP1: 4.145 TP2: 4.130 TP3: 4.115 TP4: 4.100
This is a counter-move order in the uptrend channel, only targeting a short-term correction, not a major trend reversal scenario.
2. Supplementary Scenario – Short buy at support trendline Idea: When the price hits the lower trendline of the H1 uptrend channel and a nice candle reaction appears, consider a short-term buy according to the channel, prioritizing areas:
4.139 – 4.127 – 4.110 – 4.088
Specific Entry/SL levels will depend on the actual price reaction at the trendline, but the general principle:
Buy close to the trendline,
SL placed below the immediate support area,
TP aimed at the middle of the channel or the nearest resistance.
V. Risk Management & Notes
Do not open new positions right before or at the time of the Beige Book and ECB minutes release, as volatility may suddenly increase, widening spreads.
The sell order at 4.162–4.164 is a short-term counter-trend order in the uptrend channel, requiring moderate volume and strict adherence to SL 4.168.
If the price clearly breaks and holds above the 4.170 area, the H1 correction scenario weakens – in that case, stay out, wait for a new structure instead of trying to maintain a sell view.

Brian – Gold Money Flow Map for the US Session TodayBrian – Gold Money Flow Map for the US Session Today
Technical analysis – trendline, FVG, and two clear scenarios
On H4, gold is still maintaining a medium-term uptrend line drawn from the end of October. The decline in the Asian session this morning was not strong enough to break the structure; the price touched the trendline and then bounced up, indicating that the sellers have not yet "crushed" this support area.
Current structure: The price is accumulating around the 4,050–4,080 area in a sideways candle cluster, lying on the uptrend line and above the 4,000 support.
Above, the 4,120–4,170 area is an FVG + important supply zone; higher is a larger FVG around 4,280–4,330 – if "filled," it is a potential area for a strong profit-taking move.
Below, the 4,000 mark is a key support; losing this mark, the price could quickly slide to the 3,884 area – marked on the chart as the level confirming a medium-term downtrend if breached.
Until 4,000 is broken, I consider this an accumulation area with a high possibility of "fake breaks" on both sides – so prioritize trading according to the trendline, not guessing tops and bottoms in the noise area.
Key levels
Resistance / sell zone: 4,100–4,110: buy confirmation zone, if rejected will become short-term supply
4,170–4,173: FVG / supply, medium-term short zone
4,280–4,330: large FVG above
Support: 4,048–4,050: trendline + intraday breakout zone
4,022–4,005: next support if the price slides off 4,040
4,000: psychological and structural support
3,884: final support; breaking down will confirm a medium-term downtrend
Trade scenarios (for reference, not investment advice)
1. Sell break intraday – follow the trend if the trendline breaks
Entry: sell when the price breaks the short trend at 4,048–4,050
SL: 4,056
TP: 4,040 → 4,022 → 4,005
Idea: if the price breaks below the current accumulation cluster and short trendline, I want to follow the initial selling force, targeting the adjacent support area 4,022–4,005. When the order goes right, SL can be moved to BE around 4,040.
2. Sell “premium” – short at the upper FVG zone
Entry: 4,170–4,173
SL: 4,178
TP: 4,160 → 4,145 → 4,122 → 4,100
This is a price zone I consider "beautiful" for medium-term trading if the market gives a deep retracement. FVG + H4 resistance converge; if the price is strongly rejected here, the TPs are successively the lower demand zone and the current range bottom.
3. Buy only after clean breakout – do not rush to catch the bottom
I am only interested in buy orders when the market structure truly confirms:
Trigger: H1/H2 candle closes clearly above 4,100
Entry: buy right around 4,100 after breakout
SL: 4,092
TP: medium-term towards the 4,145 → 4,170 → 4,230+ depending on momentum
This scenario considers 4,100 as the "exit door" from the current accumulation area. If this area holds as new support, buyers will have a clearer advantage and the money flow could push the price up to gradually fill the upper FVGs.

Gold Holds Firm Near $4,180 as Markets Await Fed Signal Gold prices are holding steady around $4,184 per ounce, maintaining strong momentum after last week’s sharp rebound of nearly $250 from the $3,930 low. On the 4-hour chart, the uptrend remains intact with multiple Fair Value Gaps acting as key support zones. The nearest support is seen between $4,150–4,120, while resistance lies at $4,220–4,260.
According to Kitco and Reuters, the rally is largely supported by growing expectations that the Federal Reserve may cut rates in December, amid signs of a cooling U.S. economy. The reopening of the U.S. government after a 35-day shutdown means crucial data such as CPI, NFP, and GDP will soon be released — which could reinforce the market’s belief that a dovish shift is near.
Adding to the intrigue, the U.S. Supreme Court is set to review former President Donald Trump’s authority to dismiss Fed Governor Lisa Cook in early 2026. Analysts warn that if this threatens the Fed’s independence, it could trigger a sharp decline in the U.S. dollar and push gold up by as much as $500 per ounce.
Meanwhile, UBS forecasts global gold demand in 2025 could reach its highest level since 2011, as central banks continue increasing reserves. Heightened geopolitical risks — including the upcoming U.S. election in 2026, the Middle East conflict, and renewed U.S.–China trade tensions — are further strengthening gold’s appeal as a safe haven.
In the near term, gold could correct slightly towards $4,150–4,120 before resuming its advance towards $4,260. A decisive break above that level could open the path to $4,300–4,340. With a weakening dollar, potential rate cuts, and global uncertainty, gold appears well-positioned for the next medium-term bullish cycle.

Gold Holding Above 4100$ Market Prepares for Next Wave ExpansionGold continues to sustain momentum above 4,100$, maintaining its bullish market structure as traders price in expectations of a Fed rate cut in December.
While the US Dollar shows brief recovery, the underlying flow still supports safe-haven demand — especially as global risk sentiment remains fragile and the US government moves closer to reopening.
📊 Technical Overview (H1 – MMFLOW Structure)
Price is currently consolidating within the 4,108$–4,113$ liquidity pocket, where prior breakout demand aligns with short-term Fibonacci retracement (0.382–0.5).
This zone continues to attract buy-side liquidity, suggesting accumulation rather than exhaustion.
As long as 4,085$ remains protected, the bias stays bullish toward 4,172$ – 4,203$ (Fibo 1.272–1.618). However, failure to break above 4,172$ may trigger a short-term reaction sell before the next impulsive leg resumes.
🎯 Trading Plan – MMFLOW Setup
🌸 BUY Scenario (Liquidity Retest)
Buy Zone: 4,086 – 4,084
Stop Loss: 4,080
Targets: 4,090 → 4,095 → 4,100 → 4,110 → 4,120 → 4,130 → 4,150+
🔥 SELL Scenario (Short-Term Reaction Zone)
Sell Zone: 4,172 – 4,174
Stop Loss: 4,180
Targets: 4,165 → 4,160 → 4,150 → 4,140 → 4,130 → 4,120
🧠 MMFLOW TRADING Insight:
“Price is language — liquidity is intent. The market is not random; it’s engineered to test conviction before expansion.”
Bias remains bullish above 4,085$ – any dip into the liquidity base could offer the last accumulation before the next breakout.

LiamTrading – XAUUSD: Structure BreakLiamTrading – XAUUSD: Structure Break, Preparing for a STRONG DOWNTREND?
Hello trader,
The Gold market has undergone a significant Market Structure Shift, breaking the previous sustainable uptrend. After the key support area around 4000 was breached with high volume, the Bears have taken short-term control.
Currently, the price is experiencing a slight correction after a sharp drop, but overall, it is forming Lower High – Lower Low patterns on the H1 chart, confirming the downward movement.
📊 Technical Analysis (Chart 1H – XAUUSD)
The recent sharp decline has broken the upward structure (Break of Structure - BOS) and created significant inefficiencies/imbalances that need to be filled:
Liquidity Zone (Resistance): $4050 – $4060. This is the resistance peak to watch.
Sell Liquidity Zone (FVG Sell Zone): $4030 – $4040. This is the ideal Fair Value Gap for Bears to re-enter.
Key Support/Buy Scalping Zone: $3925 – $3935 (Confluence area of Fibonacci Extension 2.272).
Swing Buy/Accumulation Zone: $3905 – $3915 (Confluence area of Fibonacci Extension 2.618).
🎯 Main Trading Scenario (Short-term BEARISH)
Sell entry 4000 – 4002
SL 4008
TP 3986 – 3965 3950 – 3923
Sell Entry 4028 – 4031 (FVG)
SL 4036
TP 4022 – 4010 4000 – 3960
Buy Scalping
3926 – 3928
SL 3921
TP 3939 – 3955 3970 – 3990
Buy Bottom Zone 3900 – 3908
SL 3895
TP 3922 – 3945 3970 – 3988
Export to Spreadsheet
🧭 Fundamental View & Market Sentiment
The downward momentum is being driven by the following factors:
Monetary Policy: Fed official Williams' remarks supporting continued rate cuts seem to be reducing the safe-haven demand for Gold. Although rate cuts typically support Gold in the long term (due to "cheap money"), a slowing labour market is a short-term negative signal.
CPI News: The Bureau of Labour Statistics recalling staff to compile the CPI report amid a government shutdown highlights the importance of this data. If CPI is not as expected, it could cause significant volatility.
Market Sentiment: After the structure break, technical selling sentiment may dominate, especially if the price cannot quickly recover to the 4000 level.
📌 Conclusion & Recommendations
Gold has confirmed a short-term structure change to a downtrend. While the long-term trend is not yet clearly defined, the current priority is to seek Sell opportunities when the price retraces to key resistance and FVG areas (such as $4000 and $4030).
Advice: Always adhere to SL (Stop Loss) and prioritise risk reduction when the market shows reversal signals. DO NOT BUY when the downtrend structure is prevailing.
👉 Follow me for detailed updates and the latest trading plans during the session!

XAUUSD – Maintaining the Core Uptrend (BUY Bias)
Hello traders,
On the H4 timeframe, gold continues to show a steady upward trend. After testing the upper trendline, price bounced back and is now consolidating around the 386x region. This suggests the market may be in an accumulation phase, awaiting major news.
Fundamental Context
Tomorrow, the market will look towards the release of the Nonfarm Payrolls (NFP) data, an event that often brings strong volatility to gold prices.
In addition, concerns around the potential US Government shutdown are adding to the macro uncertainty, further supporting gold’s safe-haven appeal.
At present, there is little evidence to suggest gold will decline, particularly when other markets are also breaking higher.
Technical Analysis
Price continues to trade within the ascending channel on H4, with buyers holding the advantage.
MACD remains above the zero line, showing no clear signs of weakness.
Price is likely to consolidate further in the 3860 – 3870 range before a sharp move triggered by news.
Trading Plan
Buy Setup (preferred – trend following)
Entry: 3829 – 3832
SL: 3825
TP: 3845 – 3862 – 3877 – 3890
Sell Scalping (counter-trend, higher risk)
Entry: 3927 – 3930
SL: 3934
TP: 3915 – 3900 – 3882 – 3865
Note: Sell setups should be treated only as short-term scalps, as the primary bias remains on the buy side.
Conclusion
Gold is holding firmly within the uptrend structure, with no significant weakness yet. Given the backdrop of political uncertainty and the upcoming NFP release, the priority remains buying at suitable support zones. Any sell trades should be viewed as quick reactions rather than core positions.
👉 Follow me to get the latest updates as soon as price structure changes.

XAUUSD – New Week Scenario on D1 FrameXAUUSD – New Week Scenario on D1 Frame: Prioritise buying, the 3790 – 3720 zone decides the trend
Hello Trader,
Trading is a journey, and the most important destination is conquering oneself.
On the D1 frame, gold has experienced a series of consecutive strong increases, indicating that buyers still maintain the advantage. The buying force shows no clear signs of weakening, even though gold has recently reacted with a slight decrease around 3790. Currently, the price is accumulating around 3760 – the closing candle zone for this week.
Basic Outlook
Political pressure from President Trump on the Fed is increasing, as the market expects an easing move soon. However, Chairman Powell remains cautious, prioritising price stability over inflation issues.
This factor may continue to keep gold in the position of an important safe-haven asset, especially in the context of policy uncertainty.
Technical Outlook
The price zone of 3790 – 3720 will play a decisive role in the medium-term trend for next week.
If 3790 is broken, gold will have the opportunity to advance to the Fibonacci Extension zone of 3822. Further, strong resistance lies around 3840 – 3860.
If 3720 is breached, selling pressure will retest the strategic support zone at 3650. This is also the confluence area with the upward trendline on D1.
MACD Indicator: continues to support buyers, the histogram remains positive, not showing a clear decrease signal.
Volume: no significant selling pressure has appeared, indicating that gold is entering an accumulation phase, waiting for a breakout.
Trading Scenario for Next Week
Buying Scenario (priority):
Buy around 3650 – 3660 (if there is an adjustment).
SL: below 3640.
TP: 3720 – 3790 – 3822.
Selling Scenario at Resistance:
Sell around 3822 – 3830 (Fibo + strong resistance).
SL: above 3840.
TP: 3790 – 3760 – 3720.
Conclusion
In the medium term, the upward trend still prevails. Next week, gold will revolve around the 3790 – 3720 mark, and reactions here will pave the way for the next trend. The priority strategy is to buy at the support zone of 3650, while observing reactions at 3822 to consider short-term selling orders.
Short-term scenarios will be updated during the day, helping you be more proactive with market fluctuations.
Follow me and the community to update the earliest scenarios

LiamTrading – Gold may fake a move before dropping
Gold is trading around the 375x region and might exhibit a "fake breakout" upwards before adjusting downwards. The price structure on the H4 chart shows:
Strong resistance is located at the 3770–3773 region, coinciding with the 0.786 – 1.0 Fibonacci extension area. This is a confluence zone prone to a downward reaction.
The main trendline remains upward, but the RSI is gradually weakening, indicating that the buying force is not as strong.
Short-term support is at 3710–3713, also the 0.5 – 0.618 fibo zone, suitable for buy scalping orders.
A larger support area is at 3688–3691, where it converges with the trendline bottom and important Fibonacci, considered a sustainable "buy zone."
Trading Plan Reference
Sell: 3770 – 3773, SL 3778, TP 3756 – 3743 – 3725 – 3710
Buy scalping: 3710 – 3713, SL 3705, TP 3725 – 3736 – 3748 – 3760
Buy zone: 3688 – 3691, SL 3684, TP 3699 – 3710 – 3725 – 3736 – 3745 – 3760
In summary, gold may create a false upward move to the resistance zone 3770–3773 before reversing to adjust. Traders should patiently wait for confirmation signals at key price zones to enter optimal orders and manage risks tightly.
This is my personal view on XAUUSD. If you find it useful, follow for the fastest updates on upcoming scenarios, continuously updated at comulity

XAUUSD – Wolfe Waves continue on H4XAUUSD – Wolfe Waves continue on H4, price returns below trendline: prioritise correction scenario
Hello Trader,
Based on the Wolfe Waves structure on the H4 frame and current price behaviour, gold has returned to trading below the trendline, indicating a weakening short-term uptrend and paving the way for a downward correction before the market decides the next trend. The upper zone has created a clear “sell zone”; below, two defensive buy zones appear suitable for both scalping and medium-term.
Main Technical Picture
Wolfe Waves: wave 5 completes near resistance, then price falls back below the trendline — aligning with the correction scenario along Wolfe's target line 1–4.
Trendline & price box zone: the close below the rising trendline indicates “acceptance” below; immediate resistance lies at the 375x–376x cluster (sell zone).
Momentum: H4 MACD slows, histogram narrows → high probability of a pullback – retest before a new decision.
Detailed Trading Scenarios
1) Sell according to correction trend (priority)
Entry: 3756 – 3759
SL: 3764
TP: 3745 → 3732 → 3715 → 3690 → 3672
Reason: the 375x zone coincides with the sell zone + upper trendline; selling at retest offers a good R:R ratio.
Confirmation/Negation: if H4 closes above 3764 and holds, the short-term sell scenario weakens.
2) Buy scalping in buffer zone
Entry: 3701 – 3703
SL: 3695
TP: 3715 → 3732 → 3745 → 3766
Note: this is just a rebound in the correction phase; lock each step and move SL according to TP1.
3) Buy medium-term (strong base zone)
Entry: 3648 – 3651
SL: 3644
TP: 3672 → 3698 → 3708 → 3722 – 3727
Reason: the 365x zone coincides with the demand/accumulation volume on H4; suitable for catching a deep rebound along with the larger trend.
Management: this is a medium-term order, so divide volume, lock each step and move SL to breakeven after TP1.
Refer to my scenario if you find it reasonable, trade accordingly, and if you enjoy trading gold with high-quality scenarios, follow me.

XAUUSD – The downward trend continues to be prioritisedThe downward trend continues to be prioritised (Wolfe Waves Pattern H4)
Hello Trader,
Gold is following the Wolfe Waves structure on the H4 chart, after bouncing off the upper resistance zone and returning below the trendline. This indicates that the short-term upward momentum has weakened, and the scenario of a downward adjustment continues to be prioritised at this stage.
Technical Analysis
Wolfe Waves are clearly formed, wave 5 has hit resistance and a reversal signal has appeared.
The price failed to hold above the upper trendline, while the MACD shows weakening upward momentum.
The 3746 – 3748 zone is considered the main “sell zone” in the short term.
Nearby support zones: 3709 – 3711 and deeper at 3675 – 3678. Further, the area around 3650 is an important “buy zone” in the medium term.
Trading Scenario
Sell following the trend (priority)
Entry: 3746 – 3748
SL: 3754
TP: 3733 → 3720 → 3702 → 3690
Buy Short-term Scalping
Entry: 3709 – 3711
SL: 3705
TP: 3722 → 3730 → 3745
Buy Deep Support Scalping
Entry: 3675 – 3678
SL: 3670
TP: 3688 → 3696 → 3710 → 3725
Medium-term Buy Zone
Entry: around 3650
This is a high-volume accumulation zone, coinciding with strong support on H4. This area is suitable for considering medium-term buy orders if the price adjusts deeply.
Conclusion
In the short term, the bearish scenario continues to be prioritised, especially when the price remains below the 3748 zone.
Buy strategies should only be considered in the form of scalping or at the important buy zone around 3650.
The current gold market is still in a distribution phase, so patience is needed to observe candle confirmations at entry zones to optimise the R:R ratio.
This is today's XAUUSD trading scenario according to Wolfe Waves on H4. You can refer to and combine with personal strategies for the best risk management.
Follow me to receive the latest scenarios when the price structure changes.

LiamTrading – XAUUSD IN-DEPTH ANALYSIS OF CURRENT TRENDLiamTrading – XAUUSD Scenario Today: Opportunities at Key Price Levels
Gold continues its strong upward momentum, currently fluctuating around the 376x–377x range after a series of breakthroughs. The technical structure on the H1 chart shows the market is forming clear resistance and support zones, suitable for short-term trading plans.
Technical Analysis
RSI is cooling off from high levels, indicating the possibility of a short-term correction.
The upper price range around 3818–3821 is a strong confluence of resistance, coinciding with wave peaks and Fibonacci extensions, making it prone to selling reactions.
Conversely, the support zones at 373x and 370x exhibit dense liquidity, serving as potential buying points when prices adjust.
The short-term Dow structure still leans towards an uptrend, but attention is needed for the sell confirmation zone if gold fails at the peak.
Reference Trading Plan
Sell Zone: 3818 – 3821, SL 3828, TP 3805 – 3785 – 3760 – 3732 – 3650
Buy Scalping: 3728 – 3731, SL 3723, TP 3750 – 3777 – 3790
Buy Zone: 3706 – 3709, SL 3700, TP 3725 – 3738 – 3750 – 3777 – 3790
In summary, the main trend still leans towards an increase, but with gold approaching strong resistance zones, the likelihood of a correction is very high. Traders need to patiently wait for reactions at the marked zones for optimal entries, while managing risk tightly.
This is my personal view on XAUUSD. If you're interested in gold scenarios, follow me for the fastest updates.

LiamTrading – XAUUSD H1LiamTrading – XAUUSD H1: Adjustment structure formed, awaiting confirmation below 3685
After the surge to 375x, gold is entering a correction phase in line with the structural pattern. On H1, the price clings to the upper edge of the rising wedge, with RSI cooling off from overbought levels, indicating that supply pressure is starting to dominate. Today's plan focuses on the adjustment structure, prioritising selling upon confirmation signals.
Key price zones (as per the attached chart)
Sell strong resistance 3775–3785: confluence of channel top + 2.618 extension. Look for weakening reactions to initiate short/medium-term sell orders.
Buy zone volume 3726–3720: a thin support area providing momentum for a rebound. Holding this zone could push the price to retest 3750–3775; conversely, losing 3720 may lead to a deeper decline.
Resistance + FVG 3715–3698: as the price drops, this area turns into supply; a failed retest here is an early signal for further decline.
Confirm sell 3688–3685: closing H1 below this zone confirms a short-term downtrend, targeting a lower buy zone.
BuyZone 3652–3646: confluence of channel bottom + old liquidity, expecting a strong bullish reaction if revisited.
Reference trading scenarios (adhering to risk management)
Sell reaction at peak: 3778–3783, SL 3792, TP 3755 → 3738 → 3722.
Sell on confirmation: wait for H1 to close below 3685, enter sell 3684–3682, SL 3696, TP 3673 → 3656 → 3648.
Buy scalp by volume: 3726–3720, SL 3715, TP 3738 → 3750 (only short-term if the larger structure remains corrective).
Buy swing at strong zone: 3652–3646, SL 3639, TP 3673 → 3698 → 3712 → 3740.
Operational notes
Prioritise waiting for rejection/closing signals at the mentioned zones; avoid chasing orders in between.
Order volume should be allocated according to confirmation levels (confirmation zone < breakdown < failed retest).
Avoid excessive leverage; adjust SL according to structure when in profit.
This is a personal perspective, not an investment recommendation. If you want the quickest updates on the next XAUUSD scenarios, follow me and join my community for discussions.

XAUUSD – Wolfe Waves forming on H4 chart, clear correction signaHello Trader,
On the H4 chart, gold is forming a quite standard Wolfe Waves pattern. The 5th wave has completed, and the price is moving into the crucial resistance zone of 3760 – 3770, which is also a potential Sell Zone. Given the current structure, the preferred scenario is a short-term downward correction before the main trend resumes.
Technical Analysis
The price has touched the 2.618 Fibonacci Extension and reacted with a decline, indicating profit-taking pressure.
The MACD still shows the previous buying force was quite strong, but the histogram is starting to weaken, aligning with the possibility of a correction wave emerging.
Area 3760 – 3770: a critical resistance zone, also coinciding with the 5th wave line of Wolfe Waves.
Trading Scenario
Sell order according to Wolfe Waves
Entry: 3760 – 3770
SL: 3782 (above resistance zone)
TP: 3710 -3660 -3610 – 3620 (key level Wolfe target)
Sell when price confirms below trendline
Entry 3727-3730
sl 3735
tp 3715-3700-3686-3665
Short-term Buy Scalping
Entry: 3705 – 3708
SL: 3700
TP: 3720-3730 – 3745- 3766
Note: This is just a short-term retracement strategy, going against the correction, so risk management is crucial.
Conclusion
Short-term: Prioritise observing reversal signals at 3760 – 3770 to Sell.
Medium-term: Wait for Buy opportunities around 3564 – 3574 to align with the main trend.
The market is entering a distribution and correction phase, so patiently waiting for candle confirmations at key zones will be key to optimising entry.
This is the Wolfe Waves scenario I propose for gold during this period. You can refer to and adjust according to your own strategy.
Follow me for the fastest updates when the price structure changes.

LiamTrading – XAUUSD Trading Scenario for TodayGold continues its robust upward momentum and is now approaching the critical resistance zone around 3,697 – 3,700. This is a confluence point with the Fibonacci extension level and also a zone where sellers might re-enter strongly.
Technical Analysis
On the H1 chart, the price has tested the resistance zone multiple times but hasn't broken through decisively. This indicates that profit-taking pressure is emerging.
The sell confirmation zone will form if the price breaks below 3,685 – 3,686, at which point the correction target could be around 3,673.
The main Buy Zone is located at 3,650 – 3,645, coinciding with previous support and a strong liquidity area. This is a region where a price increase reaction is likely.
Further down, the 3,628 – 3,630 zone is considered solid support on the larger frame, and if retested, it will be a long-term buying opportunity.
Conversely, if the price decisively surpasses the strong resistance zone of 3,720 – 3,730, the upward trend will be confirmed to continue, opening up higher targets around 3,750+.
Trading Plan Reference
Short-term sell around 3,697 – 3,700, SL 3,707, TP 3,686 – 3,673.
Short-term buy around 3,650 – 3,645, SL 3,640, TP 3,673 – 3,690.
Long-term buy around 3,628 – 3,630, SL 3,620, TP 3,660 – 3,690 – 3,720.
These are my personal views on XAUUSD, and you can use them as a reference to build your own plan. If you find this useful, follow me for the latest updates on new gold trading scenarios.

XAUUSD – Daily Trading Plan
Hello Traders,
Gold opened the Asian session holding its price structure firmly. The 3708 level will be the key pivot today:
If price sustains above this level, the next upside targets are 3750 and possibly 3780.
If price reacts lower at 3708 resistance, then 3650 or even 355x could be the zones to watch for buying opportunities.
Fundamental Context
Last week’s correction was triggered by comments from the Fed Chair on interest rate policy. The Fed does not intend to cut rates too frequently, and this week’s PCE data will play a decisive role in shaping the outlook.
Trading Strategy for Today
Buy Setup
Entry: 3650 – 3653
SL: 3645
TP: 3662 – 3675 – 3690 – 3706 – 3725
Sell Setup 1
Entry: 3700 – 3703
SL: 3708
TP: 3690 – 3675 – 3662 – 3650 – 3633
Sell Setup 2
Entry: 3738 – 3740
SL: 3746
TP: 3725 – 3710 – 3700 – 3675 – 3650
Summary
The preferred bias for today is to look for buy opportunities on dips, in line with the broader uptrend.
Follow me to receive the latest updates as soon as market structure changes

XAUUSD –Today’s Trading Outlook | Sell Fill Liquidity & Buy Zone
Hello traders,
In the recent sessions, gold has continued to show strong volatility around important liquidity zones and support–resistance levels. The current structure indicates that sellers remain in control in the short term, while buyers are expected to return only if price reaches deeper support areas.
Technical View
Main Resistance: 3670 – 3680, aligning with the FVG zone → key area for Sell to Fill Liquidity.
Short-term Support: 3630 – 3627. A break below could open the way for a deeper decline.
Buy Scalping Zones: 3613 – 3615 and 3595 – 3598, suitable for quick intraday longs.
Medium-term Buy Zone: 3600 – 3590, confluence with strong liquidity zone and major support.
MACD Indicator: leaning bearish, with a negative histogram, showing selling pressure still dominant.
Trading Scenarios
Sell Setup (priority)
Sell Liquidity Zone: 3670 – 3680
SL: 3685
TP: 3650 – 3635 – 3627 – 3615 – 3600
Buy Scalping
Buy Zone 1: 3613 – 3615 | SL: 3608 | TP: 3625 – 3638 – 3645
Buy Zone 2: 3595 – 3598 | SL: 3590 | TP: 3610 – 3625 – 3638 – 3645 – 3670
Medium-term Buy
Zone: 3600 – 3590
SL: 3584
Extended TP: 3633 – 3660 – 3675
Conclusion
In the short term, gold is likely to retest the upper liquidity zone before continuing with further declines. Sellers remain in control for now, but deeper support zones will provide potential entry levels for medium-term buyers.
Keep a close watch on these key levels and align your trades with your personal strategy.
Follow along to get the earliest updates whenever market structure changes.

XAUUSD – Medium-Term Outlook After Fed Rate CutXAUUSD – Medium-Term Outlook After Fed Rate Cut
Hello fellow traders,
The most anticipated event of September is now clear: the Federal Reserve has cut interest rates by 25 basis points, the first reduction this year. Market expectations also indicate the possibility of another 50 basis points cut in the upcoming meeting. In his speech, Chairman Powell highlighted the “dual risk” – inflation could rise further while employment shows signs of weakness.
Technical View
Gold has formed an H1 candle closing below the rising price channel, signalling a possible violation of the medium-term uptrend.
The buying side failed to maintain momentum after the rate cut news, showing caution in entering at elevated price levels.
Medium-term investors may consider waiting for a lower price to enter fresh longs.
However, the downside is not fully confirmed, as price is still hovering around the ascending trendline → selling directly at current levels still carries certain risks.
Trading Scenarios
Sell Strategy
Scalping: 3676 – 3678 | SL: 3683 | TP: 3666 – 3650 – 3635 – 3628
(Stop loss can be moved to breakeven if price reacts well, to hold positions longer).
Sell Zone: 3697 – 3700 | SL: 3705 | TP: 3680 – 3666 – 3650 – 3635 – 3628
Buy Strategy
Scalping: 3634 – 3636 | SL: 3629 | TP: 3645 – 3660 – 3672
Buy Zone: 3600 – 3598 | SL: 3590 | TP: 3633 – 3645 – 3660 – 3675 (extended)
Conclusion
Gold is currently in a sensitive phase after the Fed’s decision to cut rates. Traders must watch price action carefully around major support and resistance levels to confirm a clearer direction.
Stay tuned to this outlook — I will continue to provide updates as the market structure evolves. Follow along to receive the fastest scenario changes as price action develops.

LiamTrading – XAUUSD Strategy for TodayI would like to share my personal view on gold for the day.
The overall trend in XAUUSD continues to be very strong, with the price consistently making fresh highs over the past two weeks. Buying interest has remained steady across sessions, while any corrections have been short-lived, mostly visible on the M15–M30 timeframes.
Yesterday, gold broke out of the Pennant pattern on the upside and is now consolidating near 3,680. On the H4 chart, this level aligns with an important Fibonacci zone, providing further technical confirmation.
From an Elliott Wave perspective, I expect Wave 3 to conclude near 3,700, followed by a corrective Wave 4 towards 3,660 – a level which has acted as reliable support in the past. After that, gold may enter its final Wave 5, with the potential to move towards the 3,740+ region.
Trading setups for consideration:
Buy 3658 – 3656, SL 3651, TP 3674 – 3688 – 3700 – 3715 – 3730 – 3744
Sell 3697 – 3700, SL 3705, TP 3688 – 3672 – 3660 – 3650
Sell 3740 – 3744, SL 3748, TP will be decided based on the price structure at that time
Important levels to keep in focus: 3673 – 3663 – 3635 and 3721, as these zones may trigger price reactions and could be useful for intraday scalping opportunities.
This is my personal outlook on gold for today. I hope it will be helpful to fellow traders in making better trading decisions. Kindly share your feedback in the comments.
