GOLD WEEKPLAN: UP FIRST DOWN AFTEROANDA:XAUUSD Footprint Analysis
The Footprint chart provides a more detailed view of the order flow. Here are some key points:
Price Pullback: The recent candles show a decrease in buying pressure (green) and an increase in selling pressure (red).
Volume Footprint: The trading volume (Total) and Delta (the difference between buying and selling pressure) on each candle show the order distribution.
The candle on the 19th has a negative Delta (~ -5.96 K), indicating that selling pressure is dominant, which aligns with the corrective pullback.
However, there's no major volume divergence, suggesting that this may only be a typical correction.
Detailed Footprint Analysis: The numbers within each candle show the number of buy orders (on the left) and sell orders (on the right) at each price level. When the price pulls back to the Imbalance or Strong OB zone, it's crucial to monitor the Footprint for signs of buying pressure returning (Delta turning positive or significant buying volume at key price levels), which would serve as a confirmation signal for a long entry.
OANDA:XAUUSD General Analysis
The XAUUSD market is in a strong uptrend, confirmed by the market structure:
Higher Highs (HH): Each new peak is higher than the previous one.
Higher Lows (HL): Each new trough is higher than the previous one.
Recently, the price created a Break of Structure (BOS), breaking the previous high, which indicates a continuation of the uptrend. After the BOS, the price established a new high (HH) and is now making a corrective pullback to find a strong support zone before continuing its upward momentum.
Imbalance (Fair Value Gap - FVG): This is a liquidity void created when the price moves too quickly. According to SMC theory, the market tends to return to fill this gap.
Location: The price range is from ~$3660 to ~$3670 USD.
Significance: This zone could act as a temporary support level. If the price returns to this area, it might fill the Imbalance and then continue to rise.
Strong OB (Order Block): This is a large block of orders left behind by "Smart Money" and often serves as a strong support or resistance zone.
Location: The price range is from ~$3645 to ~$3655 USD.
Significance: This is the strongest support zone to consider for a long entry. The price is likely to pull back to this area, tap into the order block, and then bounce back up to continue the trend.
Additionally, there are two important liquidity zones to note:
Buy Side Liquidity ($$$): Located above the most recent high (~$3700 USD). The price has the potential to move up to sweep this liquidity.
Sell Side Liquidity ($$$): Located below the most recent low (~$3620 USD). This zone could be swept if there is a sharp market drop, but it's highly likely that the price will respect the bullish structure and not break this low.
Gold

LiamTrading – XAUUSD Trading Scenario for TodayGold continues its robust upward momentum and is now approaching the critical resistance zone around 3,697 – 3,700. This is a confluence point with the Fibonacci extension level and also a zone where sellers might re-enter strongly.
Technical Analysis
On the H1 chart, the price has tested the resistance zone multiple times but hasn't broken through decisively. This indicates that profit-taking pressure is emerging.
The sell confirmation zone will form if the price breaks below 3,685 – 3,686, at which point the correction target could be around 3,673.
The main Buy Zone is located at 3,650 – 3,645, coinciding with previous support and a strong liquidity area. This is a region where a price increase reaction is likely.
Further down, the 3,628 – 3,630 zone is considered solid support on the larger frame, and if retested, it will be a long-term buying opportunity.
Conversely, if the price decisively surpasses the strong resistance zone of 3,720 – 3,730, the upward trend will be confirmed to continue, opening up higher targets around 3,750+.
Trading Plan Reference
Short-term sell around 3,697 – 3,700, SL 3,707, TP 3,686 – 3,673.
Short-term buy around 3,650 – 3,645, SL 3,640, TP 3,673 – 3,690.
Long-term buy around 3,628 – 3,630, SL 3,620, TP 3,660 – 3,690 – 3,720.
These are my personal views on XAUUSD, and you can use them as a reference to build your own plan. If you find this useful, follow me for the latest updates on new gold trading scenarios.

XAUUSD – Daily Trading Plan
Hello Traders,
Gold opened the Asian session holding its price structure firmly. The 3708 level will be the key pivot today:
If price sustains above this level, the next upside targets are 3750 and possibly 3780.
If price reacts lower at 3708 resistance, then 3650 or even 355x could be the zones to watch for buying opportunities.
Fundamental Context
Last week’s correction was triggered by comments from the Fed Chair on interest rate policy. The Fed does not intend to cut rates too frequently, and this week’s PCE data will play a decisive role in shaping the outlook.
Trading Strategy for Today
Buy Setup
Entry: 3650 – 3653
SL: 3645
TP: 3662 – 3675 – 3690 – 3706 – 3725
Sell Setup 1
Entry: 3700 – 3703
SL: 3708
TP: 3690 – 3675 – 3662 – 3650 – 3633
Sell Setup 2
Entry: 3738 – 3740
SL: 3746
TP: 3725 – 3710 – 3700 – 3675 – 3650
Summary
The preferred bias for today is to look for buy opportunities on dips, in line with the broader uptrend.
Follow me to receive the latest updates as soon as market structure changes

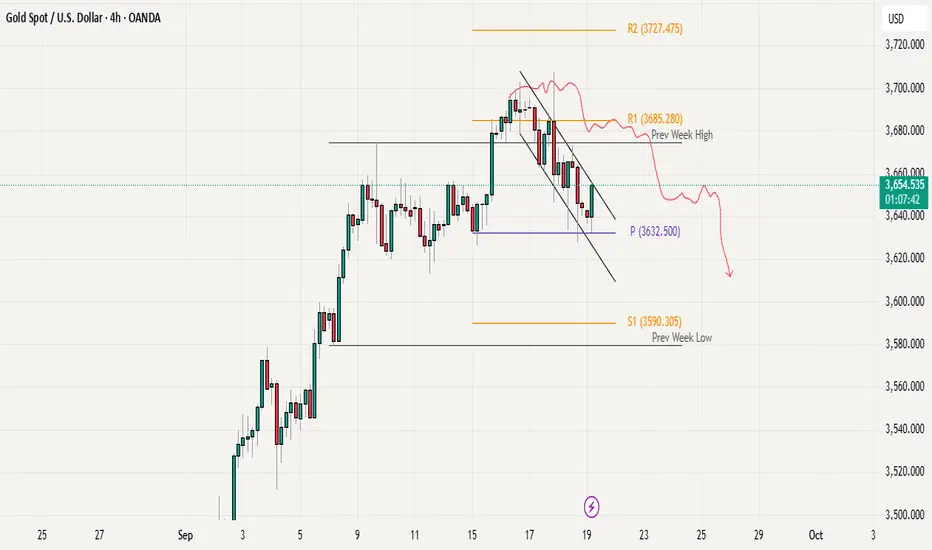
Gold Consolidating Near All-Time HighLast week Gold made a new all-time high around the 3707 level, and we have seen minor pullback after this high, leading to a pullback towards the 3620 -30 area. From there, the price bounced back strongly and is now trading close to the 3700 mark again. Currently, the market seems to be consolidating in a range between 3620 and 3700-07. The overall trend still looks bullish, but for the next clear direction, we need a strong higher time frame close either above 3700 for further upside or below 3600 for possible deeper correction.
Immediate resistance 3700-07
Weekly R1 3719
Weekly R2 3754
Pivot 3672 (As immediate support)
Weekly S1 3628

Gold Price Today: XAUUSD Sets Stage for Continued Bullish ExpansGold (XAUUSD) Market Report – September 21, 2025
Gold remains positioned near 3,685, with recent price behavior showing a structured climb despite short bursts of volatility. The market is cycling through phases of expansion and retracement, where each corrective leg has been followed by renewed upward momentum. This rhythm signals that buyers are steadily maintaining control of the broader trend.
The current setup reflects a market that is rebalancing efficiently. Short-term pullbacks are being absorbed quickly, keeping pressure aligned toward the upside. The sequence of structural shifts on the chart points to a continuation of this momentum, suggesting that higher valuations are within reach if the present flow persists.
Overall, gold’s tone is constructive, characterized by resilience and sustained demand. The pattern unfolding indicates a market preparing for further expansion, with the potential for continuation into higher ranges in the sessions ahead.

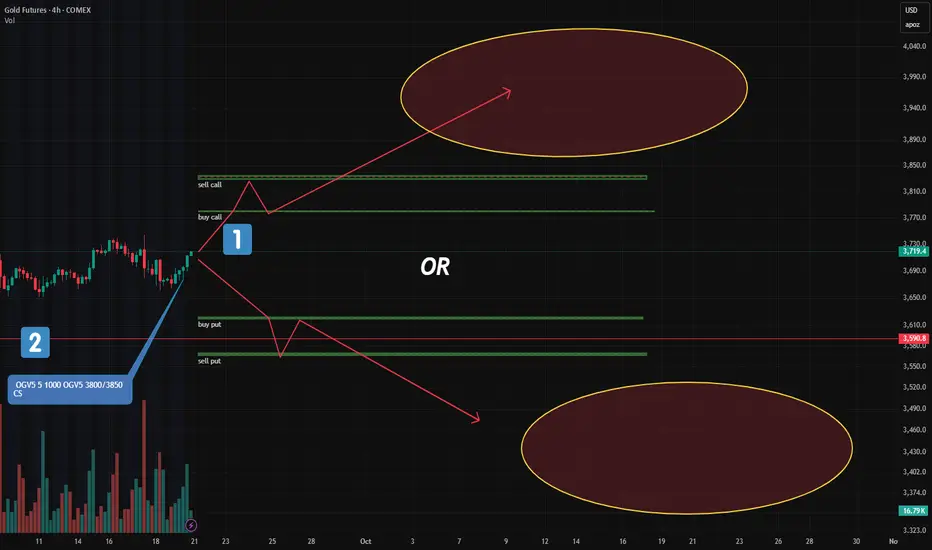
Gold: Major New Option Portfolios Signal Strong Moves AheadFriday’s CME report showed a surge in large option blocks in gold — two of them stand out.
🔹 1. "Long Condor" on December Futures (GCZ24)
This is the most significant structure added:
Targets a move below $3,620 or above $3,780
In other words: a breakout is expected, not consolidation
📌 Key point:
A "Long Condor" profits from volatility, not direction.
It wins if price moves sharply — up OR down — but loses if it stays flat.
🔹 2. Bull Call Spread (Oct Series): $3800–$3850
Another key play:
A classic bullish call spread at 3800/3850
Target: upside beyond current levels
But here’s the difference:
Unlike the "Long Condor", this one needs a clear upward move — and soon. Within a few days.
This isn’t about volatility.
It’s a directional bet that gold will rise.
🧠 Bottom Line:
One portfolio says: "Breakout coming — no matter which way."
Another says: "Gold goes up — and soon."
Are they aligned?
Contradictory?
Or could both win?
Trade smarter, not harder! Looking to boost your profits with valuable market insights and data-driven entry points? Join us or keep moving!
Gold Hits New Record: Should You Buy or Sell in This Hot Market?Namaste traders,
This past week, gold surprised everyone by closing strong. On Friday (19/09), it moved higher again, marking its 5th consecutive weekly gain at $3,683.24/oz, while futures touched $3,718.50/oz. This surge followed the Fed’s rate cut, which many thought would cool the yellow metal. So, is this a genuine rally or just a bull trap?
Fundamentals: Rate Cut Pushes Gold Higher
Lower interest rates reduce the cost of holding gold.
Fed’s dovish signals raised expectations for more easing.
In India, physical gold demand is at a 10-month high, while China also shows strong appetite despite higher prices.
Technical Outlook
Gold broke its downward trendline, signaling bullish continuation. Buyers are in control.
This Week’s View: Focus on buying near-term targets at $372x and $373x, but stay alert to macro news.
Trading Setups (with strict risk management):
Buy Scalp: $3671–$3669 | SL: $3666 | TP: $3674–$3694
Buy Zone: $3657–$3659 | SL: $3647 | TP: $3669–$3709
Sell Scalp: $3713–$3715 | SL: $3719 | TP: $3705–$3785
Sell Zone: $3731–$3733 | SL: $3741 | TP: $3723–$3683
Will gold shine brighter and set another all-time high? Share your view! 👇

GOLD – Breakout / Swept High – Where to BUY?1. Market Overview
Gold prices are consolidating around 3655 – 3660 after showing a short-term bearish structure.
On the H1 chart, we can see clear supply and demand zones:
• Liquidity Buy Zone near 3640 (potential demand area).
• Imbalance / Supply Zone around 3670 – 3680.
The broader higher-timeframe trend is still bullish, but in the near term the market is retesting liquidity levels.
________________________________________
2. Key Levels & Zones
• Liquidity Buy Zone: 3640 – 3645 → important support.
• Sell Scalp Zone / Imbalance: 3670 – 3680 → short-term resistance.
• Higher High Target (HH): 3700 – 3710 → strong higher-timeframe resistance.
• Long-term Support: 3620 – 3630.
________________________________________
3. Main Trading Scenarios
🟢 Long Setup (with trend)
• Wait for price to revisit the Liquidity Buy Zone (3640 – 3645).
• If bullish reversal signals appear (pin bar, engulfing candle, etc.), consider entering a Long position.
🎯 Targets:
• Short-term: 3678 (trendline break retest).
• Mid-term: 3700 – 3710 (higher high).
🔴 Short Setup (scalp only)
• If price pushes into the Sell Scalp Zone (3670 – 3680) and faces strong rejection → take a Short scalp.
• 🎯 Target: 3640 – 3645.
⚠ Note: Shorts go against the main bullish trend, so they should be managed quickly and not held for long.
________________________________________
4. Trade Management Notes
• Focus on Long trades near support, as higher timeframe bias is still bullish.
• Short positions should only be taken as scalp setups near resistance.
• Risk control: limit risk to 1–2% per trade, avoid holding trades against the main trend.
________________________________________
📌 Conclusion
Gold (XAUUSD) is currently testing the descending trendline and resistance zone.
• A successful breakout may lead price towards 3700+.
• Otherwise, the market is likely to dip back into 3640 before starting the next bullish leg.

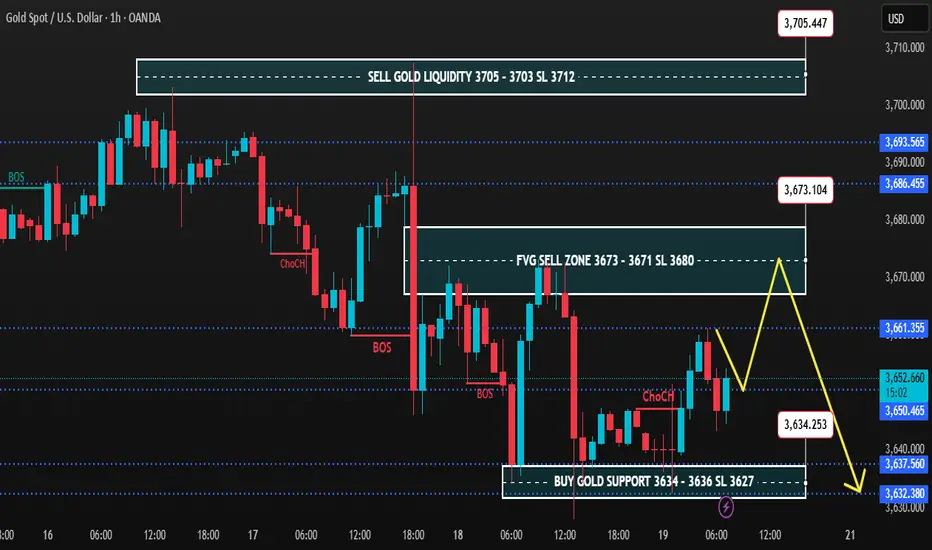
Gold 1H – Risk of Premium Sweeps Before ReversalOn the 1H timeframe, gold is consolidating after consecutive BOS and ChoCH signals, showing rejection from premium levels. The market is oscillating between the fresh FVG sell zone at 3,673–3,671 and the deep discount support at 3,634–3,636. Liquidity remains positioned above 3,705 and below 3,632, keeping scope for engineered sweeps before a clearer directional move emerges.
________________________________________
📌 Key Structure & Liquidity Zones (1H):
• 🔴 FVG SELL ZONE 3,673 – 3,671 (SL 3,680)
Premium intraday pocket for rejection, targeting 3,660 → 3,650 → 3,640.
• 🔴 SELL GOLD LIQUIDITY 3,705 – 3,703 (SL 3,712)
Major premium liquidity trap, likely to precede continuation lower towards 3,690 → 3,675 → 3,660.
• 🟢 BUY GOLD SUPPORT 3,634 – 3,636 (SL 3,627)
Discount demand zone, aiming for recovery towards 3,645 → 3,660 → 3,670 if defended.
________________________________________
📊 Trading Ideas (Scenario-Based):
🔻 Sell Setup – FVG Rejection (3,673–3,671)
• Entry: 3,673 – 3,671
• Stop Loss: 3,680
• Targets:
TP1: 3,660
TP2: 3,650
TP3: 3,640
👉 Expect engineered liquidity grab into the FVG before downside extension.
🔻 Sell Setup – Premium Liquidity Sweep (3,705–3,703)
• Entry: 3,705 – 3,703
• Stop Loss: 3,712
• Targets:
TP1: 3,690
TP2: 3,675
TP3: 3,660
👉 Smart money may sweep highs near 3,705 before resuming bearish leg.
🔺 Buy Setup – Discount Reversal (3,634–3,636)
• Entry: 3,634 – 3,636
• Stop Loss: 3,627
• Targets:
TP1: 3,645
TP2: 3,660
TP3: 3,670
👉 High risk-reward opportunity if gold defends discount demand; suitable for counter-trend scalps.
________________________________________
🔑 Strategy Note
Gold remains under pressure below 3,673–3,705, favouring short setups into premium sweeps. However, close attention is needed at 3,634–3,636, as buyers may attempt to accumulate and reclaim structure. Best practice: trade smaller lots until the New York session provides confirmation of direction.
GOLD - Breakout / Swept High appear - Where to BUY ? 🟡 OANDA:XAUUSD XAUUSD Daily Plan – September 19, 2025
1. Market Overview
Price is consolidating around 3655 – 3660 after forming a short-term bearish structure.
On H1, several supply & demand zones are highlighted:
Liquidity Buy Zone around 3640 (potential demand).
Imbalance / Supply Zone around 3670 – 3680.
The overall higher-timeframe trend remains bullish, but in the short term, the market is retesting liquidity areas.
2. Key Levels & Zones
Liquidity Buy Zone: 3640 – 3645 → key support.
Sell Scalp Zone / Imbalance: 3670 – 3680 → short-term resistance.
Higher High Target (HH): 3700 – 3710 → strong higher-timeframe resistance.
Longer-term Support: 3620 – 3630.
3. Main Trading Scenarios
🟢 Long Setup (trend-aligned)
Wait for price to retest Liquidity Buy zone 3640 – 3645.
If reversal signals appear (pin bar, engulfing, etc.), consider opening Long.
Targets:
Short-term: 3678 (trendline break retest).
Mid-term: 3700 – 3710 (HH).
🔴 Short Setup (scalp only)
If price retraces into Sell Scalp Zone 3670 – 3680 and shows strong rejection → Short scalp opportunity.
Target: 3640 – 3645.
Note: Short trades are counter-trend, so manage quickly.
4. Trade Management Notes
Prioritize Longs from support zones since the higher-timeframe trend is still bullish.
Shorts should only be seen as short-term scalp opportunities near resistance.
Risk management: limit to 1–2% per trade, avoid holding against the main trend.
📌 Conclusion: XAUUSD is currently testing the descending trendline and resistance area. A successful breakout could target 3700+. Otherwise, the market is likely to revisit 3640 before launching the next bullish leg.
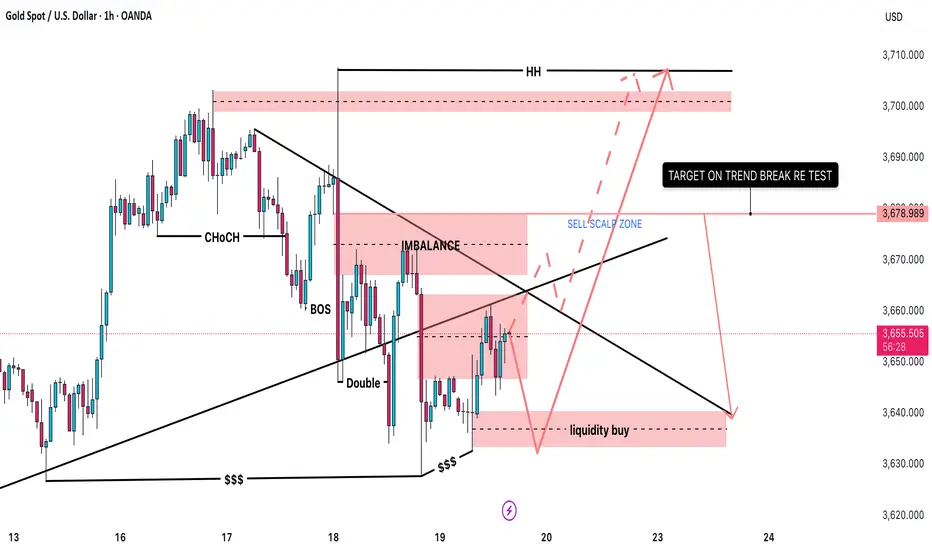
XAUUSD –Today’s Trading Outlook | Sell Fill Liquidity & Buy Zone
Hello traders,
In the recent sessions, gold has continued to show strong volatility around important liquidity zones and support–resistance levels. The current structure indicates that sellers remain in control in the short term, while buyers are expected to return only if price reaches deeper support areas.
Technical View
Main Resistance: 3670 – 3680, aligning with the FVG zone → key area for Sell to Fill Liquidity.
Short-term Support: 3630 – 3627. A break below could open the way for a deeper decline.
Buy Scalping Zones: 3613 – 3615 and 3595 – 3598, suitable for quick intraday longs.
Medium-term Buy Zone: 3600 – 3590, confluence with strong liquidity zone and major support.
MACD Indicator: leaning bearish, with a negative histogram, showing selling pressure still dominant.
Trading Scenarios
Sell Setup (priority)
Sell Liquidity Zone: 3670 – 3680
SL: 3685
TP: 3650 – 3635 – 3627 – 3615 – 3600
Buy Scalping
Buy Zone 1: 3613 – 3615 | SL: 3608 | TP: 3625 – 3638 – 3645
Buy Zone 2: 3595 – 3598 | SL: 3590 | TP: 3610 – 3625 – 3638 – 3645 – 3670
Medium-term Buy
Zone: 3600 – 3590
SL: 3584
Extended TP: 3633 – 3660 – 3675
Conclusion
In the short term, gold is likely to retest the upper liquidity zone before continuing with further declines. Sellers remain in control for now, but deeper support zones will provide potential entry levels for medium-term buyers.
Keep a close watch on these key levels and align your trades with your personal strategy.
Follow along to get the earliest updates whenever market structure changes.

GOLD SHOWING A GOOD UP MOVE WITH 1:10 RISK REWARD GOLD SHOWING A GOOD UP MOVE WITH 1:10 RISK REWARD
DUE TO THESE REASON
A. its following a rectangle pattern that stocked the market
which preventing the market to move any one direction now it trying to break the strong resistant lable
B. after the break of this rectangle it will boost the market potential for break
C. also its resisting from a strong neckline the neckline also got weeker ald the price is ready to break in the outer region
all of these reason are indicating the same thing its ready for breakout BREAKOUT trading are follws good risk reward
please dont use more than one percentage of your capitalfollow risk reward and tradeing rules
that will help you to to become a bettertrader
thank you

Gold Intraday Analysis: Range Play Until BreakoutGold is currently trading in a range-bound structure after pulling back from the 3700 level. The weekly pivot around 3632 is acting as strong support, while the 3700 zone serves as resistance, forming the upper boundary of the range. Price is showing signs of consolidation between these levels, suggesting a sideways market. For any breakout confirmation, we need to see a clear H1 or H4 candle close above 3700 or below 3632, along with volume or strong price rejection/follow-through. Until then, the price action favors range trading within these key levels.
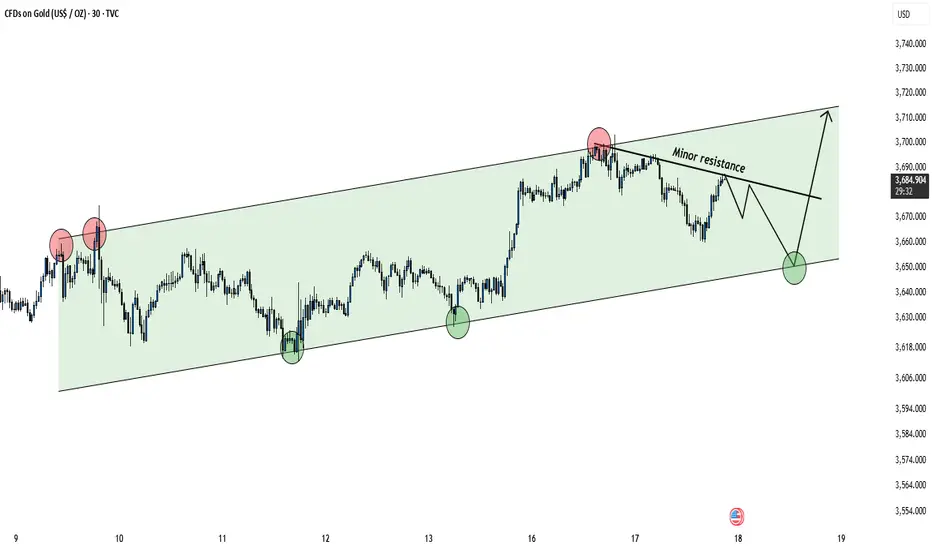
Gold Trading Inside Channel – Key Support & Resistance Levels!Hello Traders!
Gold is currently moving inside a well-defined ascending channel on the 30-min chart. Both buyers and sellers are respecting the levels of this channel, giving us clear trading opportunities.
Key Observations
Price has tested the upper channel resistance multiple times, facing rejection near $3,710–$3,720.
The lower channel support around $3,650 has been well respected, creating strong buying reactions.
A minor resistance trendline is now forming, which could temporarily limit upside momentum.
Short-term path suggests: rejection from minor resistance → retest of channel bottom → potential bounce back toward the upper channel.
Trading Plan
Bullish bias remains intact as long as Gold holds above $3,650 channel support.
A bounce from support may target $3,710–$3,720 zone again.
If support breaks, deeper correction may follow.
Rahul’s Tip
Always wait for confirmation near channel edges. Trading inside the channel can be tricky, but respecting support and resistance gives you high-probability setups.
Disclaimer: This analysis is for educational purposes only and should not be taken as financial advice. Please do your own research or consult your financial advisor before investing.
Analysis By @TraderRahulPal (TradingView Moderator) | More analysis & educational content on my profile
👉 If you found this helpful, don’t forget to like and follow for regular updates.
Gold Breaking Limits – Trend Speaks for ItselfGold Breaking Limits – Trend Speaks for Itself
Gold Market Outlook
Gold continues to demonstrate a well-structured bullish cycle, characterized by steady momentum and clean trend development. The market has transitioned from a prolonged consolidation phase into a sustained directional move, where each breakout is validated by controlled retracements. This reflects strong participation and confidence from larger players.
The sequence of market shifts and break-of-structure signals highlight how short-term pullbacks are consistently absorbed, turning into fuel for further expansion. Price action is orderly, with no signs of erratic volatility, showing that buyers remain in control and liquidity is being managed efficiently.
Overall, gold is moving in line with the broader macro sentiment. The rhythm of accumulation, expansion, and continuation suggests that the current cycle has not yet exhausted its potential. While interim pauses are expected, the structural integrity of the trend continues to favor upside development over the medium term.

Gold 1H – Retail Sales Impact Before FedOn the 1H chart, Gold is holding near 3,682 after showing a clear Break of Structure. Liquidity is now seen both above the premium resistance at 3,700 and below the Fair Value Gap demand around 3,669–3,667. With U.S. Retail Sales data due at 19:30 IST today, intraday volatility is expected, but overall positioning is still cautious ahead of the Federal Reserve’s interest rate decision later this week. Traders can look for liquidity sweeps towards premium levels before retracements into demand zones.
________________________________________
📌 Key Structure & Liquidity Zones (1H):
• 🔴 SELL ZONE 3,700 – 3,698 (SL 3,707): Premium resistance likely to trigger rejection towards 3,690 → 3,680 → 3,670.
• 🟢 FVG BUY ZONE 3,669 – 3,667 (SL 3,660): Fair Value Gap demand zone for retracements, targeting 3,680 → 3,690 → 3,700+.
• 🟢 BUY SUPPORT 3,641 – 3,639 (SL 3,632): Deep discount support, targeting 3,655 → 3,670 → 3,685+.
________________________________________
📊 Trading Ideas (Scenario-Based):
🔺 Buy Setup – FVG Reclaim (3,669–3,667)
• Entry: 3,669 – 3,667
• Stop Loss: 3,660
• Targets:
TP1: 3,680
TP2: 3,690
TP3: 3,700+
👉 Look for a liquidity sweep into the FVG zone before New York session begins.
🔺 Buy Setup – Discount Sweep (3,641–3,639)
• Entry: 3,641 – 3,639
• Stop Loss: 3,632
• Targets:
TP1: 3,655
TP2: 3,670
TP3: 3,685+
👉 A good risk-to-reward opportunity if price sweeps stops below structure before Retail Sales release.
🔻 Sell Setup – Premium Liquidity Run (3,700–3,698)
• Entry: 3,700 – 3,698
• Stop Loss: 3,707
• Targets:
TP1: 3,690
TP2: 3,680
TP3: 3,670
👉 Expect engineered stop-runs into premium supply before fading lower.
________________________________________
🔑 Strategy Note
While Retail Sales data may bring short-term price swings, market attention is focused on the Fed. Smart Money is likely to trap both sides of liquidity: fading premium near 3,700–3,698 while accumulating buys at 3,669–3,667 and 3,641–3,639. Trade with smaller positions and confirm with H1 closes before entries.

XAUUSD – Medium-Term Outlook After Fed Rate CutXAUUSD – Medium-Term Outlook After Fed Rate Cut
Hello fellow traders,
The most anticipated event of September is now clear: the Federal Reserve has cut interest rates by 25 basis points, the first reduction this year. Market expectations also indicate the possibility of another 50 basis points cut in the upcoming meeting. In his speech, Chairman Powell highlighted the “dual risk” – inflation could rise further while employment shows signs of weakness.
Technical View
Gold has formed an H1 candle closing below the rising price channel, signalling a possible violation of the medium-term uptrend.
The buying side failed to maintain momentum after the rate cut news, showing caution in entering at elevated price levels.
Medium-term investors may consider waiting for a lower price to enter fresh longs.
However, the downside is not fully confirmed, as price is still hovering around the ascending trendline → selling directly at current levels still carries certain risks.
Trading Scenarios
Sell Strategy
Scalping: 3676 – 3678 | SL: 3683 | TP: 3666 – 3650 – 3635 – 3628
(Stop loss can be moved to breakeven if price reacts well, to hold positions longer).
Sell Zone: 3697 – 3700 | SL: 3705 | TP: 3680 – 3666 – 3650 – 3635 – 3628
Buy Strategy
Scalping: 3634 – 3636 | SL: 3629 | TP: 3645 – 3660 – 3672
Buy Zone: 3600 – 3598 | SL: 3590 | TP: 3633 – 3645 – 3660 – 3675 (extended)
Conclusion
Gold is currently in a sensitive phase after the Fed’s decision to cut rates. Traders must watch price action carefully around major support and resistance levels to confirm a clearer direction.
Stay tuned to this outlook — I will continue to provide updates as the market structure evolves. Follow along to receive the fastest scenario changes as price action develops.

Gold 1H – Dollar Strength Weighs Ahead of US DataGold on the 1H chart is testing deeper demand zones near 3,612–3,614 after repeated liquidity sweeps into 3,678 and 3,702. Sellers continue to defend premium supply zones, with engineered stop-runs fading quickly. Today’s US data releases and renewed dollar strength keep gold vulnerable to further downside unless discount demand zones show strong defence.
________________________________________
📌 Key Structure & Liquidity Zones (1H):
• 🔴 SELL SCALP 3,678 – 3,680 (SL 3,685)
Premium intraday pocket for rejection targeting 3,675 → 3,670 → 3,665.
• 🔴 SELL ZONE 3,704 – 3,702 (SL 3,711)
Major premium supply trap for engineered sweep before continuation lower toward 3,670 → 3,655 → 3,640.
• 🟢 BUY GOLD SUPPORT 3,616 – 3,618 (SL 3,610)
Fresh deep discount demand zone, targeting recovery into 3,630 → 3,645 → 3,655+ if defended.
________________________________________
📊 Trading Ideas (Scenario-Based):
🔻 Sell Setup – Intraday Premium Rejection (3,678–3,680)
• Entry: 3,678 – 3,680
• Stop Loss: 3,685
• Take Profits:
TP1: 3,675
TP2: 3,670
TP3: 3,665
👉 Expect engineered liquidity grab into premium before NY session.
🔻 Sell Setup – Higher Premium Trap (3,704–3,702)
• Entry: 3,704 – 3,702
• Stop Loss: 3,711
• Take Profits:
TP1: 3,670
TP2: 3,655
TP3: 3,640
👉 Smart money may sweep highs near 3,704 before extending bearish leg.
🔺 Buy Setup – Discount Reversal (3,616–3,618)
• Entry: 3,616 – 3,618
• Stop Loss: 3,610
• Take Profits:
TP1: 3,630
TP2: 3,645
TP3: 3,655+
👉 Strong bounce potential if dollar retraces post-data; favourable risk/reward from deep demand.
________________________________________
🔑 Strategy Note
With US data and dollar strength in focus, gold remains heavy below 3,678–3,704. Favour short setups into premium sweeps, but monitor 3,612–3,614 closely for signs of accumulation. Trade lighter size until direction clarifies post-news.

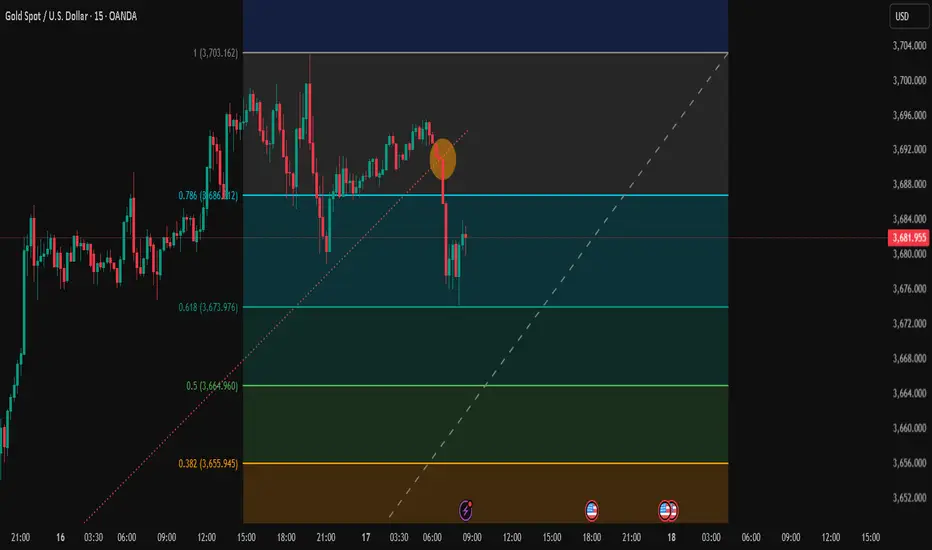
Trading Analysis for Gold Spot / U.S. Dollar (15-Minute Chart)Sell XAU/USD now at 3688.00 level and take a stop loss of 3703.00 and the targets will be as follows.
Entry range 3691.00 to 3687.00
Take Profit 1 = 3673.00
Take Profit 2 = 3665.00
Take Profit 3 = 3655.00
Take Profit 4 = 3645.00
Stock Loss 3703.00
Based on the provided 15-minute chart for Gold Spot / U.S. Dollar (XAU/USD), published by NaviPips on TradingView.com on June 30, 2025, at 17:53 UTC, here’s a suggested trading setup for a buy position:
Current Price and Trend: The current price is 3,241.875, with a slight increase of +0.250 (+0.01%). The chart shows a recent downtrend that appears to be stabilizing near the current level, suggesting a potential reversal point.
Buy Entry: Enter a buy position at 3,312.875 (current price), as it aligns with a support zone where the price has found a base, indicated by the horizontal dashed line and recent consolidation.
Stop Loss: Place a stop loss at 3,295.250, below the recent low, to protect against further downside. This level is approximately 10.625 points below the entry, defining the risk.
Take Profit Levels:
Take Profit 1: 3,317.875, a conservative target about 20.000 points above the entry, aligning with a minor resistance zone.
Take Profit 2: 3,324.750, a mid-range target approximately 31.875 points above the entry.
Take Profit 3: 3,332.500, a deeper target about 45.625 points above the entry, indicating a potential trend reversal.
Price Action: The chart indicates a downtrend with a possible bottoming pattern near the current level. The support zone and upward candlestick suggest a buy opportunity if the price holds.
Risk-Reward Ratio: The distance to the stop loss (10.625 points) compared to the take profit levels (20.000 to 45.625 points) offers a favorable risk-reward ratio, ranging from approximately 1:1.9 to 1:4.3.
Conclusion
Enter a buy at 3,241.875, with a stop loss at 3,295.250 and take profit levels at 3,317.875, 3,324.750, and 3,332.500. Monitor the price action for confirmation of an upward move, and be cautious of a potential continued downtrend if the price breaks below the stop loss level. (Note: I assume "take profot" was a typo for "take profit" and have corrected it accordingly.)
Gold 1H – Fed Decision Looms After $3,700 BreakOn the 1H timeframe, Gold is consolidating around 3,675 after sweeping through the key $3,700 level. Price briefly touched 3,702 before retreating back into the 3,670s, showing engineered liquidity runs on both sides. With the Fed policy decision expected at 1 AM VN time, volatility is likely to spike. The market remains supported by easing USD, central bank flows, and geopolitical tensions, but short-term positioning indicates possible liquidity grabs before a clear directional move.
________________________________________
📌 Key Structure & Liquidity Zones (1H)
• 🔴 SELL SCALP 3,696 – 3,694 (SL 3,703)
Premium supply pocket for engineered rejection targeting 3,690 → 3,685 → 3,680.
• 🟢 FVG BUY ZONE 3,674 – 3,665 (SL 3,660)
Fair Value Gap demand zone for retracement into structure, targeting 3,685 → 3,695 → 3,700+.
• 🟢 BUY SUPPORT 3,636 – 3,638 (SL 3,630)
Deep discount accumulation zone targeting 3,655 → 3,670 → 3,680+.
________________________________________
📊 Trading Ideas (Scenario-Based)
🔺 Buy Setup – FVG Reclaim (3,674–3,665)
• Entry: 3,674 – 3,665
• Stop Loss: 3,660
• Take Profits:
o TP1: 3,685
o TP2: 3,695
o TP3: 3,700+
👉 Look for liquidity sweep into FVG before NY session/Fed.
🔺 Buy Setup – Deep Discount (3,636–3,638)
• Entry: 3,636 – 3,638
• Stop Loss: 3,630
• Take Profits:
o TP1: 3,655
o TP2: 3,670
o TP3: 3,680+
👉 High risk-to-reward setup if stops are hunted before Fed decision.
🔻 Sell Setup – Premium Trap (3,696–3,694)
• Entry: 3,696 – 3,694
• Stop Loss: 3,703
• Take Profits:
o TP1: 3,690
o TP2: 3,685
o TP3: 3,680
👉 Expect engineered stop-runs into premium before fading lower.
________________________________________
🔑 Strategy Note
Gold’s break above $3,700 highlights strong bullish sentiment, but the Fed decision risk suggests smart money may sweep liquidity both ways. Stay flexible: short from premium zone (3,696–3,694), and defend longs at demand zones (3,674–3,665 and 3,636–3,638). Use lighter position sizing until post-Fed clarity emerges.

FED countdown | Buy at support, Sell at resistanceXAU/USD – 17/09 | Captain Vincent ⚓
🔎 Captain’s Log – News Context
18/09, 01:00 (US time): FED rate decision + Dot Plot → policy outlook for upcoming meetings
01:30: Powell’s speech – the key market focus
Market consensus: FED almost certain to cut -25bps. However, the -50bps scenario still exists → if it happens, it will be a “big boost” for Gold
During Asia–Europe session, Gold faced early profit-taking, dropping quickly to 3,677 – 3,675, reflecting caution ahead of the FED
⏩ Captain’s Summary
Gold is making a technical pullback before the FED.
Medium-term trend remains bullish, but patience is needed to wait for better Buy entries.
📈 Captain’s Chart – Technical Analysis
Storm Breaker (Resistance / Sell Zone)
Nearby OB: 3,693 – 3,695 (short scalp)
ATH Zone: 3,717 – 3,720 (strong resistance, potential heavy selling)
Golden Harbor (Support / Buy Zone)
Shallow Dock: 3,656 – 3,657 (short-term)
Main Harbor: 3,629 – 3,630 (trendline confluence + old BoS)
Market Structure
Multiple BoS confirm bullish trend
Price retracing to support, likely to bounce back and test 3,693 – 3,717
Break above 3,720 → confirms new ATH
🎯 Captain’s Map – Trade Plan
✅ Buy (priority)
Buy Zone 1
Entry: 3,656 – 3,657
SL: 3,648
TP: 3,675 – 3,693 – 3,717
Buy Zone 2
Entry: 3,629 – 3,630
SL: 3,618
TP: 3,656 – 3,690 – 3,717
⚡ Sell (only at resistance)
Sell Zone OB
Entry: 3,693 – 3,695
SL: 3,705
TP: 3,690 – 3,685 - 3680 - 368x - 36xx
Sell Zone ATH
Entry: 3,717 – 3,720
SL: 3,727
TP: 3,715 – 3,710 – 3,705 - 37xx
⚓ Captain’s Note
“Before the FED countdown, profit-taking waves pulled the Golden ship toward Golden Harbor 🏝️ (3,656 – 3,629) .
Yet the main current still flows north, the bullish trend remains intact.
Storm Breaker 🌊 (3,693 – 3,720) is the big wave, suitable for short Quick Boarding 🚤 scalps.
Sailors must stay patient – the FED wind could be the force to propel Gold to new peaks.”

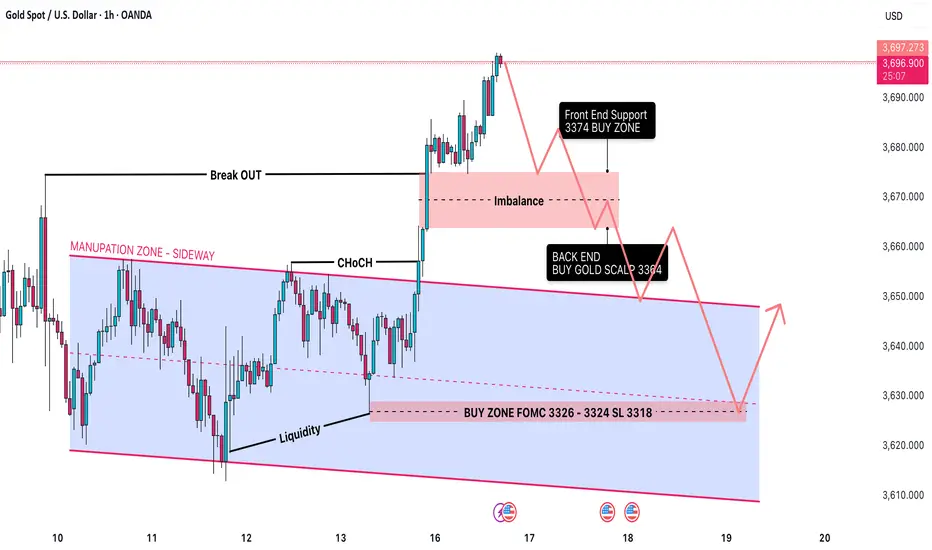
FOMC XAUUSD: Time to Hold Super SELL before FOMC🟡 XAUUSD Daily Trading Plan – Ahead of FOMC
📊 Market Context
Gold (XAUUSD) has recently moved out of its accumulation/manipulation zone and is now trading in the 3,684–3,690 range.
The market structure is bullish after a Change of Character (CHoCH) followed by a Break of Structure (BOS).
Still, imbalances remain below the present price level, suggesting the possibility of a retracement before further upside continuation.
Liquidity pools are forming around 3,721–3,725, which increases the risk of false breakouts (liquidity traps) near the FOMC.
🔎 Technical Analysis (SMC Perspective)
Structure: Bullish bias on H1/H4, confirmed by higher highs and BOS.
Imbalance Zone: 3,674 → 3,664 (likely to be revisited).
Liquidity Pools:
Buy-side liquidity: 3,721–3,725 (Sell Zone).
Sell-side liquidity: 3,626–3,624 (Equal Low Zone).
🔑 Key Levels
Resistance / Sell Zones
3,686.88 (Immediate resistance)
3,721–3,725 (Liquidity Sell Zone)
Support / Buy Zones
3,668 (Front End Buy – imbalance retest)
3,656–3,654 (Back End CP Buy Zone)
3,626–3,624 (Equal Low Liquidity Zone)
✅ Priority Scenario – BUY
Entry 1
Buy Limit: 3,668 (Front End Zone – imbalance retest)
SL: 3,661
TP: 3,690 → 3,700 → 3,721
Entry 2
Buy Limit: 3,656–3,654 (Back End CP Buy Zone)
SL: 3,648
TP: 3,690 → 3,700 → 3,721
Entry 3
Buy Limit: 3,626–3,624 (Equal Low Liquidity)
SL: 3,618
TP: 3,690 → 3,700 → 3,721
🔻 Alternative Scenario – SELL (Counter-trade)
If the price touches 3,721–3,725 (Liquidity Zone) before revisiting the lower buy zones → look for rejection patterns.
Enter SELL if bearish confirmation appears.
SL: 3,730
TP: 3,698 → 3,690 → 3,676
⚠️ Risk Management & Notes
Expect high volatility during FOMC – liquidity traps are very likely.
Reduce lot size before the news release to minimise risk.
Take trades only with confirmation (avoid blind buys/sells).
Main directional bias: Bullish as long as 3,648 holds.