XAUUSD H1 – Pennant + Head & ShouldersXAUUSD H1 – Pennant + Head & Shoulders: Two Key Levels 3657 / 3627
Hello Traders,
Gold opened the week with a bounce of over 20 points from the rising trendline and is now consolidating within a Pennant, which aligns with a small Head & Shoulders structure on the H1 chart. At the moment, the market is waiting for a breakout and confirmation to establish a clearer direction.
Pattern: A narrowing Pennant Flag alongside an H&S (left shoulder – head – right shoulder).
Key Zones to Watch
3655–3660: Crucial reaction zone (trendline + Pennant top).
3627: Critical support — a break below would invalidate the short-term bullish structure.
Fibonacci Levels:
1.618 in the mid-range, 2.618 lower — possible targets for a deeper correction.
MACD (12,26,9): Histogram has turned negative → short-term bearish momentum has the edge, though clear confirmation is still pending.
Trading Scenarios
Bullish Setup
Entry: Retest around 3654–3657
Targets: 3663 – 3670 – 3680 → 3695
Stop: Below 3648
Bearish Setup
Entry: Sell directly on breakdown, or wait for a retest near 3671–3674
Targets: 3663 – 3650 – 3633 – 3615 → 3595 → 3568 → 3540
Stop: Above 3679
the market is currently pricing in near certainty of a 0.25% Fed rate cut on 17th September, while the probability of a 0.50% cut still remains on the table.
If you find this analysis helpful, feel free to share your thoughts in the comments. I’ll update the outlook as soon as the price structure changes — follow me to get the latest setups first.
Gold

LiamTrading – XAUUSD Strategy for TodayI would like to share my personal view on gold for the day.
The overall trend in XAUUSD continues to be very strong, with the price consistently making fresh highs over the past two weeks. Buying interest has remained steady across sessions, while any corrections have been short-lived, mostly visible on the M15–M30 timeframes.
Yesterday, gold broke out of the Pennant pattern on the upside and is now consolidating near 3,680. On the H4 chart, this level aligns with an important Fibonacci zone, providing further technical confirmation.
From an Elliott Wave perspective, I expect Wave 3 to conclude near 3,700, followed by a corrective Wave 4 towards 3,660 – a level which has acted as reliable support in the past. After that, gold may enter its final Wave 5, with the potential to move towards the 3,740+ region.
Trading setups for consideration:
Buy 3658 – 3656, SL 3651, TP 3674 – 3688 – 3700 – 3715 – 3730 – 3744
Sell 3697 – 3700, SL 3705, TP 3688 – 3672 – 3660 – 3650
Sell 3740 – 3744, SL 3748, TP will be decided based on the price structure at that time
Important levels to keep in focus: 3673 – 3663 – 3635 and 3721, as these zones may trigger price reactions and could be useful for intraday scalping opportunities.
This is my personal outlook on gold for today. I hope it will be helpful to fellow traders in making better trading decisions. Kindly share your feedback in the comments.

GOLD LONG IDEA AT BOTTOM 1400PIPS IN NONFARM
BUY GOLD 3314 +900PIPS
BUY GOLD 3344 +500PIPS
📊 Today’s Non-Farm Payrolls (NFP) – USD
Average Hourly Earnings m/m:
✅ 0.3% (same as forecast and previous).
→ Wage growth is steady, no extra inflation pressure.
Non-Farm Employment Change:
❌ Actual: 22K vs Forecast: 75K vs Previous: 79K
→ Job creation has fallen sharply, showing slowdown in the US economy.
Unemployment Rate:
✅ Actual: 4.3% (as expected, higher than 4.2% previous).
→ Labour market conditions are getting weaker, unemployment rising.
🔎 Market Impact
US Dollar (USD):
Weak NFP data is negative for the dollar.
Higher unemployment increases chances of the Fed cutting rates earlier.
Gold (XAU/USD):
Positive for gold: Weak USD supports higher gold prices.
If the Fed turns dovish, safe-haven demand for gold will strengthen.
Gold may gain strong momentum on expectations of rate cuts.
Equities:
Wage inflation is stable, so no fresh inflation worries.
Equity markets may take it positively as Fed could soften policy.
📌 Key Takeaway
NFP weak → Bearish USD
Gold bullish, upside momentum possible
EUR, GBP likely to gain on USD weakness
Equities may stay supported

Gold 4H Outlook – Buy the Dip or Fade the Drop?On the 4H timeframe, Gold is consolidating just below 3,600 after a strong bullish rally. The current structure shows price pausing near premium levels, with liquidity building both above 3,600 and below 3,530. This indicates engineered sweeps are likely before the next major move.
📌 Key Structure & Liquidity Zones (4H):
🔼 Buy Zone 3,572 – 3,574 (SL 3,565): Fresh demand zone at intraday discount; potential continuation level.
🔽 Sell Scalp Zone 3,530 – 3,526 (SL 3,537): Short-term supply/pivot area; scalp opportunity if rejection happens.
📍 Liquidity Magnet 3,603 – 3,605: Upside imbalance area likely to get filled.
📊 Trading Ideas (Scenario-Based):
🔺 Buy Setup – Demand Zone Reaction
Entry: 3,572 – 3,574
Stop Loss: 3,565
Take Profits:
TP1: 3,585
TP2: 3,595
TP3: 3,605
👉 Demand block in line with bullish order flow. Watch for a liquidity sweep and rejection to fuel trend continuation.
🔻 Sell Scalp Setup – Short-Term Reaction
Entry: 3,530 – 3,528
Stop Loss: 3,537
Take Profits:
TP1: 3,520
TP2: 3,510
TP3: 3,500
👉 Intraday supply/pivot area. Best suited for quick scalp trades against the trend, targeting downside liquidity.
🔑 Strategy Note
Overall bias stays bullish, but intraday shorts can work for scalping purposes. The cleaner setup is to buy from 3,572–3,574 for continuation towards 3,600+. Smart money may attempt a liquidity sweep at 3,530 before pushing higher.

Gold 1H – Breakout Liquidity Trap Ahead of ExpansionGold on the 1H timeframe is consolidating around 3,652 after sweeping discount liquidity and reclaiming structure. Price has tapped the breakout zone and is currently trading between the scalp supply in premium and the higher liquidity pools. The structure indicates engineered moves into 3,656–3,658 or deeper liquidity around 3,672–3,674 before the next expansion. Discount demand remains protected at 3,614–3,612.
________________________________________
📌 Key Structure & Liquidity Zones (1H):
• 🔴 SELL ZONE 3,672 – 3,674 (SL 3,679): Premium supply pocket for engineered rejection, targeting 3,660 → 3,650 → 3,640.
• 🔴 SELL SCALP 3,656 – 3,658 (SL 3,663): Short-term premium sweep zone for intraday liquidity grabs, targeting 3,645 → 3,640.
• 🟢 BUY ZONE 3,614 – 3,612 (SL 3,607): Discount demand block aligned with bullish order flow, targeting 3,630 → 3,640 → 3,655.
________________________________________
📊 Trading Ideas (Scenario-Based):
🔻 Sell Setup – Premium Scalp Rejection
• Entry: 3,656 – 3,658
• Stop Loss: 3,663
• Take Profits:
TP1: 3,645
TP2: 3,640
👉 Intraday scalp opportunity if price sweeps into shallow premium liquidity.
🔻 Sell Setup – Deeper Premium Sweep
• Entry: 3,672 – 3,674
• Stop Loss: 3,679
• Take Profits:
TP1: 3,660
TP2: 3,650
TP3: 3,640
👉 Expect an engineered sweep into higher premium before reversal.
🔺 Buy Setup – Discount Demand Reaction
• Entry: 3,614 – 3,612
• Stop Loss: 3,607
• Take Profits:
TP1: 3,630
TP2: 3,640
TP3: 3,655
👉 A high R:R trade if price retraces to the protected demand before expansion.
________________________________________
🔑 Strategy Note
Smart money is likely to manipulate both premium and discount zones near the breakout point. The directional bias favours:
• Scalp sells at 3,656–3,658
• Swing sells at 3,672–3,674
• Discount buys at 3,614–3,612
Strict risk management is essential — expect liquidity sweeps on both sides before the actual expansion.

Fresh Highs, Hot Headlines , Is a Pullback Next?Gold broke out of its recent range yesterday and is now trading at new all-time highs, showing strong follow-through momentum. On the weekly pivot chart, price is currently testing Weekly R1, with the next key level being the psychological 3700 resistance.
While the technical structure remains bullish, today’s headlines from major gold newsletter are a reminder that sentiment is running extremely hot. When you start seeing mainstream media comparing gold rally to 1979 and celebrating retail traders wins, it often signals that we’re entering a frothy phase.
With the FOMC decision approaching, the risk of a short-term shakeout or healthy correction is definitely on the table. A close back below the breakout zone could trigger profit-taking, while holding above R1 would keep the path open for 3700 and beyond.
For now, 3625–3650 remains the key support area, and as long as price holds above this zone, the trend stays firmly bullish but we should stay cautious and avoid chasing too aggressively at these levels until we get clarity from the Fed.
Personally I am expecting some cool down after FOMC .

GOLD DAILY PLAN 15/09: SMC & Wyckoff Logic🔎 Market Overview
Market Structure (SMC): Price is currently moving inside a short-term descending channel but is showing signs of Wyckoff accumulation around the 3620–3635 zone (Liquidity BUY). This is a key support area.
Wyckoff: After a supply test, price is likely to consolidate and then push higher to sweep liquidity above (Liquidity SELL at 3688–3703).
Liquidity Zones
Liquidity BUY: 3595–3592 (major demand area)
Liquidity SELL: 3688–3703 (profit-taking & potential reversal zone)
📌 Key Levels
Resistance: 3668 – 3688 – 3703
Support: 3634 – 3629 – 3622 – 3617
🟢 BUY Plan (Primary Setup)
Entry: 3595–3592
Stop Loss (SL): 3587 (below Liquidity BUY)
Take Profit (TP) targets:
TP1: 3615
TP2: 3625
TP3: 3635
TP4: 3645
Open TP: 3685 (extended Wyckoff target)
🔴 SELL Plan (Counter-trade)
Entry: 3698–3701 (Liquidity SELL zone)
Stop Loss (SL): 3706 (just above breakout trap)
Take Profit (TP) targets:
TP1: 3690
TP2: 3680
TP3: 3670
TP4: 3660
Open TP: 3650
⚡ Scalping Strategy
Enter only on confirmation signals at Order Blocks (OB) or Liquidity Zones.
Prioritise BUY trades at support and SELL trades at resistance.
Apply strict risk management: risk no more than 1–2% per trade.
✅ Conclusion
Main directional bias for the day: BUY from 3595–3592, targeting the 3685–3700 region.
At Liquidity SELL 3688–3703, short-term SELL setups can be considered with targets back to 3660–3650.

Gold 1H – Fed Week: Liquidity Sweeps Before FOMCGold on the 1H timeframe is range-bound around 3,643 after a series of ChoCH/BOS prints. Liquidity is stacked above the intraday buy zone at 3,658–3,656 and higher at 3,676–3,678, while discount liquidity sits near 3,615–3,613. With markets pricing a possible Fed cut this week and the dot-plot in focus, expect engineered spikes into premium followed by mean reversion before any sustained move.
________________________________________
📌 Key Structure & Liquidity Zones (1H):
• 🔴 SELL ZONE 3,676 – 3,678 (SL 3,683): Premium resistance for an engineered sweep/rejection targeting 3,665 → 3,655 → 3,645.
• 🟢 BUY ZONE 3,658 – 3,656 (SL 3,651): Intraday demand within prior consolidation targeting 3,665 → 3,670 → 3,675+.
• 🟢 BUY SUPPORT 3,615 – 3,613 (SL 3,610): Discount demand at the base of structure targeting 3,630 → 3,645 → 3,655+.
________________________________________
📊 Trading Ideas (Scenario-Based):
🔺 Buy Setup – Intraday Reclaim (3,658–3,656)
• Entry: 3,658 – 3,656
• Stop Loss: 3,651
• Take Profits:
TP1: 3,665
TP2: 3,670
TP3: 3,675+
👉 Look for a sweep into the zone and an H1 close back above 3,656 to confirm order-flow continuation.
🔺 Buy Setup – Deep Discount Sweep (3,615–3,613)
• Entry: 3,615 – 3,613
• Stop Loss: 3,610
• Take Profits:
TP1: 3,630
TP2: 3,645
TP3: 3,655+
👉 High R:R if liquidity runs into protected demand before the New York session.
🔻 Sell Setup – Premium Sweep to Resistance (3,676–3,678)
• Entry: 3,676 – 3,678
• Stop Loss: 3,683
• Take Profits:
TP1: 3,665
TP2: 3,655
TP3: 3,645
👉 Expect a stop-run above recent highs into premium; invalidate on a firm H1 close above 3,683.
________________________________________
🔑 Strategy Note
Into Fed week, smart money often runs both sides of the book. Bias today favours: discount buys at 3,658–3,656 and 3,615–3,613, and a premium fade at 3,676–3,678. Use reduced size, wait for structure confirmation, and avoid holding through any unexpected Fed headlines or USD spikes.

XAUUSD Gold Trading Strategy September 15, 2025XAUUSD Gold Trading Strategy September 15, 2025: Weekly trend outlook, gold still has enough conditions for the possibility of continued price increases.
Basic news: After surpassing the 3670 USD/ounce mark, the highest level in history, the gold price has entered a correction phase, in the context of the market focusing on monitoring the policy moves of the US Federal Reserve (Fed). According to CME's FedWatch tool, investors are almost certain that the Fed will cut interest rates by 25 basis points, bringing the margin to 4 - 4.25%. However, the scenario of the Fed cutting 50 basis points is still considered, because this could cause the USD to plummet and push gold to skyrocket.
Technical analysis: The sideway range of 3600 - 3660 is still holding. Currently, we will wait for trading points at the 2 edges of the sideway range, but the priority is still mainly trading according to the trend.
Important price zones today: 3600 - 3605 and 3660 - 3665. Today's trading trend: Sideway.
Recommended orders:
Plan 1: BUY XAUUSD zone 3600 - 3602
SL 3597
TP 3605 - 3615 - 3635 - 3665 - OPEN.
Plan 2: BUY XAUUSD zone 3618 - 3620
SL 3615
TP 3623 - 3630 - 3650 - 3665.
Plan 3: SELL XAUUSD zone 3663 - 3665
SL 3668
TP 3660 - 3650 - 3640 - 3630 (small volume).
Wish you a new week of safe, effective and profitable trading.🥰🥰🥰🥰🥰

Gold Stuck in 3620–3655 Range – All Eyes on Fed DecisionGold is still consolidating between 3620–3625 support and 3650–3655 resistance, respecting this week’s pivot level around 3632. As highlighted in the weekly outlook, this week’s trading action is likely to remain muted until the FOMC rate decision and press conference on Wednesday.
Until then, we can expect price to stay range-bound, with quick scalps working better than trend trades.
Once the Fed outcome is out, we should see a clearer short-term direction.
A higher-timeframe close above 3655 could open the door for a move toward 3675+ and potentially new highs.
On the flip side, a break below 3620 could trigger a deeper pullback, but so far there’s no sign of reversal pressure bulls remain firmly in control on higher timeframes.

Gold Outlook – Short-Term Pullback, Long-Term StrengthGold has shown a strong bullish phase over recent weeks after a long consolidation. The market moved from accumulation into expansion, reflecting renewed participation by larger players. This upward momentum indicates strong capital inflows, supported by macroeconomic uncertainty and shifting investor sentiment.
Technically, price has broken out of a prolonged range and established a clear upward trajectory. Market structure suggests that buyers remain in control, though current price levels are showing signs of potential exhaustion, which could trigger short-term corrective moves before the broader trend resumes.
Fundamentally, global economic pressures continue to boost gold’s role as a safe-haven asset. Concerns over inflation, central bank policy adjustments, and currency volatility are keeping investor demand elevated. With global risk sentiment fluctuating, gold is likely to remain an attractive hedge, sustaining its medium-term bullish outlook despite short-term pullbacks.
Conclusion: Gold is in an expansion cycle, supported by both technical momentum and fundamental demand. Short-term corrections are expected, but the broader trajectory remains upward.

XAUUSD Gold Trading Strategy September 12, 2025XAUUSD Gold Trading Strategy September 12, 2025: Gold rebounded strongly, fully supported by US economic data and trend technical conditions.
Fundamental news: On Thursday (September 11) in the New York trading session, gold prices fluctuated strongly due to the influence of the US CPI index and initial data on unemployment claims. Gold prices recovered strongly in today's Asian session and are currently trading at $3,650/oz.
Technical analysis: Gold prices increased sharply after the CPI news was released. Currently, gold prices have increased sharply but are still fluctuating in the 3,600 - 3,660 range and there are no signs of a breakout. We still prioritize trading according to the main trend and waiting for trading at the confluence of MA and FVG.
Important price zones today: 3635 - 3640, 3600 - 3605 and 3660 - 3665.
Today's trading trend: BUY.
Recommended orders:
Plan 1: BUY XAUUSD zone 3635 - 3637
SL 3632
TP 3640 - 3650 - 3660 - 3690.
Plan 2: BUY XAUUSD zone 3600 - 3602
SL 3597
TP 3605 - 3615 - 3635 - 3665 - OPEN.
Plan 3: SELL XAUUSD zone 3663 - 3665
SL 3668
TP 3660 - 3650 - 3640 - 3630. (small volume).
Wish you a successful, effective and profitable weekend trading day.🌟🌟🌟🌟🌟

Bulls Back in Action Next Stop 3700?Gold finally waking up after a quick nap and it’s breaking out of triangle it was stuck in. Eyes on 3650, the key level to watch. A strong higher-timeframe (H4 or daily) close above this level can open doors for the next leg up, with this week’s high around 3675 as the first target or higher 3700 for main target. Support at 3620–3625 looks solid, giving bulls a strong base to defend. No rejection signals yet, trend still looks healthy and bulls clearly aren’t ready to let go of control just yet.

Gold 1H – Demand Sweep Before Premium ExpansionGold on the 1H chart is currently consolidating near 3,644 after multiple Change of Character (ChoCH) moves, signalling engineered liquidity grabs. Price has formed clear demand footprints around 3,620 and deeper at 3,593, while premium supply is positioned between 3,673–3,680. This suggests a likely retracement into discount demand zones before expansion towards premium liquidity levels.
________________________________________
📌 Key Structure & Liquidity Zones (1H):
• 🔼 Buy Zone 3,620 – 3,618 (SL 3,613): Fresh demand block aligned with bullish order flow.
• 🔼 Buy Zone 3,593 – 3,591 (SL 3,596): Deeper liquidity sweep zone, offering strong risk-to-reward.
• 🔽 Sell Zone 3,673 – 3,671 (SL 3,680): Premium supply pocket, likely to trigger short-term liquidity grabs.
________________________________________
📊 Trading Ideas (Scenario-Based):
🔺 Buy Setup – Shallow Demand Reaction
• Entry: 3,620 – 3,618
• Stop Loss: 3,613
• Take Profits:
TP1: 3,635
TP2: 3,650
TP3: 3,665+
👉 Expect a bounce from shallow demand before retesting premium supply.
🔺 Buy Setup – Deeper Liquidity Sweep
• Entry: 3,593 – 3,591
• Stop Loss: 3,596
• Take Profits:
TP1: 3,610
TP2: 3,625
TP3: 3,645+
👉 Suitable for swing traders targeting higher R:R after liquidity engineering.
🔻 Sell Setup – Premium Rejection
• Entry: 3,673 – 3,671
• Stop Loss: 3,680
• Take Profits:
TP1: 3,660
TP2: 3,650
TP3: 3,635
👉 Scalp trade opportunity at premium supply; overall bias remains bullish, so risk should be managed tightly.
________________________________________
🔑 Strategy Note
The broader bias is bullish, but smart money may drive price into 3,620 or even 3,593 demand zones before expansion. Cleaner setups favour buying dips, while shorts from 3,673 are counter-trend scalps with limited scope.

Gold 1H – CPI Liquidity Play Before ExpansionGold on the 1H timeframe is consolidating near 3,633 after multiple ChoCHs and engineered liquidity grabs. With today’s CPI release, price is expected to sweep both premium and discount liquidity zones. The structure suggests engineered spikes toward 3,688–3,691 or dips into 3,595–3,592 before expansion.
________________________________________
📌 Key Structure & Liquidity Zones (1H):
• 🔴 SELL ZONE 3,643 – 3,645 (SL 3,650): Premium supply pocket for short-term rejection.
• 🔴 SELL ZONE 3,688 – 3,691 (SL 3,696): Premium sweep zone targeting 3,680 → 3,670 → 3,660 → 3,650 with extended open target at 3,625.
• 🟢 BUY ZONE 3,595 – 3,592 (SL 3,587): Discount demand zone targeting 3,615 → 3,625 → 3,635 → 3,645 with extended open target at 3,685.
________________________________________
📊 Trading Ideas (Scenario-Based):
🔻 Sell Setup – Premium Rejection (Intraday)
• Entry: 3,643 – 3,645
• Stop Loss: 3,650
• Take Profits:
TP1: 3,630
TP2: 3,620
TP3: 3,600
👉 Scalp opportunity if CPI spikes price into this supply zone.
🔻 Sell Setup – CPI Premium Sweep
• Entry: 3,688 – 3,691
• Stop Loss: 3,696
• Take Profits:
TP1: 3,680
TP2: 3,670
TP3: 3,660
TP4: 3,650
Open: 3,625
👉 Expect engineered CPI move into premium liquidity before reversal.
🔺 Buy Setup – CPI Discount Sweep
• Entry: 3,595 – 3,592
• Stop Loss: 3,587
• Take Profits:
TP1: 3,615
TP2: 3,625
TP3: 3,635
TP4: 3,645
Open: 3,685
👉 Ideal entry if CPI drives gold into deep discount demand before expansion.
________________________________________
🔑 Strategy Note
CPI will dictate volatility and smart money may sweep liquidity both sides. Key bias favours:
• Scalp sells at 3,643–3,645
• Deeper swing sells at 3,688–3,691
• High R:R buys at 3,595–3,592
Risk management is essential — expect fake-outs before expansion.

Bulls Pausing, Bears Hopeless? Gold Awaits CPI TriggerGold is currently taking a breather after its strong bull run, just as highlighted in the last couple of updates. On the daily chart, price action is consolidating within the 3620–3650/55 zone, and with CPI data lined up today, a breakout from this range could set the next decisive move.
Sentiment-wise, bulls remain in full control, while bears look like they’re running out of steam. Still, a healthy reset is overdue after such an extended rally. From a price action perspective, there are no clear signs of reversal on any major timeframe yet. The key support to watch remains 3600 on a daily closing basis. As long as price holds above this level, the bullish structure is safe.
If 3600 gives way, we could see a deeper pullback toward 3589 (Fib 0.236 support) and then into the 3550–55 zone, which stands as the next strong secondary support. Until then, consolidation here should be treated as part of the ongoing bullish cycle rather than a trend reversal.

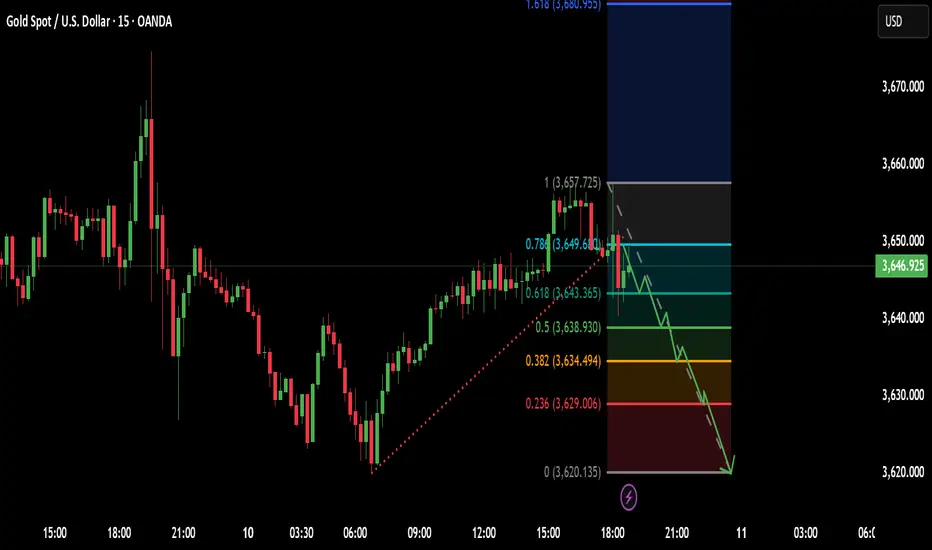
Trading Analysis for Gold Spot / U.S. Dollar (15-Minute Chart)Entery = 3649.00
Stock Loss = 3657.00
Take profit 1 = 3643.00
Take profit 2 = 3639.00
Take profit 3 = 3634.00
Take profit 4 = 3628.00
Based on the provided 15-minute chart for Gold Spot / U.S. Dollar (XAU/USD), published by NaviPips on TradingView.com on June 30, 2025, at 17:53 UTC, here’s a suggested trading setup for a buy position:
Current Price and Trend: The current price is 3,241.875, with a slight increase of +0.250 (+0.01%). The chart shows a recent downtrend that appears to be stabilizing near the current level, suggesting a potential reversal point.
Buy Entry: Enter a buy position at 3,312.875 (current price), as it aligns with a support zone where the price has found a base, indicated by the horizontal dashed line and recent consolidation.
Stop Loss: Place a stop loss at 3,295.250, below the recent low, to protect against further downside. This level is approximately 10.625 points below the entry, defining the risk.
Take Profit Levels:
Take Profit 1: 3,317.875, a conservative target about 20.000 points above the entry, aligning with a minor resistance zone.
Take Profit 2: 3,324.750, a mid-range target approximately 31.875 points above the entry.
Take Profit 3: 3,332.500, a deeper target about 45.625 points above the entry, indicating a potential trend reversal.
Price Action: The chart indicates a downtrend with a possible bottoming pattern near the current level. The support zone and upward candlestick suggest a buy opportunity if the price holds.
Risk-Reward Ratio: The distance to the stop loss (10.625 points) compared to the take profit levels (20.000 to 45.625 points) offers a favorable risk-reward ratio, ranging from approximately 1:1.9 to 1:4.3.
Conclusion
Enter a buy at 3,241.875, with a stop loss at 3,295.250 and take profit levels at 3,317.875, 3,324.750, and 3,332.500. Monitor the price action for confirmation of an upward move, and be cautious of a potential continued downtrend if the price breaks below the stop loss level. (Note: I assume "take profot" was a typo for "take profit" and have corrected it accordingly.)
XAUUSD Gold Trading Strategy September 10, 2025XAUUSD Gold Trading Strategy September 10, 2025: Gold stabilized after falling from yesterday's new high, the market will focus on US inflation data in the final period of the week from today.
Fundamental news: Investors will now turn their attention to US inflation data, scheduled for release on Wednesday and Thursday. Inflation data will be of particular interest following weak employment data ahead of the Federal Reserve's monetary policy announcement next week.
Technical analysis: After gold prices made a new all-time high at $3,675/ounce, prices corrected to the 362x area and increased again as we predicted earlier. The MA lines still maintain support for the price, however, yesterday's correction has reduced the previous strong increase. We continue to trade according to the main trend: waiting for a trading point at the support area combined between MA and FVG. In addition, the next profit-taking phase may occur unexpectedly, to avoid this risk we must ensure to maintain the trading principle.
Important price zones today: 3615 - 3620, 3595 - 3600 and 3660 - 3665.
Today's trading trend: BUY.
Recommended orders:
Plan 1: BUY XAUUSD zone 3615 - 3617
SL 3612
TP 3620 - 3630 - 3650 - 3660.
Plan 2: BUY XAUUSD zone 3595 - 3597
SL 3592
TP 3600 - 3610 - 3630 - 3660.
Plan 3: SELL XAUUSD zone 3663 - 3365
SL 3668
TP 3660 - 3650 - 3630 - 3600. (small volume).
Wish you a safe, effective and profitable trading day.💯💯💯💯💯

Gold 1H – Buy the Dip, Watch 3,687 Premium SupplyOn the 1-hour chart, Gold is trading above 3,650 after a clear break of structure. Price has created demand footprints near 3,636 and deeper at 3,594, while resistance is seen around 3,670 and premium supply is at 3,687–3,689. This indicates a possible engineered retracement into discount demand zones before a move towards liquidity above 3,688.
📌 Key Structure & Liquidity Zones (1H):
• 🔼 Buy Zone 3,636 – 3,634 (SL 3,630): Fresh demand block in line with bullish flow.
• 🔼 Buy Zone 3,594 – 3,592 (SL 3,587): Deeper discount demand, strong base for buyers.
• 🔽 Sell Zone 3,687 – 3,689 (SL 3,694): Premium supply zone, possible liquidity sweep.
📊 Trading Ideas (Scenario-Based):
🔺 Buy Setup – Demand Block Reaction
• Entry: 3,636 – 3,634
• Stop Loss: 3,630
• Take Profits:
TP1: 3,650
TP2: 3,665
TP3: 3,680+
👉 Expect retracement into discount demand before price continues bullish.
🔺 Buy Setup – Deeper Demand Test
• Entry: 3,594 – 3,592
• Stop Loss: 3,587
• Take Profits:
TP1: 3,610
TP2: 3,625
TP3: 3,640+
👉 Best for swing buyers seeking higher risk-reward on a deeper liquidity grab.
🔻 Sell Setup – Premium Rejection
• Entry: 3,687 – 3,689
• Stop Loss: 3,694
• Take Profits:
TP1: 3,670
TP2: 3,655
TP3: 3,640
👉 Short-term liquidity grab at premium levels, good only for scalping with strict risk.
🔑 Strategy Note
Overall bias remains bullish, but smart money may push price into 3,636 or even 3,594 demand zones before expanding higher. Safer setups are buying dips; short positions at 3,687 should be treated only as quick scalps.

XAUUSD Gold Trading Strategy September 10, 2025XAUUSD Gold Trading Strategy September 10, 2025: Gold stabilized after falling from yesterday's new high, the market will focus on US inflation data in the final period of the week from today.
Fundamental news: Investors will now turn their attention to US inflation data, scheduled for release on Wednesday and Thursday. Inflation data will be of particular interest following weak employment data ahead of the Federal Reserve's monetary policy announcement next week.
Technical analysis: After gold prices made a new all-time high at $3,675/ounce, prices corrected to the 362x area and increased again as we predicted earlier. The MA lines still maintain support for the price, however, yesterday's correction has reduced the previous strong increase. We continue to trade according to the main trend: waiting for a trading point at the support area combined between MA and FVG. In addition, the next profit-taking phase may occur unexpectedly, to avoid this risk we must ensure to maintain the trading principle.
Important price zones today: 3615 - 3620, 3595 - 3600 and 3660 - 3665.
Today's trading trend: BUY.
Recommended orders:
Plan 1: BUY XAUUSD zone 3615 - 3617
SL 3612
TP 3620 - 3630 - 3650 - 3660.
Plan 2: BUY XAUUSD zone 3595 - 3597
SL 3592
TP 3600 - 3610 - 3630 - 3660.
Plan 3: SELL XAUUSD zone 3663 - 3365
SL 3668
TP 3660 - 3650 - 3630 - 3600. (small volume).
Wish you a safe, effective and profitable trading day.💯💯💯💯💯

Gold Cooling Off After ATH Consolidation or Correction?Gold cooled off a bit after hitting a fresh ATH around 3675, right near the monthly R3 level. This pullback, however, looks more like a healthy breather than any real weakness, since the key 3600 support is still holding strong. Right now, price is taking support around 3620–25, and bulls are doing a good job defending this zone. As long as this area stays intact(H4 close), the higher-high structure remains valid, meaning gold can easily revisit 3650 or even push back toward the highs.
For now, we can say this as a normal pullback within the trend rather than a reversal. To call it a reversal, we need to see a lower high form on the higher timeframes. Until that happens, some sideways consolidation here makes sense, with 3600 being the big level to keep an eye on for any breakdown.

Gold Stretched but Strong Waiting for PullbackGold is moving aggressively and relentlessly, day by day, with no signs of exhaustion. The price has once again printed a fresh all-time high and is now trading around 3650, pushing higher without any meaningful rejection on the daily, weekly, or monthly charts. Momentum remains strong, but the rally is clearly stretched, and chasing buys at these levels looks more like FOMO than a high-probability setup. On the Fibonacci extension, the next major resistance is seen at 3681, which also aligns with the monthly R3 level, making it a critical zone to watch. Buying directly into this resistance is risky, and the better approach is to wait for a healthy pullback before looking for new longs. On the downside, 3600 now acts as immediate support, followed by 3550 as the secondary support level. As long as these supports hold, the broader structure remains bullish, but patience will be key for catching the next move.
Gold 1H – Smart Money Plays Below 3,600Gold on the 1H timeframe is consolidating close to 3,600 after sweeping short-term liquidity. Price is currently forming imbalance around intraday highs, while demand is positioned lower at 3,565. This structure suggests engineered moves designed to trap both buyers and sellers before the next expansion.
________________________________________
📌 Key Structure & Liquidity Zones (1H):
• 🔼 Buy Zone 3,565 – 3,563 (SL 3,560): Discount demand block, aligned with bullish order flow.
• 📍 Scalp Sell Zone 3,594 – 3,596 (SL 3,601): Intraday rejection pocket; scalp opportunity.
• 🔽 Sell Zone 3,630 – 3,628 (SL 3,637): Premium supply zone, suitable for liquidity sweep reaction.
________________________________________
📊 Trading Ideas (Scenario-Based):
🔺 Buy Setup – Demand Block Reaction
• Entry: 3,565 – 3,563
• Stop Loss: 3,560
• Take Profits:
o TP1: 3,585
o TP2: 3,595
o TP3: 3,600+
👉 Expectation is for liquidity sweep into discount demand before resuming bullish trend.
🔻 Sell Scalp Setup – Intraday Reaction
• Entry: 3,594 – 3,596
• Stop Loss: 3,601
• Take Profits:
o TP1: 3,592
o TP2: 3,590
o TP3: 3,585 → 3,580 → 3,570 → 3,560
👉 Short-term liquidity pocket; scalp trades only with strict risk control.
🔻 Sell Setup – Premium Rejection
• Entry: 3,630 – 3,628
• Stop Loss: 3,637
• Take Profits:
o TP1: 3,610
o TP2: 3,600
o TP3: 3,590
👉 Targeting liquidity lying below intraday lows; best for quick short opportunities.
________________________________________
🔑 Strategy Note
Overall bias remains bullish, but smart money may engineer a sweep of 3,626–3,630 supply before driving price back into 3,565 demand. Cleaner setup is to buy dips, while sell scalps are short-lived opportunities.
