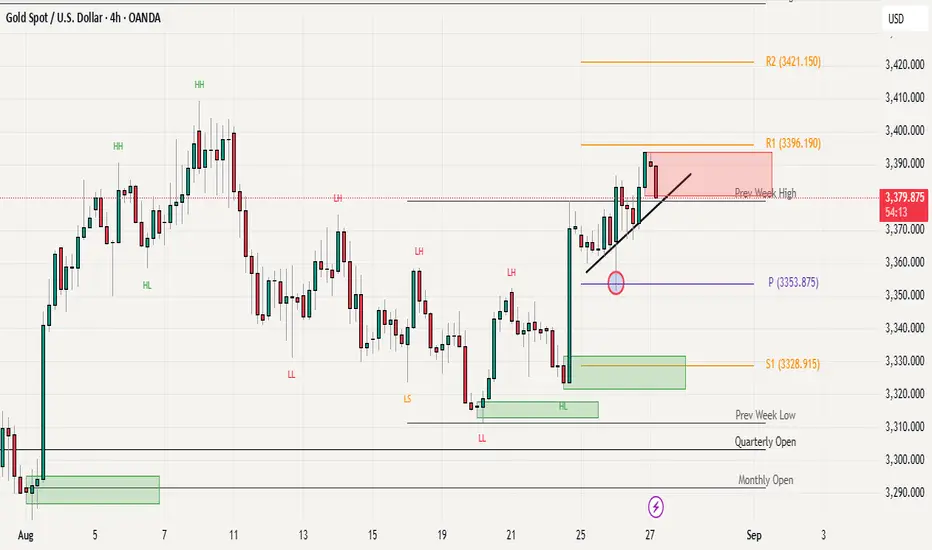
Gold Holds Trendline All Eyes on 3400 & GDP DataGold continues to move higher , on H4 we can see that price respecting the rising trendline support that has been guiding the move since last week’s breakout. Yesterday, bulls made an attempt to push through the 3400 level, but failed to sustain above it, confirming this zone as the immediate resistance for now. On the downside, supports remain unchanged first at the previous week high (3378), followed by the weekly pivot (3353).
For today, the key focus will be on the GDP data release, which could trigger volatility and provide the needed catalyst for gold to either break above 3400–3410 resistance or slide back towards its support zones. Until then, price action suggests a slow but steady bullish bias, with sellers only likely to gain momentum if the trendline breaks decisively.
Gold

XAUUSD Gold Trading Strategy August 27, 2025XAUUSD Gold Trading Strategy August 27, 2025: Gold prices remain in the rising price channel, trading opportunities for investors.
Basic news: CB Consumer Confidence Report (August) is 97.4, higher than the forecast of 96.4 but lower than last month's 98.7. News that President Trump decided to remove Federal Reserve Governor Lisa Cook still has a strong impact on the US Dollar, creating upward momentum for gold.
Technical analysis: Gold prices continue to fluctuate in the rising price channel, however, after approaching the 3395 area, gold prices are currently adjusting. MA lines, liquidity zones combined with Fib frames and price channels are still supporting the upward momentum for gold prices. We continue to wait for transactions in these support areas. There is a high possibility that spot gold prices will approach the 3410 - 3420 area and continue to be held.
Important price zones today: 3358 - 3363 and 3347 - 3352.
Today's trading trend: BUY.
Recommended orders:
Plan 1: BUY XAUUSD zone 3358 - 3360
SL 3355
TP 3363 - 3373 - 3393 - 3410.
Plan 2: BUY XAUUSD zone 3347 - 3349
SL 3344
TP 3352 - 3362 - 3382 - 3400.
Plan 3: SELL XAUUSD zone 3418 - 3420
SL 3423
TP 3415 - 3405 - 3395 - 3380 (small volume).
Wish you a safe, effective and profitable trading day.🥰🥰🥰🥰🥰

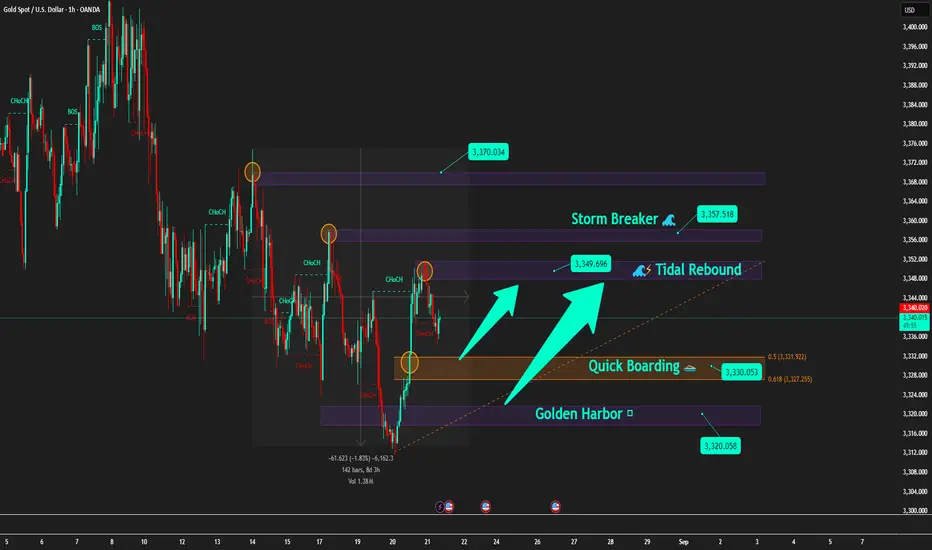
Gold Plan 27/08 – Captain Vincent (IN)XAU/USD – Trump strengthens control over the FED, Gold consolidates near Storm Breaker
1. News Wave 🌍
Trump: “We will soon have majority control at the FED. Miran may be moved to another position with a longer term.”
Trump: “I already have a candidate in mind to replace FED Governor L. Cook.”
US Senate: Preparing hearings next week for Trump’s nominee – S. Miran .
👉 Message: Trump is consolidating power within the FED. Market fears FED losing independence → USD volatility rises, Gold benefits from safe-haven flows .
2. Technical Outlook ⚙️
Gold is approaching Storm Breaker 🌊 (3400 – 3402) , overlapping with resistance 3392 – 3406 → profit-taking likely .
On H1, multiple FVGs remain unfilled around 3355 & 3330 → Price may correct to retest these supports before choosing direction.
Intraday bias: Range-bound → Sell at resistance, short Buy at supports.
3. Captain Vincent’s Map – Key Levels 🪙
Resistance (Kháng cự):
3406 – 3400 – 3392 (Storm Breaker 🌊)
Support (Hỗ trợ):
3372 (Minor Shield 🛡️)
3355 (Quick Boarding 🚤 – Buy Scalp Zone)
3344 (Intermediate Shield 🛡️)
3330 (Golden Harbor 🏝️ – Main Buy Zone)
4. Trade Scenarios 📌
🔻 SELL at Storm Breaker 🌊 (Priority)
Entry: 3400 – 3402
SL: 3408
TP: 3395 → 3393 → 3389 → 3386 → 33xx
🚤 BUY Scalp – Quick Boarding
Entry: 3353 – 3355
SL: 3345
TP: 3358 → 3361 → 3363 → 33xx
🏝️ BUY at Golden Harbor (Strong Support)
Entry: 3330 – 3332
SL: 3325
TP: 3335 → 3338 → 3341 → 33xx
5. Captain’s Note ⚓
"Gold today faces Storm Breaker 🌊 above, but multiple shields of support remain below. Smart traders will scalp quickly at Quick Boarding 🚤, or patiently wait for Golden Harbor 🏝️ to anchor safely."

Weekly High Turns Support: Can Gold Push Higher?We have seen a good momentum / continuation since Friday’s sharp rally and is now holding firm above the previous week’s high at 3378, turning it into immediate support. The weekly pivot at 3353 adds another solid support layer below, while the rising trendline support is keeping the bullish structure intact. As long as these levels hold, buyers seem in control, and the price action suggests that bulls are not ready to give up recent gains.
On the upside, the next hurdle is around the 3400–3410 zone, which could act as near-term resistance. For sellers, any breakdown below the pivot (3353) would be a high-probability setup for downside pressure, while a break below the trendline would be a lower-probability but still valid bearish signal. Until then, the path of least resistance remains tilted to the upside with steady bullish momentum.
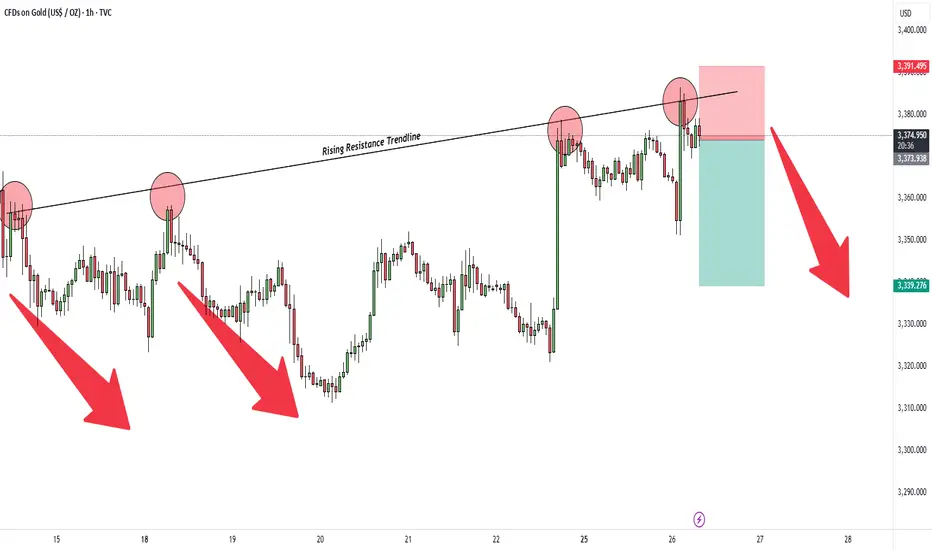
Gold – Rejection from Trendline ResistanceHello everyone, Gold faced rejection from the ascending trendline resistance and formed a bearish setup. A short position has been taken with stop above the recent swing high and target near 3339 support zone.
Key Points:
Trendline Resistance: Price failed to sustain above the trendline.
Risk Management: Stop placed above 3391 to protect against false breakouts.
Target Zone: First support lies near 3339 where price may react.
Disclaimer: This analysis is for educational purposes only, not financial advice.
XAUUSD Gold Trading Strategy August 26, 2025XAUUSD Gold Trading Strategy August 26, 2025:
Gold surged after Trump's move, initial short-term bullish technical conditions in the trend of accumulation status.
Basic news: Gold surged after Trump's move, US President Donald Trump decided to remove Federal Reserve Governor Lisa Cook due to allegations that she falsified mortgage documents. This news affected the US Dollar index to fall sharply at the beginning of today's Asian trading session, while spot gold prices increased by nearly 35 USD.
Technical analysis: Gold prices returned to the support area of 3345 - 3350 after increasing sharply as previously predicted. The rising price channel on the H1 frame has been formed, currently the MA lines and liquidity zones are still supporting the increase in gold prices. In addition, the Fib frames are still effective trading areas. Gold prices may approach the area of 3410 - 3420 this week.
Important price zones today: 3353 - 3358 and 3340 - 3345.
Today's trading trend: BUY.
Recommended orders:
Plan 1: BUY XAUUSD zone 3353 - 3355
SL 3350
TP 3358 - 3368 - 3388 - 3410.
Plan 2: BUY XAUUSD zone 3340 - 3342
SL 3338
TP 3345 - 3355 - 3375 - 3400.
Plan 3: SELL XAUUSD zone 3420 - 3422
SL 3425
TP 3417 - 3410 - 3400 - 3390 (small volume).
Wish you a safe, successful and profitable trading day.🥰🥰🥰🥰🥰

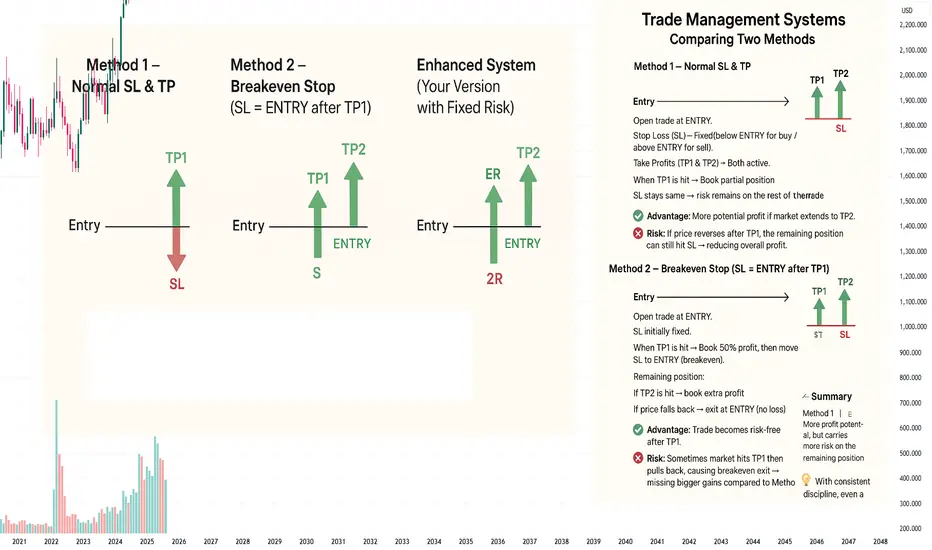
Trade Management Systems: Comparing Two Methods
📌 Method 1 – Normal SL & TP
Entry → Open trade at ENTRY.
Stop Loss (SL) → Fixed (below ENTRY for buy / above ENTRY for sell).
Take Profits (TP1 & TP2) → Both active.
When TP1 is hit → Book partial position.
SL stays the same → risk remains on the rest of the trade.
✅ Advantage:
More potential profit if market extends to TP2.
❌ Risk:
If price reverses after TP1, the remaining position can still hit SL → reducing overall profit.
📌 Method 2 – Breakeven Stop (SL = ENTRY after TP1)
Entry → Open trade at ENTRY.
SL initially fixed.
When TP1 is hit → Book 50% profit, then move SL to ENTRY (breakeven).
Remaining position:
If TP2 is hit → book extra profit.
If price falls back → exit at ENTRY (no loss).
✅ Advantage:
Trade becomes risk-free after TP1.
❌ Risk:
Sometimes market hits TP1 then pulls back, causing breakeven exit → missing bigger gains compared to Method 1.
📌 Enhanced System (Your Version with Fixed Risk)
Initial SL → Always set at 2R.
TP1 → When reached, book 50% profit (+1R on half).
Then move SL to ENTRY (breakeven) for the remaining 50%.
📊 Possible Outcomes:
Scenario Result
Price hits SL (before TP1) –2R loss
Price hits TP1, then reverses to ENTRY +0.5R profit
Price hits TP1, then TP2 +2R total profit
⚖️ Summary
Method 1 (Normal SL & TP) → More profit potential, but carries more risk on the remaining position.
Method 2 (SL = ENTRY after TP1) → Safer, risk-free after TP1, but sometimes cuts off bigger gains.
Your Enhanced Version → A defensive system:
Losers are limited (–2R).
Small winners (+0.5R) happen often.
Big winners (+2R) balance out losses.
💡 With consistent discipline, even a 40–45% win rate can make this system profitable.
Gold Plan 26/08 – Captain VincentXAU/USD – Trump’s surprise move sparks a Gold rally. What’s the next scenario?
1. News Wave 🌍
Trump unexpectedly dismissed FED Governor L. Cook , citing “irresponsible recent financial decisions.”
👉 A political–monetary shock that pushed Gold up by more than 30 points from the 3,350 – 3,352 zone, as investors feared internal instability at the FED could weaken the USD.
Safe-haven demand has been activated, but Gold is unlikely to “fly in a straight line.” The market often requires a pullback to fill liquidity gaps before a clear trend develops.
2. Technical Outlook ⚙️
Price bounced sharply from Golden Harbor 🏝️ (Buy Zone 3350 – 3342) – a key support area.
Currently, Gold is testing Storm Breaker 🌊 (Resistance 3384 – 3400) , a liquidity cluster → potential for profit-taking sell orders.
On H1, multiple FVGs formed around 3363 and 3355 → price may retrace to “fill the gap” before continuing.
👉 Intraday bias: Prioritise Sell at resistance, but watch for short Buy Scalp setups at Quick Boarding 🚤 (3342 – 3340) .
3. Captain Vincent’s Map – Key Levels 🪙
Storm Breaker 🌊 (Main Resistance): 3384 – 3400
Quick Boarding 🚤 (Buy Scalp): 3342 – 3340 | SL 3333 | TP: 3345 → 3347 → 3350 → 33xx
Golden Harbor 🏝️ (Buy Zone): 3350 – 3342
FVG Zones: Around 3363 & 3355 (short-term price magnets)
4. Trade Scenarios 📌
🔻 SELL at Storm Breaker 🌊 (Priority)
Entry: 3400 – 3402
SL: 3408
TP: 3395 → 3390 → 33xx
🔺 BUY Scalp – Quick Boarding 🚤
Entry: 3342 – 3340
SL: 3333
TP: 3345 → 3347 → 3350 → 33xx
5. Captain’s Note ⚓
"Trump’s news wave pushed Gold like an unexpected headwind. But Storm Breaker 🌊 ahead may unleash rough seas. The wise will anchor at Golden Harbor 🏝️ , while the bold may ride Quick Boarding 🚤 for fast scalps. And remember: today’s golden sea depends on the sharks at the helm."

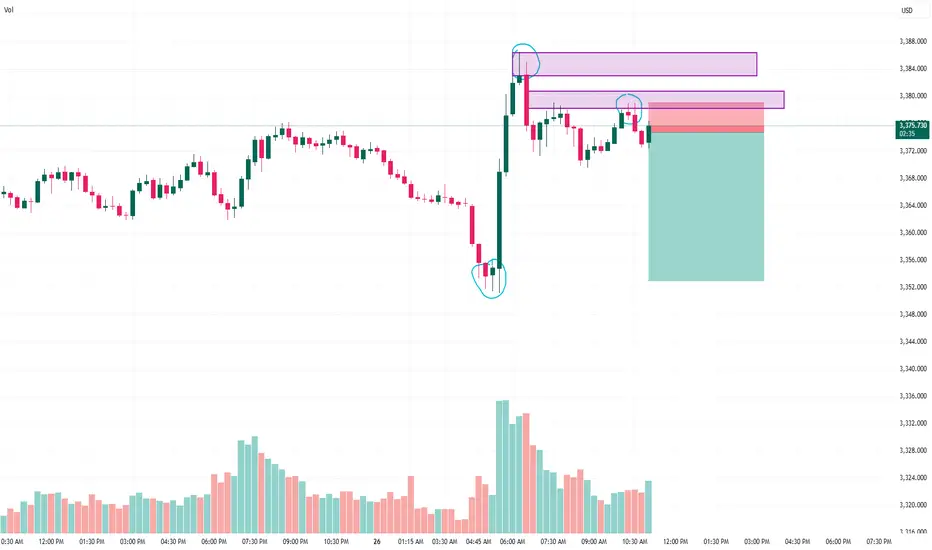
GOLD sell setup Gold (XAUUSD) – Short Trade Idea
🔑 Key Observations:
Strong Rejection Zone:
Price faced rejection at the previous high (highlighted in purple supply zone).
Multiple attempts to break above failed, confirming seller presence.
Volume Confirmation:
The sharp bullish push from the bottom was met with equally strong selling pressure at the top.
Volume spikes indicate distribution at higher levels.
Market Structure:
Clear lower high formation after rejection.
Entry aligns with a retracement into the supply zone.
📊 Trade Setup:
Entry: Short near supply zone (around 3374–3379).
Stop-Loss: Above recent swing high (3380 area).
Target: 3356 level (previous demand zone).
Risk/Reward Ratio: ~1:5 (high probability setup).
⚠️ Risk Management:
Always use a stop-loss to protect capital.
Consider trailing stop-loss once trade moves in favor, to lock in profits.
If price breaks and closes above supply, setup becomes invalid.
Gold SMC Playbook 25/08 – Liquidity Hunt at 3400 & 3325Market Context (SMC Perspective)
Price is consolidating near 3367 after a strong impulsive move upward and is currently reacting around a minor resistance area.
Clear ChoCH and BOS patterns indicate bullish intent on the H1 timeframe; however, liquidity pools still lie below 3343 and 3325 (buy-side liquidity).
Imbalance zones spotted: 3343–3341 and a deeper order block zone around 3325–3323.
Key Levels
Resistance (Supply): 3372 – 3382 – 3389
Support (Demand): 3350 – 3342 – 3325
SMC Bias: Mixed – Opportunities to Play Both Long & Short Around Liquidity
🔴 SELL Scenario (Short-Term Liquidity Grab)
Entry: 3400 – 3403 (above local liquidity sweep)
Stop Loss: 3408
Targets:
TP1: 3390 (partial)
TP2: 3380
TP3: 3370
TP4: 3360 (opens 3350 liquidity zone)
Rationale: Expecting a sweep above 3400 into supply, followed by mitigation and a sell-off.
🟢 BUY Scenario (Bullish Continuation from Demand OB)
Entry 1 (Scalp Buy): 3343 – 3341 (reactive zone), SL 3337
Entry 2 (Main OB): 3325 – 3323 (strong OB), SL 3319
Targets:
TP1: 3330
TP2: 3340
TP3: 3350
TP4: 3370 (opens 3390 liquidity)
Rationale: Price may retrace below 3340 to fill imbalance and mitigate the 3325 OB before the next bullish leg.
Execution Plan (SMC Flow):
Wait for a liquidity sweep at highs or lows (above 3400 or below 3325) with proper confirmation.
Look for ChoCH and BOS signals on LTF (M5–M15) around OB zones for entry confirmation.
Trail stop loss after TP1 is hit; take partial profits and hold the remaining position toward the final liquidity target.

XAUUSD Gold Trading Strategy August 25, 2025XAUUSD Gold Trading Strategy August 25, 2025:
The market revolved around the FED and Trump, gold rose at the end of last week and was limited by the 0.236% Fib level.
Fundamental news: Mr. Powell's unexpectedly dovish remarks reinforced the market's hopes for a rate cut in September. As a result, the US Dollar Index fell sharply on Friday, reversing the upward trend of the first 4 trading days of the week. Moreover, the strong increase on Friday also pushed the gold price to skyrocket nearly 36 USD during the week.
Technical analysis: After a strong increase when it had compressed enough force in the bullish pattern and broke the downtrend channel on the H1 frame, the gold price at the beginning of this week's trading session is having a correction phase. The uptrend of gold is still maintained. The liquidity zones combined with FIB support and MA lines will now be our trading area. The gold price is very likely to return to the old ATH zone of 3500 this week.
Important price zones today: 3345 - 3350 and 3330 - 3335.
Today's trading trend: BUY.
Recommended orders:
Plan 1: BUY XAUUSD zone 3345 - 3347
SL 3342
TP 3350 - 3360 - 3370 - 3390.
Plan 2: BUY XAUUSD zone 3330 - 3332
SL 3327
TP 3335 - 3345 - 3355 - 3390.
Wish you a safe, successful and profitable trading week.🌟🌟🌟🌟🌟

Gold preparing for correction under FED & geopolitic - Vincent🟡 Gold Plan 25/08 – Captain Vincent ⚓
1. Market Context 🌍
Russia – Ukraine: Trump puts pressure on Putin to negotiate within 2 weeks. This looks positive for peace, but also carries escalation risks → Gold keeps its safe-haven role .
FED – Powell at Jackson Hole: Hawkish tone reduced expectations of a September rate cut from 3 to 2. USD strengthened → short-term downside pressure on Gold .
👉 Mix of political support vs FED pressure → Sideways market, Gold may need a pullback to absorb liquidity before showing clear direction.
2. Technical Outlook ⚙️
H4 candle closed bearish → Buying momentum weakens , sellers may return.
Recent FVG created after sharp bounce → Likely pullback for liquidity grab .
Bias of the day: Prioritise Sell, but short Buy Scalp setups possible at support.
3. Key Levels – Captain Vincent’s Map 🪙
Resistance:
Storm Breaker 🌊 (Sell Zone 3398 – 3400)
3376 (intermediate resistance – watch reaction)
Support:
Quick Boarding 🚤 (Buy Scalp 3340 – 3342)
SL: 3333
TP: 3345 → 3349 → 3353 → 3357 → 33xx
Golden Harbor 🏝️ (Buy Zone 3328 – 3326)
SL: 3318
TP: 3332 → 3336 → 3339 → 33xx
Higher Low – 3323
Anchor point of the trend → If broken, need to reassess all Buy setups.
4. Trade Scenarios 📌
🔻 Sell at Storm Breaker 🌊
Entry: 3398 – 3400
SL: 3408
TP: 3395 → 3390 → 3387 → 3384 → 33xx
🚤 Buy Scalp at Quick Boarding
Entry: 3340 – 3342
SL: 3333
TP: 3345 → 3349 → 3353 → 3357 → 33xx
🏝️ Buy at Golden Harbor (3328 – 3326)
SL: 3318
TP: 3332 → 3336 → 3339 → 33xx
5. Captain’s Note ⚓
"Today, the golden sea is full of undercurrents: FED winds blow against, politics push along. Those who pick Storm Breaker 🌊 may ride the wave safely; those who patiently wait at Golden Harbor 🏝️ will find peace. Quick Boarding 🚤 is for sailors seeking fast scalps in narrow waters."

Gold Plan 22/08 – Captain Vincent ( IN )Background
On the H1 timeframe , Gold continues to move sideways within the 3328 – 3350 range, sweeping liquidity again and again, making it difficult for retail traders to spot a clear trend.
Currently, Gold has absorbed almost all liquidity from the Nonfarm FVG .
Therefore, the next price action will largely depend on smart money moves and upcoming news catalysts .
Even though the overall trend is still unclear, we can still build trading setups around these key levels .
🪙 Key Levels
🔹 Storm Breaker 🌊 (Sell Zone 3368 – 3370)
SL: 3376
TP: 3365 → 3360 → 3355 → 3350 → 33xx
🔹 Golden Harbor 🏝️ (Buy Zone 3313 – 3315)
SL: 3305
TP: 3320 → 3325 → 3330 → 33xx
📌 Trading Outlook
On higher timeframes, sellers still hold the advantage .
However, Gold may need to test resistance zones again to confirm.
If price reaches Storm Breaker 🌊 → Watch for reaction and prepare to Sell.
If price drops to Golden Harbor 🏝️ → Strong support remains for short-term Buy opportunities.
⚓ Captain Vincent’s Note
"When the sharks sweep the waves, retail traders panic. But those holding the key level map will always know where the safe harbor lies."

Gold ....Powell Speech to Break the Range?Gold held steady after yesterday’s pullback, but the 3350 zone continues to act as a strong resistance. Despite multiple bullish attempts, price has failed to break through this ceiling, keeping the upside capped. On the lower side, immediate support stands at the previous weekly low (3330), followed by the recent swing low near 3310. These levels are key for buyers to defend.
For now, price action has compressed further into a tight range, and there hasn’t been any major development since the last session. With Powell speech lined up today, the market is likely to stay cautious and range-bound until then. Once the event is out, we could see a clearer short-term direction, either a breakout above 3350 opening room for recovery, or a breakdown below 3310 tilting bias back in favor of sellers.

Gold after FOMC: Just a pullback or the start of a new wave?[Background
After the early morning FOMC session , Gold is showing signs of a sell-side pullback to gain momentum.
On higher timeframes (H4–D1), the structure remains bearish with lower highs .
However, consistent buying pressure around 3320 – 3330 keeps this zone as the key battlefield .
🪙 Key Levels Today
🔹 Storm Breaker 🌊 (Sell Zone 3357 – 3355)
SL: 3362
TP: 3350 → 3345 → 3340 → 33xx
🔹 Tidal Rebound 🌊⚡ (Sell Scalp 3349 – 3347)
SL: 3353
TP: 3345 → 3340 → 3335 → 33xx
🔹 Quick Boarding 🚤 (Buy Scalp 3330 – 3328)
SL: 3322
TP: 3335 → 3337 → 3339 → 3341
🔹 Golden Harbor 🏝️ (Buy Zone 3320)
SL: 3313
TP: 3325 → 3330 → extend further
📌 Trading Scenarios
After FOMC, the market may show rebound waves .
During Asia–Europe, price may consolidate between 3345 – 3357 .
If price tests Storm Breaker 🌊 → Prioritise Sell setups in line with the main bearish trend.
If price drops to Quick Boarding 🚤 or Golden Harbor 🏝️ → Short-term Buy scalps on pullback moves.
📰 Market Context
FED remains dovish leaning , with high probability of a rate cut in September (~82%, CME FedWatch) .
Geopolitical variables (Trump–Putin, Ukraine) remain unpredictable and may spark sudden volatility.
⚓ Captain’s Note
"Let Storm Breaker 🌊 test the buyers’ strength. Those who board at Golden Harbor 🏝️ will be lifted by the waves, but those who drift into the storm will soon feel the sea’s fury."
GOLD PLAN – Captain Vincent🏴☠️ GOLD PLAN – Captain Vincent ⚓
Background
After the Nonfarm payrolls, Gold created a Captain’s Liquidity Void (large imbalance zone). Price has now almost completely filled this gap.
On higher timeframes, Gold still maintains a Lower High – Lower Low structure, confirming that sellers remain in control .
However, during the Asian & European sessions, we usually see technical pullbacks to collect liquidity – those moves will be our chance to enter in line with the main direction.
📍 Key Levels for Today
🔹 Captain’s Trap Zone (3330 – 3332)
Confluence of Fibo 0.5 – 0.618 and trendline breakout.
Main SELL setup at this zone.
SL: 3336 – 3338
TP: 3325 → 3320 → 3315 → 33xx
🔹 Captain’s Quick Shot (3313)
Nonfarm breakout zone , heavy SELL volume.
Suitable for short BUY scalp if price reacts strongly.
SL: 3308
TP: 3318 → 3322 → 3326
🔹 Captain’s Safe Harbor (3300 – 3302)
Start of previous bullish leg, strongest support of the day .
If Quick Shot breaks, this becomes the main BUY accumulation zone .
SL: 3293
TP: 3305 → 3310 → 3315 → 33xx
🔹 Captain’s Shield (3313)
If held multiple times → becomes a short-term key support .
⚡ Trading Scenarios
Sell Priority : Short at Captain’s Trap Zone.
Quick Buy : Scalp around Captain’s Quick Shot if sharp reaction.
Breakdown : If 3313 fails → Buy at Safe Harbor (3300 – 3302).
📌 Captain’s Reminder
SELL bias is still dominant → Do not FOMO buy without clear signals.
The US session may bring high volatility from geopolitical headlines. Manage your capital with discipline.

Gold Faces Resistance, Buyers Should Stay Alert near Key SupportGold Futures (MCX) Analysis: Key Points to Watch
Current Price Range: Gold Futures are trading around ₹98,700 to ₹98,750.
Resistance Zone: Gold has been repeatedly rejected near its high around ₹101,500, showing strong selling pressure at this level.
Trendline Broken: Recently, gold broke an important upward trendline that had acted as a reliable bounce-back support.
Key Support Emerging: After this break, a key support level has appeared around ₹97,700 to ₹97,750. This zone will be important to watch for potential price stabilization.
Additional Support Levels: The chart also highlights other support zones that could provide buying interest if prices decline further.
Trader Outlook: Buyers need to remain cautious and vigilant at these levels. The market shows signs of short-term weakness, and how gold behaves around these supports will be crucial for the next move.
Gold is at a critical juncture where it faces both selling pressure and key supports. Watching the reaction around ₹97,700-₹97,750 will help gauge whether bulls regain control or further correction unfolds. Stay alert and manage risk carefully.

XAUUSD Gold Trading Strategy August 19, 2025XAUUSD Gold Trading Strategy August 19, 2025:
Gold's range remains narrow, closely monitoring the progress of ceasefire negotiations in Ukraine.
Basic news: Yesterday, August 18, according to Rueter, US President Donald Trump told Ukrainian President Zelenskiy that the United States will support Ukraine's security in any agreement to end Russia's war in Ukraine. Gold reacted quite mildly when no message of real weight was released, and market sentiment was still very hesitant, currently spot gold is trading around $3,335/oz, equivalent to an increase of about $2 on the day.
Technical analysis: Yesterday's bullish pattern of gold is still maintained when gold prices approach our Plan 1 area and increase again. However, the increase is not strong, it is very likely that today the gold price will still maintain a slight fluctuation in the area of 3325 - 3350. When the gold price breaks the pattern, it will fluctuate very strongly, we will continue to wait to buy mainly in the area around 3300.
Important price zones today: 3325 - 3330, 3300 - 3305 and 3345 - 3350.
Today's trading trend: BUY.
Recommended orders:
Plan 1: BUY XAUUSD zone 3328 - 3330
SL 3325
TP 3333 - 3340 - 3360 - 3390.
Plan 2: BUY XAUUSD zone 3300 - 3302
SL 3297
TP 3305 - 3315 - 3335 - 3370.
Plan 3: SELL STOP XAUUSD zone 3320 - 3322
SL 3325
TP 3317 - 3307 - 3300.
Wish you a safe, successful and profitable trading day.🌟🌟🌟🌟🌟

Gold Outlook – Buying as the Main ThemeGold Outlook – Buying as the Main Theme
Gold continues to move in line with previous analyses. Earlier today in the Asian session, the market saw a quick dip due to liquidity being cleared during the daily one-hour break. However, price quickly recovered, broke through the 3339 resistance, and confirmed that buying momentum has returned, strengthening the short-term bullish trend.
Expectations for a new Elliott wave cycle are gradually taking shape. At this point, wave 3 is considered to have begun — typically the strongest phase with greater momentum and wider price swings. This supports the scenario of a medium-term bullish outlook.
Price remains above the key EMA levels, confirming that the long-term trend is intact. The breakout above 3339 reinforces buyer strength and opens the way towards Fibonacci extension targets at 2.618 and 3.618. MACD also maintains positive momentum, while Elliott structure suggests that wave 3 still has room to extend further.
As long as gold holds above the 3336–3338 zone, this remains a reasonable area to consider buying. A minor pullback around this level would offer an even better opportunity to join the trend, with a stop-loss of about 6 dollars to manage risk effectively.
When price approaches Fibonacci extension targets, traders may consider partial profit-taking or look for short-term selling opportunities. This approach will be suitable given how far wave 3 has already extended.
It is important to monitor price reactions around the extension zones. Higher timeframes such as H1–H4 should be prioritised to capture the broader structure and avoid market noise.
A strong trend never moves in a straight line; it always comes with pauses and retracements. Staying patient and riding with the main trend is often the best way to maximise profits in the medium term.
#XAUUSD #Gold #TechnicalAnalysis #PriceAction #Fibonacci #ElliottWave #MACD #Forex #IndiaTrading

Gold Update: Range Trading with Bearish UndertoneAfter last week decline,gold has entered a consolidation phase within a well-defined range. The current support is at around 3330, which coincides with last week's low and also serves as the monthly pivot point, providing a strong foundation for short term. On the upside, resistance is at 3350-3355, which aligns with the current week's pivot level, creating a ceiling that sellers are defending.
The price action within this tight range suggests that market participants are taking a breather after the recent selling pressure, with both bulls and bears showing restraint as they assess the next move. The way gold is trading within these boundaries gives the impression that energy is building up, much like a coiled spring ready to release. This type of consolidation pattern often precedes a significant directional move, as market forces accumulate before choosing their next path.
The technical setup indicates that we're likely approaching a critical range where gold will need to make a decisive break either above or below this range. A breakout above the 3350-3355 resistance zone could signal renewed bullish momentum and attract fresh buying interest, while a breakdown below the 3330 support level might open the door for further downside pressure.Looking at the weekly and daily price action, the bears seem to have the upper hand in the current scenario. The recent decline from higher levels has created a bearish tone, and importantly, we haven't seen any major reversal signals that would suggest a strong buying opportunity at these current range levels

Red CHoCH Confirms the Bears – Sell at Premium Zone📌 Gold Plan – M30 Timeframe | Captain Vincent ⚓
Background
On the D1 chart, the candle closed lower, showing bearish pressure still dominates.
On H4, the bearish structure continues.
However, Gold is currently stuck around 3345/oz, unable to make a clear breakout.
The 3323 – 3335 zone remains strong support – a level where Vincent has bought multiple times before with solid profits. But with the current structure, today’s priority will be Sell in line with the main trend.
Sell Zone – Premium 🎯
Entry: 3345 – 3347
SL: 3352
TP: 3340 → 3335 → 3330 → 33xx
SMC Note (CHoCH 🔴)
On the M30 timeframe, a recent red CHoCH has appeared – a signal confirming that sellers have regained control.
This strengthens the case for selling at upper resistance zones.
Today’s Scenarios
If price holds below 3345 – 3347 → Prioritise short setups, selling in line with the downtrend.
If price breaks below current support → High chance the market will move to fill the previous FVG. In that case, wait for a Breakout Down retest to enter safer.
Consider entering one small probe trade first, then go in stronger once a reversal candle confirmation appears.
Resistance to watch: 3337 – 3345
Support to watch: 3323 – 3335
⚠️ Captain’s Note:
"SMC structure with a red CHoCH has confirmed that the bears are steering the market. We will flow with the main current – Sell at the Premium Zone – but always with discipline, waiting for clear confirmation before taking action."

Gold - Bearish ? Double Top with RSI DivergenceGold was bullish only due to empty words from Trump saying no gold in US, its missing, no one audited for 40 years, no doors and no windows in the store house etc etc. He never took efforts to go and check it or ask for audit report. so in my view its empty words from Trump. It must have helped Russia to offload its tons and tons of Gold accumulated long before the war, Thats the biggest gift Trump given to Putin to book profits in Gold. It has formed double top with clear Bearish Divergence in RSI. In my view its a Sell now and many be buy at lower levels later. No war, no covid and why any one hold Gold at these very high price ?
