Trade Recommendation – BUY WTI Crude Oil (USOIL) – Entry #2✅ Trade Recommendation – BUY WTI Crude Oil (USOIL) – Entry #2
📅 Date: July 3–4, 2025
🕒 Timeframe: 1H
🎯 Trade Setup:
Entry Zone: 66.30 – 66.40 USD/barrel (short-term support and EMA20 zone)
Stop Loss (SL): 65.60 USD (below MA200 and previous bullish candle base)
Take Profit (TP):
• Target: 68.40 – 68.50 USD
📊 Technical Analysis:
Healthy pullback after a strong bullish breakout — price is currently consolidating around EMA20, potentially forming a new upward leg.
Volume surged during the July 2–3 breakout, indicating strong institutional buying interest.
Price structure: Clear uptrend with higher highs and higher lows.
Bollinger Bands: Price touched the upper band and is now retracing to the mid-band — a common continuation pattern.
EMA20 is acting as dynamic support.
🧭 Strategy Notes:
Wait for price to retrace into the 66.30 – 66.40 zone with a confirmation signal (e.g. bullish pin bar or engulfing candle).
Consider scaling in and holding the position toward the resistance area of 68.40 – 68.50.
Cut loss if price breaks below 65.60 and invalidates the current bullish structure.
fl me & ytb, winrate 90%! Thank
Gold

Will Gold Break Higher Ahead of US Jobs Data?Hello traders, what’s your take—will gold rise or fall today?
So far, the precious metal remains quiet, hovering around $3,345 without much movement since yesterday.
According to the CME FedWatch Tool, although the probability is still low, expectations are rising that the Federal Reserve might cut interest rates later this month. That’s a strong supportive factor for gold in the near term.
Technically, the next bullish target is a confirmed daily close above the key resistance level at $3,400.
On the news front, Thursday marks the most important data release of the month for the US—the June Non-Farm Payrolls (NFP) report, released a day early due to the Independence Day holiday. The market is expecting an increase of 110,000 jobs, down from 139,000 in May.
This release could be a gold mover: If the actual number is weaker than expected, it would likely reinforce Fed rate cut expectations—giving gold a bullish push.

Gold price recovered break 3340, price increasedPlan XAU day: 02 July 2025
Related Information:!!!
Gold Demand in China Expected to Rise Further
"Gold prices (XAU/USD) fluctuated between modest gains and slight losses during the first half of the European session on Wednesday, remaining below the one-week high reached the previous day. The US Dollar has regained some positive momentum, appearing to break a seven-day losing streak that had brought it to its lowest level since February 2022. This renewed strength in the greenback is acting as a headwind for the precious metal. Additionally, a broadly positive risk sentiment in the market is seen as another factor limiting the upside potential for the safe-haven asset.
personal opinion:!!!
Gold price continues to recover after breaking the 3340 price zone, buying power maintained before ADP-NF news today
Important price zone to consider : !!!
SELL point: 3366 zone
Sustainable trading to beat the market

Strong Bullish Momentum or a Short-Term Setback?XAUUSD Analysis – 02/07: Strong Bullish Momentum or a Short-Term Setback?
Gold has made a strong recovery after a brief period of consolidation last month, and it continues to show signs of strong bullish momentum. The price has been fluctuating, yet the overall trend remains positive. Let’s dive into the technical setup for today’s trading session.
📊 Market Overview:
Recent Price Action: After confirming a bullish reversal on the H1 timeframe earlier this week, Gold has surged significantly. Yesterday, it reached 3358, completing wave 3 of an Elliott structure on the M30 chart, followed by a slight correction during the US and Asian sessions.
Short-Term Correction: Wave 4 is currently underway, and there are two potential outcomes for this correction:
It could find support at 3328-3330, leading to a continuation of the bullish trend.
Alternatively, it may dip further to the 330x range before resuming the uptrend.
🧭 Key Levels to Watch:
Support: 3328 – 3313 – 3304 – 3294
Resistance: 3344 – 3360 – 3368 – 3388
🧠 Trading Strategy for Today:
Buy Scenario:
Watch for a potential bounce around the 3328-3330 range. If this area holds, we can look for buying opportunities with a target towards 3358 and 3360.
If the price breaks through the 3340 level, consider entering long positions and setting targets around 3350-3360.
Sell Scenario:
Sell Near Resistance: A quick scalping opportunity could arise near the 3388-3390 resistance zone. Tight SL and reasonable TP at 3384-3380 are the targets to aim for.
For a longer-term Sell position, wait for a clearer breakdown below 3370 to target deeper levels like 3360.
🎯 Trading Plan for Today:
BUY ZONE:
Entry: 3306 – 3304
SL: 3300
TP: 3310 → 3315 → 3320 → 3325 → 3330 → 3340
SELL ZONE:
Entry: 3388 – 3390
SL: 3394
TP: 3384 → 3380 → 3376 → 3370 → 3365 → 3360 → 3350
⚡️ Key Considerations:
The US macroeconomic data release and potential volatility from ADP NonFarm Payrolls today could provide significant movement, so stay alert and monitor the data closely.
In Summary:
Bullish bias remains intact with strong buy opportunities around key support levels like 3328-3330.
For short-term traders, focus on quick scalping within the resistance zones, but don’t forget to follow the trend for the longer-term buy strategy.
💡 Stay cautious with your Stop Loss (SL) and Take Profit (TP) to manage risk effectively. Happy trading! 🌟

Gold Holds Strong Above $3,335 – Is $3,390 the Next Target?Hey traders!
Let’s take a quick look at what’s happening with gold today
Gold continues to hold its impressive bullish momentum, trading firmly above the $3,335 mark. The rally is fueled by a sliding US dollar and declining US Treasury yields, which are driving investors toward safe-haven assets like gold.
The US Dollar Index (DXY) has dropped to its lowest level since early 2022, while the 10-year Treasury yield sits around 4.19%. These conditions give the Federal Reserve more room to consider rate cuts—supporting gold’s upside.
Adding to the bullish case, fresh data shows a recovery in US manufacturing, further boosting demand for gold.
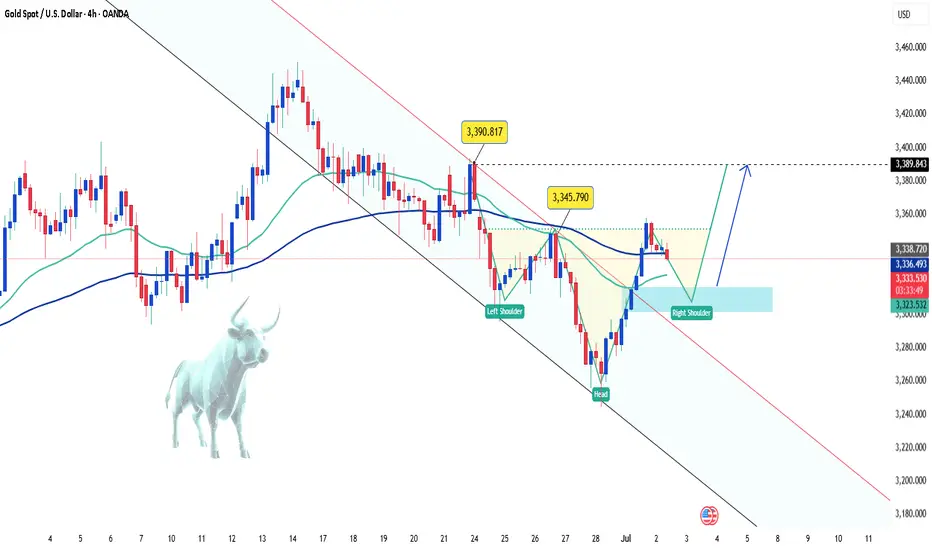
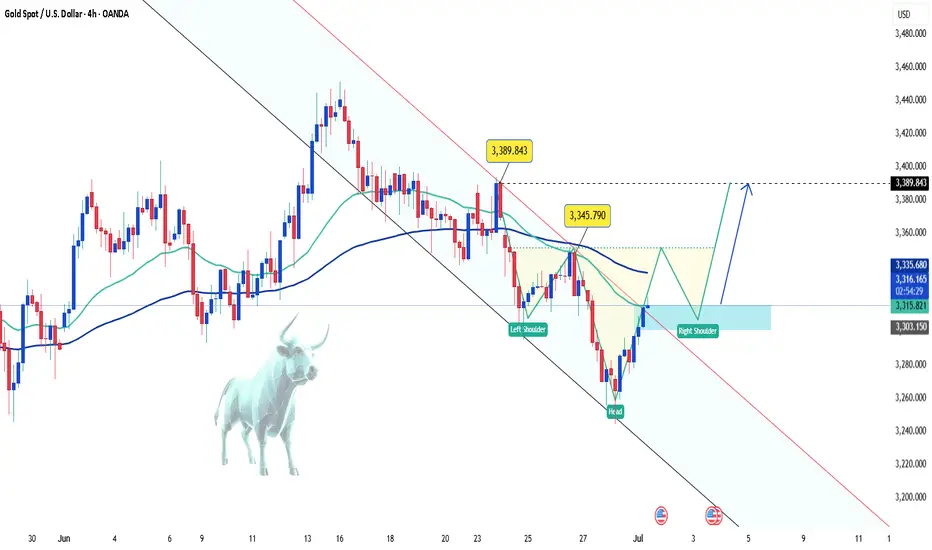
📈 On the technical side, gold is moving just as we anticipated: it’s broken out of the descending channel and is currently forming a bullish inverse head and shoulders pattern. If the pattern completes, we could see the next leg higher pushing toward $3,390.
What do you think — is gold ready for another breakout?
Drop your view below! 💬
Trade Setup – BUY WTI Crude Oil (USOIL)✅ Trade Setup – BUY WTI Crude Oil (USOIL)
📅 Date: July 2–3, 2025
🕒 Timeframe: 1H
🎯 Trade Parameters:
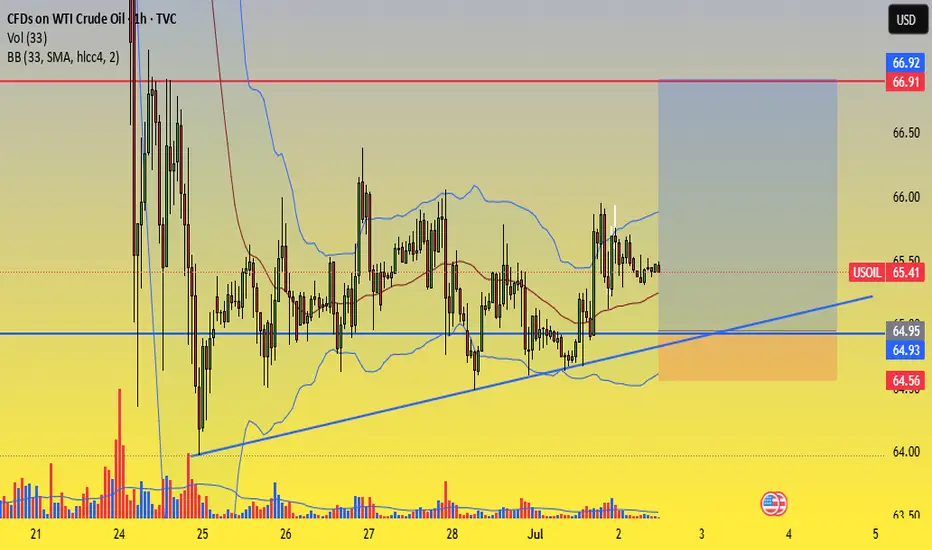
Buy Zone (Entry): 65.00 – 64.90 USD/barrel
Stop Loss (SL): 64.55 USD (below rising trendline and lower Bollinger Band)
Take Profit (TP):
• TP1: 66.50 USD
• TP2: 67.00 USD
📊 Technical Analysis Highlights:
Rising trendline from June 24 continues to hold, forming a solid support area around 64.9–65.0.
Bollinger Bands are narrowing, indicating potential volatility expansion. Price is consolidating near the mid-band (MA20), often a precursor to bullish breakout.
Volume shows signs of accumulation around the trendline, suggesting buying interest at key support.
Multiple rejections from 64.90 without breakdown reinforces this level as near-term support.
🧭 Strategy Notes:
Enter on price pullback to the 65.00–64.90 zone with confirmation (e.g. bullish pin bar, engulfing pattern, volume spike).
Suggested position management:
• Take 50% profit at 66.50
• Hold the remaining 50% toward 67.00 if momentum is strong.
If price breaks below 64.55 with strong volume, exit the trade to preserve capital.
Good luck Everybody! Fl me here and ytb ! Thanks
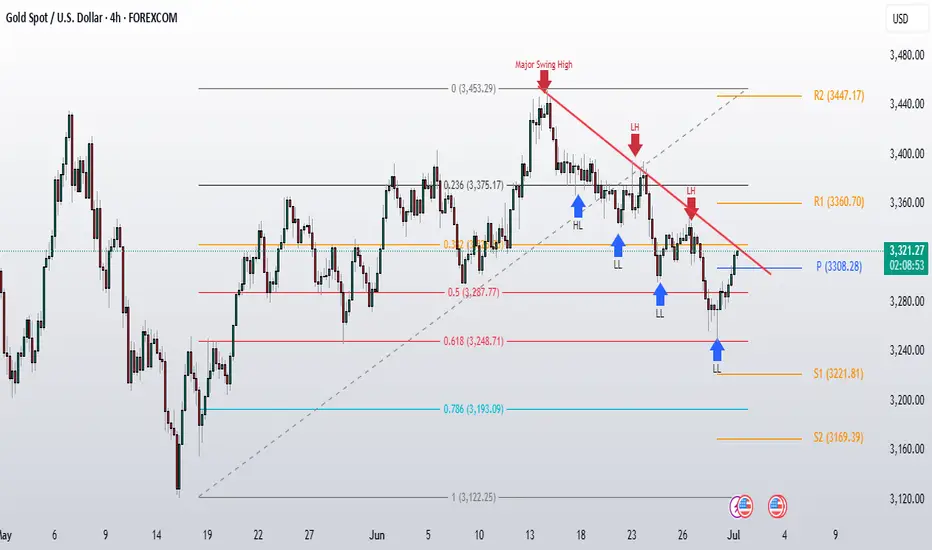
Gold Bulls are back in control?Gold has delivered exactly what we were hoping to see! The new month opening brought impressive strength, and the technical picture has shifted again in favor of the bulls.
Gold successfully broke above critical 3308 weekly pivot level we've been watching.
The bearish HH/LL pattern has been broken this is very good sign for changing the overall trend direction and That descending trendline resistance that was capping rallies has finally been taken out.
Gold is now sitting in a much stronger technical position. All the pieces we needed for a genuine reversal are falling into place. The bulls have reclaimed control as of now.
Support to Hold: 3300-3308 zone
This is now our critical support area. As long as gold holds above this zone, the bullish momentum seems to be in favor of bulls.
Upside Targets:
Weekly R1: 3360 - First major resistance to watch
Weekly R2: 3447 - Next significant target if momentum continues
The technical transformation is clear we've gone from a corrective phase to what looks like a resumption of the bullish trend. The bulls are back , and as long as we maintain support above 3300-3308, those higher targets become very realistic.

Gold Rises as Quarter Ends – Can Bulls Push Toward 3,345?June 30 marks the final trading day of both the month and the quarter, making it a key session for technical traders. On Monday, gold edged higher, supported by a weakening U.S. dollar. The greenback slid against the yen and dropped to its lowest level in nearly four years versus the euro, fueled by market optimism around U.S. trade deals. This helped reinforce expectations that the Federal Reserve might cut interest rates earlier than previously anticipated—giving gold the boost it needed to break above the 3,300 USD barrier.
From a technical perspective, short-term momentum now favors the bulls after a clear breakout above the descending parallel channel. If this move holds, the next upside target is projected near the 3,345 USD zone, as highlighted on the chart.
However, be careful because this can also be a fake breakout.
XAUUSD 01/07: GOLD'S RELIEF RALLY FROM A MONTHLY LOWXAUUSD 01/07: GOLD'S RELIEF RALLY FROM A MONTHLY LOW – USD WEAKENS, BUT CLEAR MOMENTUM IS STILL MISSING
🌍 Market Overview – USD Weakness & Gold's Rebound Potential
After a significant drop to a one-month low, Gold is beginning to recover slightly, partly due to a weaker USD, improving market sentiment. However, the rally remains cautious and still lacks a strong momentum to push gold decisively higher.
💵 USD Weakness: Can Gold Continue to Rebound?
Recent US economic data has shown a slight decline in consumer spending, which has led to speculations that the Federal Reserve may take a more dovish stance on interest rates in the near future. This has weakened the USD, providing room for Gold to rebound slightly.
That said, there hasn't been a significant catalyst to push Gold into a strong breakout yet.
📉 The Fed is Still the Key Player
The market is closely watching the Fed's next moves. However, there’s a divide on whether interest rates will be cut or maintained. The recent US data isn’t weak enough to warrant a policy change from the Fed, but it’s also not strong enough for the Fed to keep its hawkish stance intact.
This leaves Gold in a limbo, with no clear direction in the near term. Gold is caught between weak expectations of further rate cuts and the ongoing strength of the USD.
🧠 Analysis for Traders:
Gold is responding lightly to macroeconomic factors but hasn’t established a strong trend. This is a period prone to market noise—Gold may jump up and down on news, but the momentum required to establish a consistent trend is lacking.
Traders should monitor USD movements and US labor data closely this week, especially the NFP report, as this could provide more clarity for Gold’s future direction.
✍️ Conclusion:
Gold is recovering from its lows, but it remains uncertain.
The Buy side hopes for rate cuts by the Fed.
The Sell side is betting on USD strength.
As for us traders, let’s stay patient, observe closely, and be ready for the next move. The big wave may still be coming, but smaller price actions right now could give us clues for the upcoming trend.
🔶 Key Levels & Strategy:
Current Support Zone: Gold is holding above the critical psychological support levels of 3300-3304. If the upward momentum continues, a move towards 335x-337x is highly possible in the near term.
Liquidity Gap: Currently, there’s a liquidity gap at the higher levels. The goal is for Gold to rise further to fill this gap before any deeper retracement occurs.
📈 Trading Plan:
BUY ZONE: 3303 – 3301
‼️ SL: 3297
✔️ TP: 3306 → 3310 → 3315 → 3320 → 3325 → 3330 → ???
SELL ZONE: 3358 – 3360
‼️ SL: 3364
✔️ TP: 3354 → 3350 → 3345 → 3340 → 3320
⚡ Final Thoughts:
As the market awaits further data, keep an eye on these key support and resistance levels for your trading setups.
The overall trend is still upward, but short-term volatility is expected. Make sure to follow your risk management strategies.

Trading Analysis for Gold Spot / U.S. Dollar (15-Minute Chart)
Based on the provided 15-minute chart for Gold Spot / U.S. Dollar (XAU/USD), published by NaviPips on TradingView.com on June 30, 2025, at 17:53 UTC, here’s a suggested trading setup for a buy position:
Current Price and Trend: The current price is 3,241.875, with a slight increase of +0.250 (+0.01%). The chart shows a recent downtrend that appears to be stabilizing near the current level, suggesting a potential reversal point.
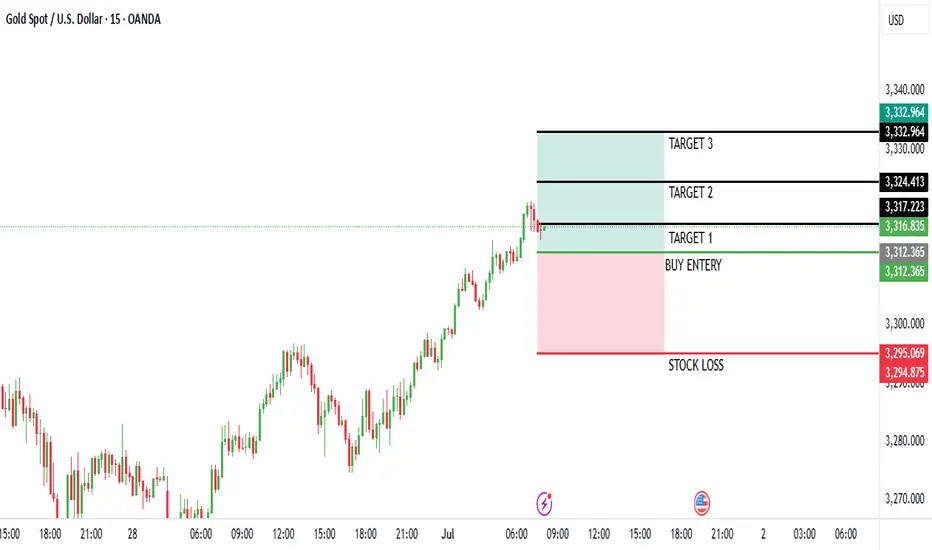
Buy Entry: Enter a buy position at 3,312.875 (current price), as it aligns with a support zone where the price has found a base, indicated by the horizontal dashed line and recent consolidation.
Stop Loss: Place a stop loss at 3,295.250, below the recent low, to protect against further downside. This level is approximately 10.625 points below the entry, defining the risk.
Take Profit Levels:
Take Profit 1: 3,317.875, a conservative target about 20.000 points above the entry, aligning with a minor resistance zone.
Take Profit 2: 3,324.750, a mid-range target approximately 31.875 points above the entry.
Take Profit 3: 3,332.500, a deeper target about 45.625 points above the entry, indicating a potential trend reversal.
Price Action: The chart indicates a downtrend with a possible bottoming pattern near the current level. The support zone and upward candlestick suggest a buy opportunity if the price holds.
Risk-Reward Ratio: The distance to the stop loss (10.625 points) compared to the take profit levels (20.000 to 45.625 points) offers a favorable risk-reward ratio, ranging from approximately 1:1.9 to 1:4.3.
Conclusion
Enter a buy at 3,241.875, with a stop loss at 3,295.250 and take profit levels at 3,317.875, 3,324.750, and 3,332.500. Monitor the price action for confirmation of an upward move, and be cautious of a potential continued downtrend if the price breaks below the stop loss level. (Note: I assume "take profot" was a typo for "take profit" and have corrected it accordingly.)
Gold Analysis: Perfect Bounce from 3248 SupportJust as we discussed in yesterday's analysis, gold has delivered an excellent bounce from that Fibonacci golden support zone (3248-3287). The bulls stepped in right where we expected them to, and the reaction has been quite impressive.
Monthly & Quarterly Close Above 3300: Gold managed to close both the month and quarter above that critical 3300 psychological level. These higher timeframe closes carry significant weight and suggest the bulls aren't ready to give up just yet.
Weekly Pivot Reclaimed:Today we're seeing gold trade above the 3308 weekly pivot level . This is exactly what we needed to see for any meaningful recovery attempt.
.All these factors are lining up in the bulls' favor, but there's still one critical piece missing breaking resistance trendline that's been creating the lower high (LH) and lower low (LL) structure.
What We Need to See:
For gold to confirm this isn't just another counter-trend bounce, the bulls need to:
1. Break above that descending trendline resistance
2. Hold the breakout on higher timeframes
3. Create a higher high to break the current bearish structure
We're at a pivotal moment. The bounce from the golden zone was textbook, the monthly/quarterly closes were bullish, and we're back above the weekly pivot. Now it's all about whether the bulls have enough momentum to break through that structural resistance.
If they can claim territory above that trendline and hold it, we could see a strong continuation higher. But if they get rejected here, it might just be another failed attempt in the ongoing correction which can lead to consolidation in big range.
this week will be crucial in determining gold's near-term direction.
Bear Flag Breakdown Looms on XAUUSDGold (XAUUSD) is currently forming a clear bear flag pattern on the H1 chart, signaling a weak corrective move within a dominant downtrend. The 5-wave structure (1 to 5) inside the flag indicates limited bullish momentum. If the lower trendline breaks, gold could plunge toward the key support zone at 3,295 USD.
On the news front, the ceasefire agreement between Iran and Israel brokered by the U.S. has significantly reduced geopolitical risk, weakening the demand for safe-haven assets like gold. In under 48 hours, gold lost over 60 dollars, reflecting the market's rapid shift toward risk-on sentiment. Additionally, speculative money is flowing out of precious metals and into growth assets, adding further downside pressure.
Given this confluence of technical and fundamental factors, I lean strongly toward a bearish continuation, with a likely breakdown of the flag pattern. As long as price remains below the EMA 89 (around 3,342 USD), the short-term trend favors the bears.
Are you ready for the next leg down?

Gold price recovers 3310, accumulates MondayPlan XAU day: 30 June 2025
Related Information:!!!
Gold prices (XAU/USD) regained some lost ground during the early European trading hours on Monday. Increasing expectations that the US Federal Reserve (Fed) will implement additional interest rate cuts this year—and potentially sooner than previously anticipated—may weigh on the US Dollar and, in turn, provide support for the USD-denominated commodity, as a weaker dollar makes gold more affordable for foreign investors.
However, improved risk sentiment stemming from the US-China trade agreement, as well as the ceasefire reached between Israel and Iran, may reduce the appeal of gold as a traditional safe-haven asset. Market participants now turn their attention to upcoming remarks from Federal Reserve officials later on Monday, with scheduled speeches from Atlanta Fed President Raphael Bostic and Chicago Fed President Austan Goolsbee.
personal opinion:!!!
Gold price recovers to gain liquidity at the beginning of the week, using fibonacci to find potential resistance: 3310
Important price zone to consider : !!!
SELL point: 3310 zone
Sustainable trading to beat the market

Gold at Make-or-Break Zone – Will Sellers Strike Back?Gold is staging a rebound, but don't let it fool you — the real battle is just ahead.
After last week's sharp drop, the price is now approaching a key resistance near 3,355, where the 34 and 89 EMAs meet a supply zone. This is not just any level — it's the perfect spot for sellers to step in.
Meanwhile, markets are bracing for high-impact US data this week, including Core PCE and Q1 GDP. If inflation runs hot, it could crush gold’s momentum and fuel another leg down.
If rejection happens here, gold could drop back toward the 3,265 zone. Bulls need a breakout to regain control — but right now, the edge leans bearish.
Are you ready for the next move?

Update the latest gold price todayGold kicks off the new week with a sharp drop, sliding to around $3,258/oz, down more than $14 from Friday’s close. The primary driver behind this decline is the easing geopolitical tension in the Middle East, following a ceasefire agreement between Israel and Iran, which has significantly reduced demand for safe-haven assets.
In addition, stubborn inflation and weak global growth are forcing central banks — especially the Federal Reserve — to keep interest rates elevated for longer. This policy stance continues to pressure gold prices.
From my perspective, gold had surged too quickly in recent weeks due to geopolitical risks. Now that those tensions have calmed, capital is flowing out of gold and rotating into risk-on assets like stocks, bonds, and real estate.
Looking ahead, this week brings a wave of high-impact economic data from the US, Eurozone, China, and Japan — including the June PMIs from the US and China, and preliminary CPI from the Eurozone. These releases are likely to shape gold’s short-term direction.
For now, the bearish bias remains, with $3,300 acting as a key resistance level to watch.

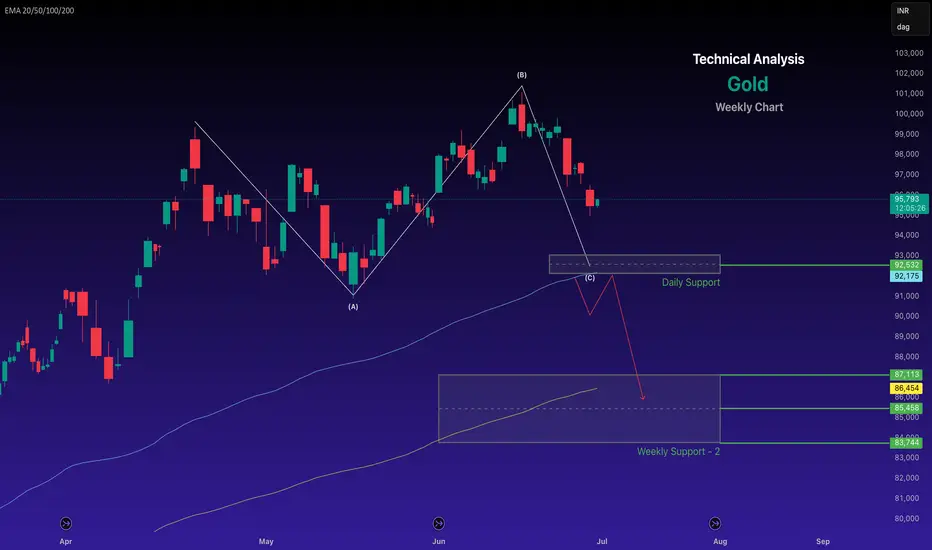
Gold retains a bearish trend after breaching support.Weekly Technical Analysis for Gold
Chart for the reference
- Disclaimer --
This analysis is based on recent technical data and market sentiment from web sources. It is for informational purposes only and not financial advice. Trading involves high risks, and past performance does not guarantee future results. Always conduct your own research or consult a SEBI-registered advisor before trading.
#Boost and comment will be highly appreciated
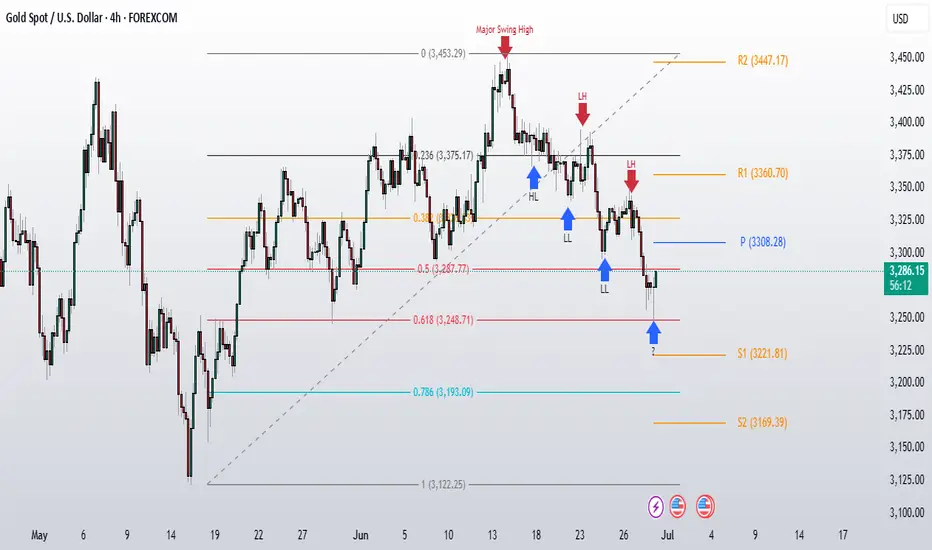
Gold Weekly Analysis: Breaking Down After 3300 Support FailureCurrent Market Structure:
Gold breakdown below critical 3300 support level last Friday, and more importantly, we closed the week below this key psychological level. This breakdown has shifted the technical structure, and we're now seeing a clear pattern of lower highs (LH) and lower lows (LL) developing as gold enters a downside correction phase.
The weekly pivot has dropped to 3308, showing a descending formation compared to last week's pivot at 3386. This descending pivot structure confirms the bearish momentum that's been building.
Level to Watch:
3308 Weekly Pivot - This is our key reversal level for this week. For any meaningful bullish recovery, we need to see:
1. A convincing breakout above 3308 on higher timeframes
2. Price sustaining above this level
3. Breaking the current LH/LL bearish structure
Without these conditions being met, any rallies should be treated as counter-trend bounces rather than genuine reversals.
Support Zones:
Immediate Support: 3248-3287 (Fibonacci Golden Zone)
This is our primary support area to watch. It's a confluence zone that could provide a decent bounce opportunity if we get there.
Deeper Support Levels:
- 3221Weekly S1 support
- 3200 Major psychological level
If the golden zone fails to hold and we see a breakdown there, these lower levels become our next areas of interest.
The bears are in control of the weekly structure right now. Any recovery attempts need to prove themselves by reclaiming 3308 and holding it on higher timeframes. Until then, we're in correction mode with Fibonacci support levels as our key support area.
30/06: WILL WE SEE A RECOVERY ON THE LAST DAY OF THE MONTH? GOLD PLAN – 30/06: WILL WE SEE A RECOVERY ON THE LAST DAY OF THE MONTH? ☄️
✅ Macro Context – Focus on USD Debt and Political Pressure
As June comes to a close, the US faces a major $6 trillion debt maturity from COVID-era borrowings, creating potential stress on USD liquidity and overall market sentiment.
Gold saw a sharp dip to the 32xx range during the Asian session but has bounced back and is currently hovering near last week's closing levels.
While the medium-term outlook remains bearish, short-term signals are showing signs of a potential recovery.
✅ Political Catalyst:
Trump’s Pressure on Fed: Trump is pushing the Federal Reserve to cut interest rates to 1%-2%, saying he won’t appoint anyone unwilling to ease monetary policy.
This has sparked expectations for potential rate cuts, which could provide support for gold prices in the near term.
✅ Technical Outlook – Multi-timeframe Structure
Gold continues its downward correction on higher timeframes. However, short-term candles are indicating recovery momentum, with buying activity near the 327x zone.
Today's Strategy: Focus on short-term BUY setups that align with the recovery wave.
✔️ Key Resistance & Support Levels
🔺 Resistance: 3283 – 3291 – 3301 – 3322
🔻 Support: 3277 – 3271 – 3259 – 3247
🔖 Trade Scenarios
✅ Buy Scalping
🔺 Entry: 3272 – 3274
🔹 SL: 3268
✔️ TP: 3282 → 3288 → 3298
✅ Buy Zone
🔺 Entry: 3249 – 3251
🔹 SL: 3244
✔️ TP: 3265 → 3282 → 3295 → 3310
💠 Sell Scalping
🔺 Entry: 3298 – 3300
🔹 SL: 3304
✔️ TP: 3292 → 3282 → 3270
💠 Sell Zone
🔺 Entry: 3327 – 3329
🔹 SL: 3333
✔️ TP: 3322 → 3310 → 3298 → 3282
⚡️ Final Note
As we near the end of the month, expect possible volatility due to USD flows and institutional rebalancing, which could create further opportunities in the gold market.

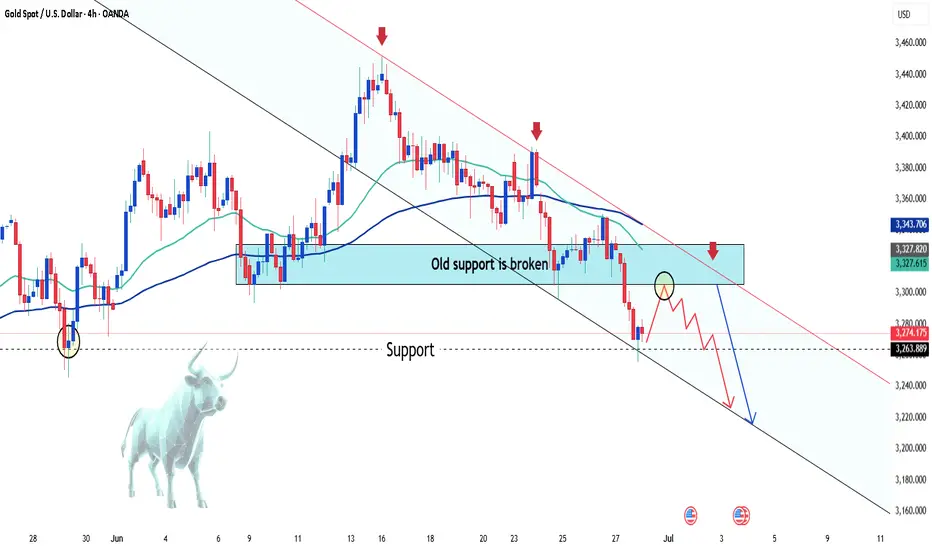
Gold in Free Fall – Is This Just the Beginning?Hey fellow traders!
Today, gold is taking a serious dive — price has crashed below the critical $3,300 support, and things aren't looking great for the bulls. The chart says it all: the old support zone has been wiped out, and the recent minor bounce? Just the calm before a deeper selloff.
💣 What’s dragging gold down?
-The reasons are crystal clear:
-US Treasury yields are spiking, pulling capital away from gold.
-The US dollar is rebounding strongly, boosted by hawkish Fed commentary.
Global markets are optimistic, with geopolitical tensions easing — which means gold is losing its safe-haven appeal.
In short: there's not much left to keep gold afloat right now.
📉 Technical outlook – Breaking down and breaking lower?
On the H4 chart, gold has officially lost the EMA 34 (~$3,322) — a key dynamic support that's held multiple times in the past. With that breach, sellers rushed in. Price is now sliding toward the bottom of the descending channel, targeting $3,240, and possibly $3,200 if bearish momentum continues.
And if gold pulls back to retest the broken zone? Don’t celebrate too soon — it could be the perfect trap for sellers to reload.
So, what’s your take?
GoldGold ( OANDA:XAUUSD ) – Bearish Wyckoff Distribution (Unorthodox) in Play
Gold is currently trading around $3273/oz and appears to be in Phase D of a Bearish Wyckoff Distribution Schematic #1 (Unorthodox) on the 4H chart. The price is showing signs of weakness, but a final upthrust toward $3370 can’t be ruled out before a deeper breakdown.
Key level to watch:
⚠️ Breakdown confirmation below $3260–3200 could open the gates for a sharper decline.
Bearish structure still unfolding – traders should stay alert for signs of a last bull trap before distribution completes.
#Gold #XAUUSD #Wyckoff #TechnicalAnalysis #CommodityTrading #PriceAction

XAUUSD Bullish Reversal from Channel Support | Gold Buy SetupAnalysis Overview:
Gold has been trading inside a clearly defined descending channel (marked by the orange trendlines). After a strong bearish move, price has reached the lower boundary of this channel, which is acting as dynamic support.
Key Technical Details:
Descending Channel Support: XAUUSD has tested the lower trendline multiple times and is currently showing rejection wicks, suggesting potential exhaustion of selling pressure.
Demand Zone: The shaded horizontal area represents a prior consolidation and minor support level that aligns with the channel bottom, adding strong confluence.
Entry: Planned buy entry at the current level near channel support, anticipating a bounce.
Stop Loss: Placed below the recent swing low and outside the channel, to allow room for volatility while protecting against continuation of the downtrend.
Target: The mid-to-upper boundary of the descending channel, aiming for a favorable risk-reward ratio.
Market Context: The higher timeframe trend remains bearish overall, so this is a short-term reversal (counter-trend) setup within the channel structure.
Trade Plan Rationale:
Expecting a corrective move upward within the descending channel as price retests previous supply zones and dynamic resistance. This setup is based on:
Confluence of channel support and demand zone
Multiple rejection wicks showing buyers stepping in
Potential mean reversion towards the channel midpoint
Disclaimer:
This is my personal analysis on XAUUSD and not financial advice. Always do your own research and manage risk carefully.

Gold at Crucial 325x Support – What's Next for the Yellow Metal?XAUUSD D1 Forecast: Gold at Crucial 325x Support – What's Next for the Yellow Metal?
Namaste, fellow traders!
Today, let's zoom out and look at the bigger picture for Gold (XAUUSD) on the Daily (D1) timeframe. Our analysis indicates that Gold has hit a very strong, hard support level around the 325x region. This is a pivotal point that could dictate Gold's medium to long-term direction!
🌍 Macroeconomic Context: The Forces at Play for Gold
While we've seen some USD weakness due to speculations surrounding the Fed (like the rumors about replacing Powell) and expectations of rate cuts, these factors haven't completely prevented Gold's recent decline on the daily chart. Also, the sustained ceasefire between Israel and Iran is reducing Gold's safe-haven appeal.
However, the current price action at the robust 325x support level is a significant technical signal. The influence of upcoming US macroeconomic data (especially the PCE Index on Friday) and speeches from FOMC members will be crucial in confirming or negating Gold's next moves. If positive news for Gold aligns with this support holding, it could act as a strong catalyst.
📊 XAUUSD Technical Analysis (D1): Predicting Gold's Next Move
Based on the fact that Gold has encountered strong support at 325x, we can anticipate the following scenarios:
Bounce from 325x (Potential Upside Phase):
If the 325x area (which reinforces the 3264.400 support from image_e9d325.png) holds firm, we expect a strong reaction and an upward move for Gold.
The initial target for this bounce would be the 332x region, which aligns with resistance levels 3313.737 - 3330.483 from our previous analysis. On a broader timeframe (as shown in image_83845c.png), this corresponds to the resistance zone around 3326.022. This 332x area could represent a continuation pattern, meaning it might be a corrective rise before the resumption of the larger trend.
Resumption of Downtrend (After Reaching 332x):
Once Gold reaches and tests the 332x zone (3313.737 - 3330.483 / 3326.022) and shows bearish confirmation signals (e.g., a strong bearish engulfing candle, a pin bar, or a clear top formation), we anticipate a resumption of the downward movement.
The next major target for this fall would be the 317x area, which correlates well with the strong support at 3173.052 on the larger timeframe (as depicted in image_83845c.png).
🎯 XAUUSD D1 Trading Plan: Your Long-Term Strategy Ahead!
Considering the current D1 analysis, here's our actionable plan:
1. BUY PHASE (Bounce from Support):
Entry: Observe price reaction in the 325x - 326x zone (especially 3264.400). Only buy if there are clear bullish confirmations (e.g., a confirmed bullish pattern on the daily or 4-hour candle, a strong bounce from the zone with volume).
SL: Just below the 325x support zone (e.g., 3245-3240, depending on confirmation).
TP: 3280 - 3290 - 3300 - 3313.737 - 3326.022 (key 332x zone). This will be our primary target for the bounce.
2. SELL PHASE (Downtrend Resumption):
Entry: After the price reaches the 332x zone (3313.737 - 3330.483 / 3326.022) and shows bearish confirmation signals (e.g., strong bearish engulfing, pin bar, or top formation).
SL: Slightly above the 332x zone (e.g., 3335-3340).
TP: 3300 - 3290 - 3280 - 3270 - 3260 - 3250 - 3200 - 3173.052 (final 317x target).

EURUSD Bulls in Charge – Can They Push Higher?EURUSD continues to demonstrate strength, maintaining a clear uptrend on the H4 timeframe. After breaking above the former resistance zone near 1.1600, price surged and is now consolidating around 1.1706. This breakout confirms strong bullish momentum, especially following a long period of consolidation.
That said, the area around 1.1730–1.1740 is showing signs of minor rejection, with a potential double-top pattern emerging. However, this appears to be a healthy pullback within the broader bullish trend.
The most reliable support is currently found at 1.1620, which also aligns with the EMA 34 — a dynamic level that has acted as a pivot throughout this rally.
As long as price remains above 1.1620, the bullish trend remains firmly intact.
