GOLD Pullback or Bull Trap? This Move for the WEEK⚡️Will the Recovery Hold or Just a Retest Before Another Drop?
🧠 Macro Backdrop:
Geopolitical tension: US-China trade headlines and Russia-Ukraine negotiations continue to stir uncertainty, but risk appetite is still cautious.
US CPI and PPI data this week came in weaker than expected → inflation remains soft, but no signal yet for immediate rate cuts from the Fed.
Gold has been under pressure for 2 weeks but may be stabilizing as DXY loses steam and equity markets show hesitation.
🔍 Technical Outlook (Chart: M30–H1):
Gold is forming a rising wedge within a broader corrective pattern. Yesterday’s rebound from the 3,163 zone has pushed price back above the 20 EMA (black) and is testing the 3,208–3,210 zone.
This area is key for today: breakout or rejection?
🔑 Key Levels to Watch:
🔺 Resistance:
3,221 → Local structure neckline
3,235 → Previous supply + Fibo confluence
3,251 → Strong upper bound resistance
🔻 Support:
3,184 → Minor support (demand block)
3,173 → Swing low (key reaction zone)
3,163 → Final line of defense
📈 Trade Scenarios:
⚠️ Scenario A – Bullish Push Above 3,221:
If price breaks and holds above 3,221, we may see a bullish continuation to 3,235 and even 3,251.
Momentum confirmation: Price must stay above 3,210 on pullbacks.
🔹 Entry: 3,222 – 3,224
🔹 SL: 3,216
🔹 TP: 3,235 → 3,251
⚠️ Scenario B – False Break & Bearish Rejection:
If price fails to hold above 3,221 and reverses below 3,208 → potential short opportunity targeting lower liquidity zones.
🔻 Entry: 3,220 – 3,218 (after rejection)
🔻 SL: 3,228
🔻 TP: 3,184 → 3,173 → 3,163
⚠️ Scenario C – Range Play:
If price remains between 3,208 and 3,184, scalp inside the range and wait for breakout confirmation.
💬 Follow for real-time setups and live strategy updates during major market sessions.
Gold

Bearish short-term strategy for XAUUSDShort-term Elliott wave 4th should be 382% of wave 3, and the price is finding resistance at this level. From here, XAUUSD finds a downside target of $3141 as the 5th wave finishes this entire wave pattern.
This pattern invalidates if the price breaks the resistance of $3186.50 and entire elliot wave invalidates if it crosses above low of 1st wave.

GOLD OUTLOOK – MAY 16: MARKET TRAP OR LEGITIMATE RECOVERY?GOLD OUTLOOK – MAY 17: MARKET TRAP OR LEGITIMATE RECOVERY?
Gold is closing out the week with unpredictable volatility, following two extreme sessions where prices dropped over 100 pips, only to rebound aggressively. Are recent news headlines just justifying the price action, or is this a well-orchestrated market trap?
🔍 Technical Breakdown (D1 & H4)
On the daily and 4-hour charts, we can clearly see a sharp breakdown, followed by an immediate rebound into the 325x area.
🎯 Key Level to Watch: 3254 – 3256
If price remains below 3256, sellers continue to dominate.
If 3256 is broken to the upside, we could see a quick move toward 327x–328x.
This zone acts as a decisive barrier between continuation and reversal.
🌐 Macro Perspective – Market Triggers
US inflation data continues to disappoint, weakening the USD and halting DXY recovery.
US-China tensions flare up again after short-lived optimism, especially around tariff talks and rare earth restrictions.
With mixed geopolitical cues, this market is prone to fakeouts and liquidity sweeps, especially ahead of the weekend.
📌 Key Levels to Monitor
🔺 Resistance Zones: 3237 – 3251 – 3261 – 3276 – 3287
🔻 Support Zones: 3205 – 3188 – 3170 – 3143
🎯 Trading Plan
🔵 BUY SCALP:
Entry: 3172 – 3170
SL: 3166
TP: 3176 → 3180 → 3184 → 3188 → 3192 → 3200
🔵 BUY ZONE:
Entry: 3142 – 3140
SL: 3136
TP: 3146 → 3150 → 3154 → 3158 → 3170 → 3180 → 3190
🔴 SELL SCALP:
Entry: 3160 – 3162
SL: 3166
TP: 3156 → 3152 → 3148 → 3144 → 3140 → 3130
🔴 SELL ZONE:
Entry: 3276 – 3278
SL: 3282
TP: 3272 → 3268 → 3264 → 3260 → 3255 → 3240
⚠️ Key Notes:
Friday sessions often bring major liquidity grabs and false breakouts.
Be disciplined with SL/TP management – especially in such volatile conditions.
Wait for candle confirmation before reacting — don’t trade emotionally.

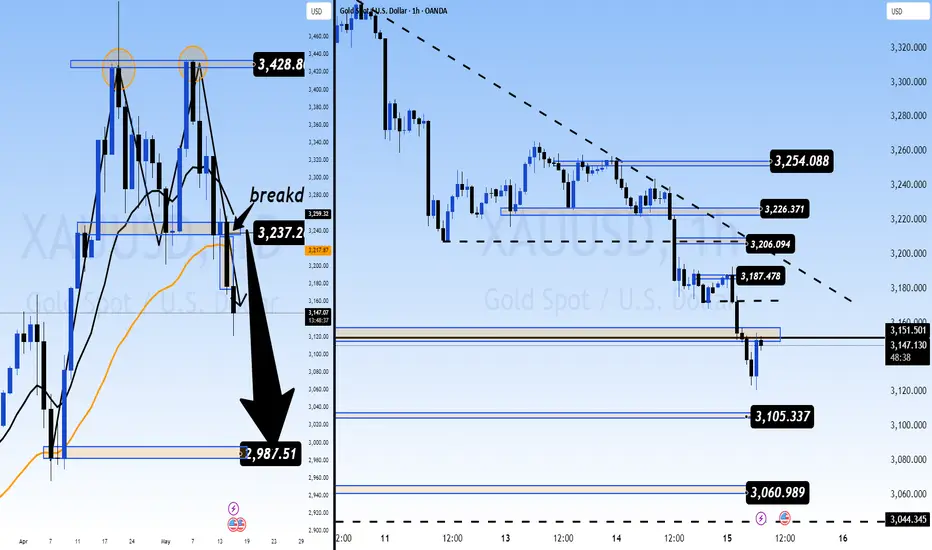
Gold Reclaims 3200 What’s Next?Yesterday, gold dipped into the 3140–3160 support zone, even tagging a low near 3120 and from there, buyers stepped in with a decent bounce. That was expected.
Now, price has reclaimed the 3200 level and this is the key zone to watch today. ⚠️
Above 3200? Bulls might get some room to test the next resistance around 3265–3275. This is a short-term target if the upside continues.
Back below 3200? Bears may take control again, with potential continuation toward yesterday’s lows. If that breaks, our previous downside projection remains in play.
Also, from the Fibonacci retracement of this recent down leg (from 3440 to 3120) the 3282 level is a major Fib level (0.5) to watch, Unless we close above that, I’ll continue holding part of my short positions, aiming for lower levels as marked on the chart.

Gold breaks EMA34 – Trend is weakeningOn the D1 chart, gold has just closed below EMA34 for the first time since February. Although the price bounced back slightly from the 3,120 area today, I see that the recovery force is still weak and not enough to reverse the trend. EMA34 has started to curve down, warning that the medium-term uptrend is weakening.
If the next few sessions cannot surpass 3,240, I am inclined to the scenario that the price will continue to fall to EMA89 around 3,050–3,070. I will temporarily stay out of this area, waiting for a clearer signal before deciding to follow the buying or selling side.

Gold Loses 3,220 – Will It Fall Further?Gold has just broken through the 3,220 support and closed the H4 candle at $3,213/ounce. The strong red candle with volume shows that the sellers are still in control. I saw the EMA34 cut down to the EMA89 early and maintained a negative slope – confirming a clear downtrend.
I am watching the 3,180 – 3,200 zone as the next target. If the price rebounds but does not surpass 3,240, I will continue to sell. The current situation is not suitable for buying against the trend, especially when the USD is still strong and the safe-haven sentiment is decreasing.

SPDR's Heavy Outflows Signal Institutional Exit – Is Gold LosingSPDR's Heavy Outflows Signal Institutional Exit – Is Gold Losing Momentum?
📉 SPDR Gold Trust Overview (Apr 24 – May 14, 2025):
🔻 Continuous Net Selling:
From April 30 to May 14, SPDR saw 10 consecutive sessions of net selling, unloading over 18.5 tons of gold.
📌 Key Selling Days:
May 2: -4.87 tons
May 6: -2.29 tons
May 14: -2.58 tons
👉 SPDR's gold holdings dropped from ~948.56 tons to ~936.51 tons — a decrease of over 12 tons in just 3 weeks, signaling that institutional capital is exiting gold ETFs. This reflects waning confidence in gold’s short-term upside.
🕯️ Technical Breakdown:
Gold's price has broken below the $3200 support zone on the D1 chart, invalidating the bullish defense zone.
The Double Top pattern is now around 80% completed, signaling a possible deeper drop unless a strong recovery occurs.
Momentum remains strongly bearish, making it difficult to time SELL entries unless lower timeframe resistance shows up.
🧭 Macro Pressures:
Optimism around US economic growth and expectations of prolonged high interest rates are weighing on gold.
The PPI report and Fed Chair's speech today could trigger further volatility, especially if the rhetoric remains hawkish.
CPI earlier this week painted a mixed picture, with sticky inflation — which is bearish for gold.
🧠 What Smart Money Is Doing:
Big funds are rotating out of gold and back into risk-on assets like equities and crypto.
This shift is not just a technical correction; it reflects a broader macro-driven sentiment change.
Gold is currently lacking institutional support.
🎯 Trading Strategy for Today:
🔴 SELL SCALP:
Entry: 3186 – 3188
SL: 3192
TP: 3182 → 3178 → 3174 → 3170 → 3166 → 3160 → 3150 → 3140
🔴 SELL ZONE (High-Probability Resistance):
Entry: 3226 – 3228
SL: 3232
TP: 3220 → 3216 → 3210 → 3206 → 3200 → 3196 → 3190 → ???
🔺 Key Resistance Levels:
3154
3174
3188
3206
3226
3254
⚠️ What to Watch Today:
US PPI and Fed speech could trigger extreme volatility in the NY session.
Wait for price to pull back toward resistance before SELLING — don’t chase.
BUY only if a confirmed D1 reversal or high-volume reaction occurs.
🔚 Final Thoughts:
With SPDR aggressively dumping gold and price breaking below critical support, institutional flows are no longer supporting the bull case. As long as price stays under $3200, SELL remains the primary strategy. A break below $3150 opens the path to $3000.
📣 Stay tuned — AD will update real-time strategies as we approach the US session. Follow, trade smart, and always respect your TP/SL. Good luck!
Gold : Time to fade the Bullish sentiments As expected, gold followed my projection very precisely....
After losing the 3200 support zone yesterday, price continued its descent and is now hovering around the 3140–3160 support area. This zone is significant and could act as a temporary buffer.
At this stage, I’m expecting some sideways movement a consolidation phase. Why? Because this level could attract some short-term buying or profit booking from sellers.
If gold fails to hold this level and we see increasing selling pressure, a clean breakdown could drive us straight toward the 3000 psychological level my next target. That would be a key area to watch for a larger bounce or even a macro reversal setup.
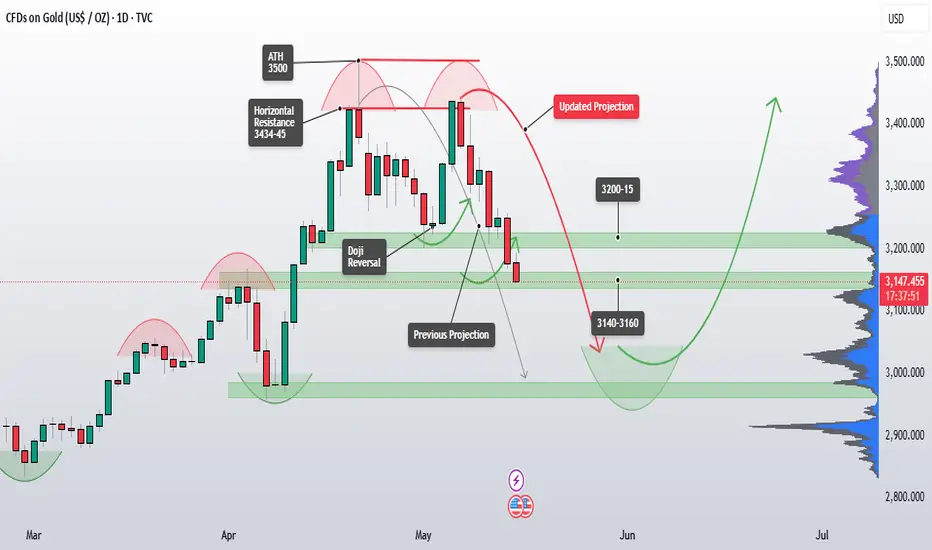
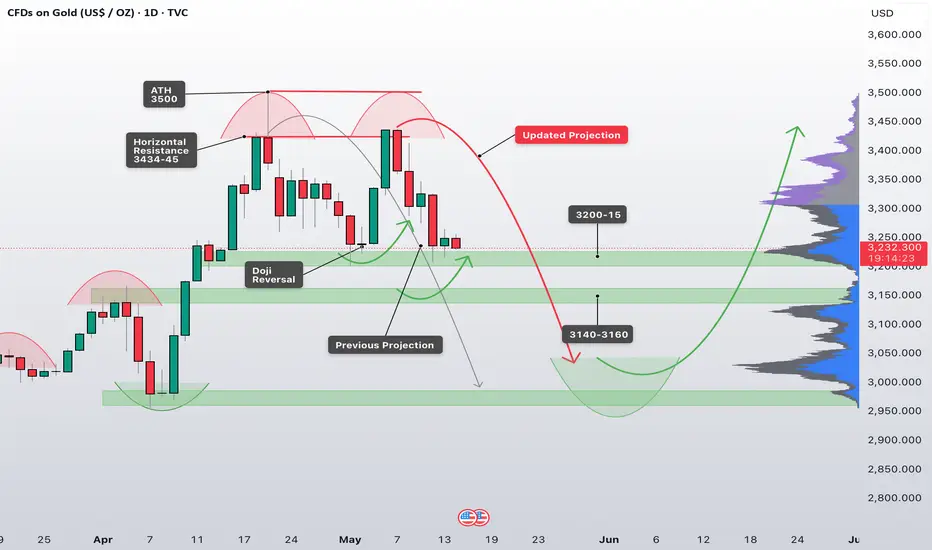
DOUBLE TOP IN PLAY? IS $3000 THE NEXT STOP?DOUBLE TOP IN PLAY? IS $3000 THE NEXT STOP?
Gold (XAU/USD) is showing signs of one of the most bearish patterns on the daily chart – the Double Top formation. After reaching an all-time high near $3,500, the metal has entered a sharp correction phase, now hovering dangerously close to the psychological support at $3,200.
🕯️ Technical Breakdown:
A clear Double Top pattern is visible on the Daily (D1) chart, with two peaks forming near the same resistance level – a classical signal of bullish exhaustion.
If today's daily candle closes below the $3,200 zone, we may see a sharp drop toward the $3,000 level in the short to medium term.
The neckline of this pattern aligns with the critical support at 3196–3200 – a must-watch area for potential breakdown confirmation.
💸 What the Smart Money Is Doing:
Investors are pulling out of Gold and rotating into risk-on assets like equities and crypto, chasing higher yields and growth potential.
This shift suggests more than just technical correction – it may reflect a broader macro sentiment change, especially if the Fed continues to maintain its hawkish tone and delays rate cuts.
📊 Suggested Trade Scenarios:
🔻 If Daily Close is Below $3,200:
High probability sell setup based on Double Top
Potential downside targets: 3120 → 3050 → 3000
🔺 If Price Holds Above $3,200 and Bounces:
Watch for retracement to 3250–3278 for potential reversal signals
Short-term BUY scalp towards 3300–3320 with tight SL below 3190
⚠️ What to Watch This Week:
Key US data including CPI, PPI, and a speech from the Fed Chair are expected — which could cause high volatility.
Market is extremely reactive — avoid emotional trades and wait for clear structure confirmations.
Risk management is key, especially in current uncertain market conditions.
📌 Final Thoughts:
The Double Top on Gold is becoming a strong technical signal for potential trend reversal. A confirmed break below $3,200 could open the door to a deeper correction toward $3,000.
📣 Stay connected with AD for more real-time updates, technical levels, and smart trading setups every session.

GOLD (XAUUSD) – 4H Bearish Setup🔍 Chart Structure
Pair: Gold (XAUUSD)
Timeframe: 4H
Bias: Bearish
Current Price: ~$3,192
🔻 Technical Analysis
1. Bearish Flag / Channel Formation
Price has been trending down within a descending parallel channel.
A breakdown from the channel has occurred, confirming bearish continuation.
2. Break and Retest Pattern
Price has broken below the channel, retested the broken structure, and rejected.
A bearish rejection candle confirms that sellers are active at the supply zone.
3. Supply and Demand Zones
Supply Zone (Orange Box): Around $3,240–$3,275
(Price rejected here after retesting the channel break.)
Demand Zone (Target): Around $2,980
(Previous structure support; high liquidity area.)
4. Market Structure
Series of lower highs and lower lows confirms a strong bearish market structure.
Strong momentum candle broke structure at $3,200, validating bearish sentiment.
📉 Trade Plan – Sell Setup
Entry Zone Stop Loss Take Profit Target Risk:Reward
$3,190–$3,200 (retest area) $3,275 (above supply) $2,980 (demand zone) 1:3+
✅ Bearish Confluences
Confluence Details
✅ Bearish Channel Breakdown Confirmed by breakout and retest
✅ Supply Zone Rejection Bearish candle from $3,240–$3,275 zone
✅ Liquidity Below Clean move down to $2,980 expected
✅ Momentum Shift Strong bearish candles breaking minor supports
❌ Invalidation Zone
If price closes above $3,275, this bearish setup becomes invalid.
It would indicate strength from buyers and break the supply zone.
📊 Risk Management Tips
Wait for a bearish engulfing or strong rejection candle at the retest.
Use partial TPs around $3,100 and trail SL to secure profits.
Maintain strict SL above $3,275 supply zone.

Gold Price Faces Heavy Pressure – Key Levels and Strategy GOLD DAILY STRATEGY – 14 MAY 2025
Price fails to hold gains as sellers dominate early Asia – Eyes on 3206 zone!
🔍 Market Sentiment Update:
Gold started the day with a slight uptick, but the rally was quickly rejected, and price fell sharply — a clear signal that buying power remains extremely fragile. This kind of price behavior — slow climbs, rapid falls — is typical of a market losing confidence in its upside momentum.
At the same time, geopolitical tensions have eased and US-China tariff talks have shown signs of progress, further pressuring gold as safe-haven demand weakens. All major macro indicators are now aligning with the bearish narrative.
🟠 Conclusion? Gold is likely to stay within the current descending price channel, and any bullish pullbacks may be limited unless strong demand re-emerges.
📉 Technical Outlook:
Price is trading below key resistance and continues to reject upside attempts. The market is respecting short-term resistance zones and pushing deeper into support. Unless there’s a clear reversal signal, selling on rallies remains the optimal approach.
📌 Key Resistance Zones:
3244
3262
3278
3290
3308
3330
📌 Key Support Zones:
3216
3206
3194
3170
3158
🎯 Trade Setups:
🔴 SELL SCALP
Entry: 3257 – 3259
SL: 3263
TP: 3253 → 3250 → 3246 → 3242 → 3238 → 3235 → 3230 → 3220
🔴 SELL ZONE
Entry: 3278 – 3280
SL: 3284
TP: 3274 → 3270 → 3266 → 3262 → 3258 → 3254 → 3250 → 3240 → 3230
🔵 BUY SCALP
Entry: 3196 – 3194
SL: 3190
TP: 3200 → 3204 → 3208 → 3212 → 3216 → 3220
🔵 BUY ZONE (Long-Term Zone)
Entry: 3158 – 3156
SL: 3152
TP: 3162 → 3166 → 3170 → 3174 → 3178 → 3182 → 3190
⚠️ Final Notes:
Price action continues to respect the bearish channel.
BUY entries are risky at this point — every bounce is met with resistance.
Watch closely for price behavior near 3222–3206 for possible intraday reactions.
News events remain critical — any update from US-China talks or surprise Fed remarks could change the bias swiftly.
📌 As always — respect your zones. Stay reactive, not predictive. Trade safe, and let the market show its hand.
Gold is at support but still looking weak As per previous updates, gold tested the first support area at 3200-25 and taking support on this area but overall picture is still looking in more correction side;
Price is currently forming range area on Intraday, to move up bulls need to create another follow up green closing on daily time frame and for sell bears need to closed the day under 3200.
Gold breaks through 3,300 – Selling pressure has not stoppedGold price plummeted from 3,325 to 3,237 USD/ounce after the US and China reached a temporary agreement to reduce taxes. The stock market is up, the USD is strong, money flows out of gold. I see selling pressure clearly dominating.
On H1, the price is still below EMA34 and EMA89, recovering weakly around 3,260. H4 confirms the downtrend that has been formed before. If it does not surpass 3,270, I am inclined to believe that gold will continue to fall to 3,200 – 3,180.

Gold Under Pressure: Will Key Support Hold?Gold prices slipped slightly to around $3,230 in early trading today. The precious metal remains on the defensive due to a stronger U.S. dollar, rising U.S. bond yields, and renewed optimism surrounding the U.S.–China trade deal.
As long as this optimism continues, XAU/USD is likely to remain under pressure. The recent surge to record highs was driven by concerns over a global economic slowdown and rising inflationary pressures due to tariffs — but that rally quickly faded, failing to hold its peak.
From a technical perspective, the 4H chart shows that gold has dropped below the EMA 34 and EMA 89, with a clear confluence between the EMAs and a marked resistance zone, which also aligns with the 0.618 Fibonacci retracement level.
If price fails to break above this resistance with strong momentum, the downtrend could continue, leading to deeper corrections in the near term.

GOLD Will the Correction Continue or Will We See a Reversal?GOLD UPDATE – Will the Correction Continue or Will We See a Reversal?
📊 Market Analysis:
Yesterday’s sharp decline in gold prices indicates a temporary easing in geopolitical tensions, particularly the ongoing conflict and political issues. It seems that the global environment has become slightly less tense recently, which could be a key factor in the correction we are seeing in gold.
From a political and trade perspective, the current price trend appears rational, but it is important to note that nothing is set in stone just yet. Further negotiations are expected, and these could lead to significant agreements. After the sharp drop, gold has managed to find some momentum for recovery, filling liquidity gaps and returning to areas of lower liquidity.
🔍 Current Outlook:
At the moment, I’m still expecting a possible rebound in gold, but the best opportunity might be to focus on sell positions for the time being. Yesterday’s plan, although bearish, enabled us to catch key levels for potential buy entries. Today, sell entries might be more favorable than buying.
The price is likely to continue adjusting as we await more macroeconomic news, especially regarding the US Federal Reserve’s actions. We’ve seen the Fed avoid Trump’s pressure, and there is speculation that interest rate cuts might be postponed until later in the year rather than mid-year as previously expected. If this is the case, gold could potentially revisit the $3000/oz mark in the near future.
🔮 Short-Term Strategy:
For now, we will continue trading according to the market’s correction wave. Sell positions might offer a better risk-to-reward ratio in this environment. We may still see some bounces, but they would likely be short-lived unless we see more positive macroeconomic data.
💡 Key Resistance Levels:
3264
3278
3307
3328
💡 Key Support Levels:
3241
3207
3196
3172
3156
🎯 Trade Setup:
BUY SCALP:
Entry: 3196 – 3164
SL: 3190
TP: 3200 → 3204 → 3208 → 3212 → 3216 → 3220
BUY ZONE:
Entry: 3158 – 3156
SL: 3152
TP: 3162 → 3166 → 3170 → 3174 → 3178 → 3182 → 3190
SELL SCALP:
Entry: 3278 – 3280
SL: 3284
TP: 3274 → 3270 → 3266 → 3260 → 3250 → 3240
SELL ZONE:
Entry: 3328 – 3330
SL: 3334
TP: 3324 → 3320 → 3316 → 3312 → 3308 → 3300 → 3290 → 3280
📅 Key Event: CPI Announcement
Today, we are also expecting the CPI report, a critical piece of data for the month. Be aware that there’s not much to analyze yet regarding this report, but we will update everyone once the data comes out later today.
💼 Risk Management:
Given the volatility we’re seeing, proper risk management is essential. Stick to your TP/SL levels to protect your account and avoid unnecessary risks.
📈 Final Thoughts:
Gold is currently facing corrections, but with geopolitical tensions easing, it could lead to more stability and potential breakout opportunities. Keep your trades aligned with key levels and macro news. Keep an eye on CPI and adjust accordingly.
💬 Good luck to everyone! Keep your positions safe and be patient for the right opportunities.

"XAUUSD at Critical Support – Bullish Continuation or Pullback 🔍 Market Overview
The chart shows a technical setup with clear support and resistance zones, alongside key Exponential Moving Averages (EMAs) to guide directional bias.
📊 Key Technical Levels
Resistance Zone: ~$3,445–$3,460
This is a historically reactive area where price has reversed sharply in the past. A breakout above this zone would suggest strong bullish continuation.
Strong Supporting Zone: ~$3,375–$3,390
Currently being tested. If the price holds here, it could act as a launchpad for a bullish move toward resistance.
Support Zone: ~$3,320–$3,340
If the strong support breaks, the next downside target would be this zone, which aligns with the 200 EMA (blue line) — a dynamic support level.
📈 Moving Averages
50 EMA (Red): Currently at $3,345.60, serving as a short-term dynamic support.
200 EMA (Blue): Currently at $3,304.13, marking a critical longer-term support. Price staying above this EMA reflects a bullish bias.
🔀 Probable Scenarios
Bullish Case (Preferred Scenario)
If price holds the strong supporting zone and breaks above current highs (~$3,395), it could rally toward the resistance zone at $3,445–$3,460.
Break and close above resistance may open the door for further upside continuation.
Bearish Case
A rejection from current levels or a break below $3,375 would likely lead to a retracement toward the support zone ($3,320–$3,340).
A break below the support zone and the 200 EMA would shift the structure into bearish territory.
✅ Bias & Recommendation
Current Bias: Cautiously Bullish
As long as the price remains above the strong supporting zone and 50 EMA, bulls have the upper hand.
Look for confirmation with a higher low or bullish engulfing candle before entering long.
Trade Idea:
Long Entry: On bullish confirmation above $3,395
Target: $3,445–$3,460
Stop Loss: Below $3,375 (support break)

Gold Breaks Support Level – The Downtrend May Not StopAfter peaking at $3,500/ounce in April, gold is in a clear correction phase. On the H4 chart, the price has broken through both the EMA34 and EMA89, indicating that a short-term downtrend has been established. The most recent session closed at $3,223, losing nearly $130 in just a few sessions.
The sharp decline appeared after a long rally and the peak was rejected many times. The break through the EMA89 support has triggered technical selling pressure, reflecting the psychology of profit-taking after failing to surpass the old peak.

Gold falls after FED news, cautious buying powerWorld gold prices retreated to $3,370/ounce, down more than $25 from last night's peak. The H4 chart shows a sharp decline that broke through the EMA34, currently testing the EMA89 - a signal that profit-taking pressure is increasing after the previous strong bounce.
The FED kept interest rates unchanged in the 4.25% - 4.5% range, as expected. However, Chairman Jerome Powell's "wait and see" statement made investors pause buying gold due to concerns that prolonged high interest rates will continue to put pressure on non-yielding assets like gold. In addition, the rise in international stocks and China's money pumping policy have reduced the attractiveness of this safe haven.

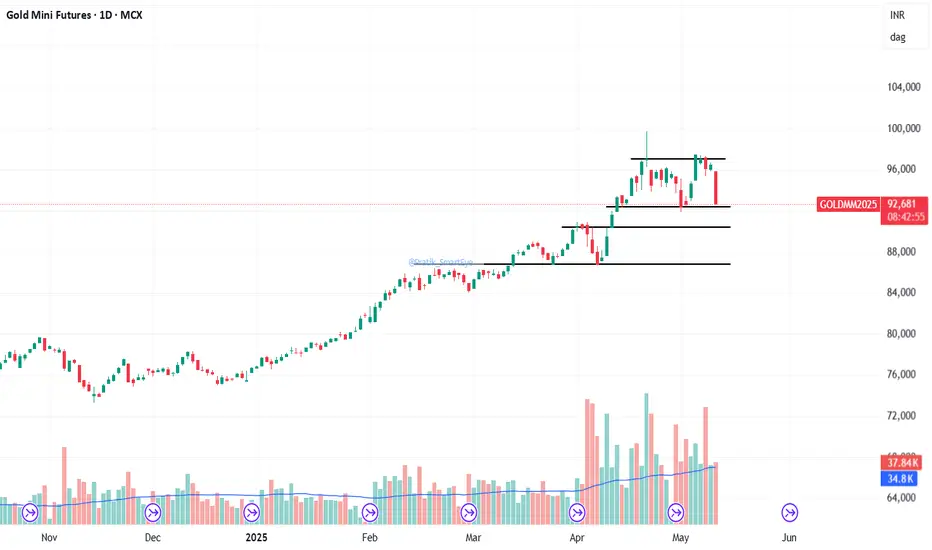
Gold: CMP 92,800. Forming a double top pattern. Gold: CMP 92,800. Forming a double top a bearish pattern. Break below 92,300 will take it to support levels of 90,400 / 86,800.
It's a Technical View.
Sustained reversal from support levels can be an addition point.
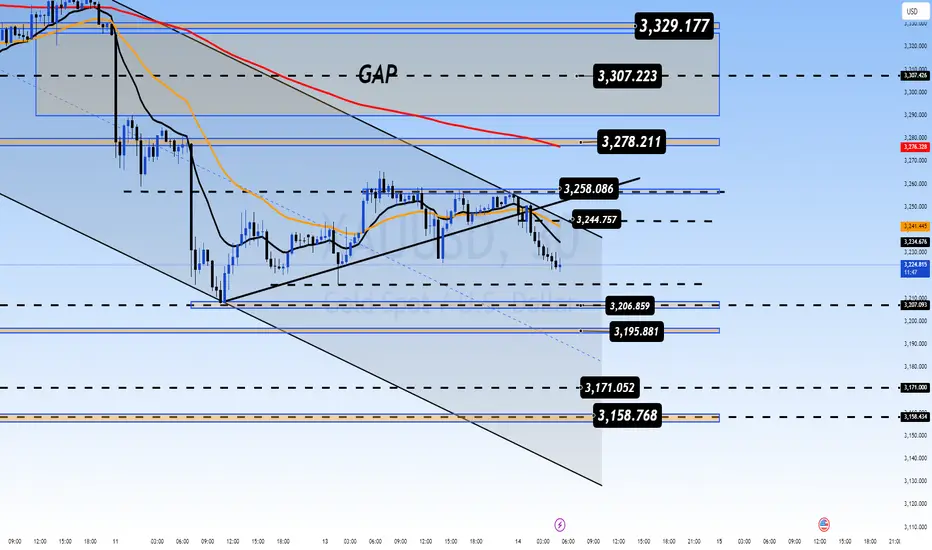
GOLD PRICE PLUNGES ON WEEKLY OPEN RETRACEMENT OR NEW BEAR TREND?📉 GOLD PRICE PLUNGES ON WEEKLY OPEN – RETRACEMENT OR NEW BEAR TREND?
Gold started the week with a sharp gap down, breaking below key levels after weekend developments signaled easing geopolitical tensions and positive progress in US-China trade talks. This calm has dampened safe-haven demand, triggering an aggressive selloff in early Asian hours.
🔍 Technical Outlook – M30 Parallel Channel
Gold is currently respecting a descending parallel channel on the M30 chart. Price is pushing lower and has yet to fill the weekend’s gap around the 3326–3328 zone. This remains a critical Key Level for any potential short-term recovery.
🗓️ This Week’s Macro Focus
Traders should brace for high volatility as the US economic calendar is packed with top-tier releases:
Tuesday: CPI (Consumer Price Index)
Thursday: PPI (Producer Price Index)
Thursday Night: Fed Chair Powell speaks
Meanwhile, ongoing tariff policy updates and geopolitical headlines will continue to stir price action unpredictably.
📌 Trading Bias
For now, the dominant trend is bearish. Unless we see a strong bullish reversal pattern or key breakout confirmation, the preference remains selling on rallies. Only if buyers reclaim control around the gap zone (3326–3328) should we look for long setups.
🔺 Key Resistance Levels:
3288 – 3308 – 3328
🔻 Key Support Levels:
3262 – 3246 – 3236 – 3200
🎯 Trade Setups
🔵 BUY ZONE: 3246 – 3244
SL: 3240
TP: 3250 → 3254 → 3258 → 3262 → 3266 → 3270 → 3280
🔴 SELL ZONE: 3326 – 3328
SL: 3332
TP: 3322 → 3318 → 3314 → 3310 → 3305 → 3300
🔴 SELL SCALP: 3306 – 3308
SL: 3312
TP: 3300 → 3296 → 3290 → 3286 → 3282 → 3278 → 3270
⚠️ Final Thoughts
Gold remains highly reactive to macro news and liquidity traps, especially with so many risk events this week. Trade with caution, follow your TP/SL rules, and stay flexible with your strategy. The market may deliver unexpected volatility—manage your risk smartly.
🟡 Let price guide you — not emotions.
🚨 Stay disciplined. Stay profitable.

GOLD – BREAKOUT OR TRAP BEFORE THE WEEKEND?📊 GOLD – BREAKOUT OR TRAP BEFORE THE WEEKEND?
The gold market is showing significant liquidity sweeps this Friday. In the early Asian session, price pushed down to the 327x region, collecting liquidity, before swiftly rebounding. On the M30 chart, multiple Fair Value Gaps (FVGs) have formed and been filled — signaling accumulation and potential setup for a major move.
📉 Technical Perspective:
Gold has been moving within a parallel descending channel since yesterday. However, during the late Asian session, we saw the first signs of a possible breakout. If the candle closes above 3,324, this could confirm a breakout — at which point an early BUY entry on the retest would be ideal.
🔥 Fundamental Notes:
The market remains highly sensitive to geopolitical news, especially tensions between nations and potential tariff announcements from Donald Trump regarding China.
In this climate, trading based on key level reactions is safer than predicting direction. The zones 3,324 and 3,366 will be crucial decision points for bulls and bears. A breakout above 3,366 could shift the short-term trend bullish.
🔺 Key Resistance Levels:
3,345
3,364
3,395
🔻 Key Support Levels:
3,280
3,270
3,256
3,244
3,225
📈 Trade Setup – Friday Strategy:
🔵 BUY ZONE:
Entry: 3,280 – 3,278
Stop Loss: 3,274
Take Profits: 3,285 → 3,290 → 3,295 → 3,300 → 3,305 → 3,310 → 3,320
🔴 SELL ZONE:
Entry: 3,364 – 3,366
Stop Loss: 3,370
Take Profits: 3,360 → 3,356 → 3,352 → 3,348 → 3,344 → 3,340 → 3,330
✅ Final Note:
Fridays often bring sharp liquidity grabs. Stay cautious, especially with heightened geopolitical tension and pending policy statements from global leaders. Always respect your TP/SL zones to protect your capital.
📌 Let price lead. React to structure. Avoid chasing noise.
Wishing all traders a safe and profitable end of the week!

POST-FOMC MARKET OUTLOOK | Is Gold Poised for More Gains?🟡 GOLD 08/05 – POST-FOMC MARKET OUTLOOK | Is Gold Poised for More Gains?
After last night’s FOMC meeting, the outcome came in line with expectations — the Fed held rates steady at 4.25%–4.50% and maintained a hawkish tone. Powell reinforced that there is no urgency to cut rates and that future policy will depend on incoming economic data.
Despite some dovish hopes from the market, the Fed remained cautious — no pivot, no surprises.
🔥 Geopolitical Tensions:
Meanwhile, geopolitical stress between India and Pakistan is escalating again around the Jammu-Kashmir region. This could continue to act as a bullish driver for gold, especially in Asia where safe-haven demand is more sensitive to border conflicts.
🧠 Market View: BUY Setup Still Dominates
Over the past few sessions, gold has shown strong accumulation followed by solid bullish momentum. As long as candle structure remains healthy, buying dips near 338x–336x remains the preferred strategy.
However, if an unexpected catalyst drives a breakdown below 336x with confirmation from candle close, this could invalidate the short-term bullish bias and open the door for a sell setup, targeting the large liquidity gap between 3354 to 3340.
Until then, trade the range — respect top and bottom of key intraday zones.
📉 TECHNICAL ZONES TO WATCH:
🔺 Resistance Levels:
3396
3408
3430
3455
🔻 Support Levels:
3384
3366
3354
3334
🎯 Trade Plan:
🔵 BUY ZONE: 3336 – 3334
SL: 3330
TP: 3340 → 3344 → 3348 → 3352 → 3356 → 3360
🔴 SELL ZONE: 3430 – 3432
SL: 3436
TP: 3426 → 3422 → 3418 → 3414 → 3410 → 3400
⚠️ Key Event Ahead:
Today’s US session brings the Unemployment Claims report — known to trigger high volatility in precious metals. Stay alert, and always wait for confirmation candles before executing trades near critical zones.
✅ Follow for real-time updates and mid-session trade setups.
💬 Drop your view in the comments below – are we going to break higher or revisit liquidity zones?

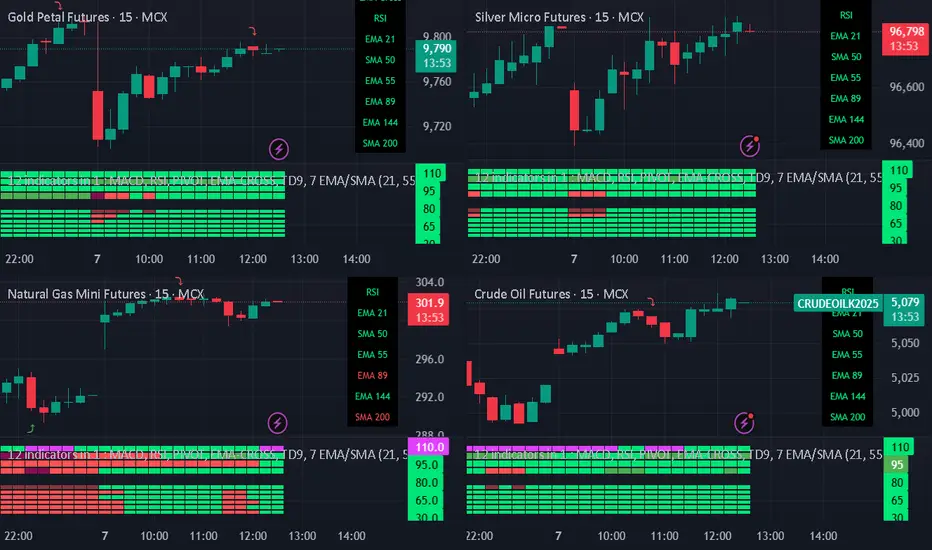
Best Commodity layoutBest Commodity layout
Crafting Your Optimal Commodity Technical Chart Layout in TradingView
The "best" commodity technical chart layout in TradingView is highly personalized, depending on your trading style, strategy, and the specific commodities you're analyzing. However, a well-structured layout should provide a clear, comprehensive view of price action and key technical indicators to aid in decision-making.
Here's a guide to creating an effective commodity technical chart layout in TradingView, incorporating common practices and versatile tools:
1. Choosing Your Main Chart Type:
Candlestick Charts: This is the most popular choice for most traders. Candlesticks provide detailed information about the open, high, low, and close (OHLC) prices for a specific period, making it easier to identify patterns and market sentiment.
Bar Charts: Similar to candlesticks, bar charts also display OHLC data but in a different visual format.
Line Charts: Useful for a quick overview of the overall trend, typically plotting the closing prices.
Heikin Ashi: These charts can help filter out market noise and make trends easier to identify by averaging price data.
Renko or Kagi Charts: These focus solely on price movement, ignoring time, and can be useful for identifying support and resistance levels.
Recommendation: Start with Candlestick charts for their detailed information. You can always switch to other types for different analytical perspectives.
2. Essential Technical Indicators for Commodities:
While the "best" set of indicators is subjective, here are some widely used and effective ones for commodity analysis in TradingView:
Moving Averages (MAs):
Types: Simple Moving Average (SMA) and Exponential Moving Average (EMA) are common. EMAs react faster to recent price changes.
Use: Identify trend direction, support/resistance levels, and potential crossover signals. Common periods include 20, 50, 100, and 200.
Layout: Add 2-3 MAs of different lengths directly onto your main price chart. For example, a 21-period EMA for short-term trends and a 50-period EMA for medium-term trends.
Volume Indicators:
Types: Volume (displays trading activity) and On-Balance Volume (OBV).
Use: Confirm the strength of price movements. A significant price move accompanied by high volume is generally considered more valid.
Layout: Typically displayed in a separate pane below the main price chart.
Oscillators (for identifying overbought/oversold conditions and momentum):
Relative Strength Index (RSI): Measures the speed and change of price movements. Values above 70 often indicate overbought conditions, while below 30 suggest oversold conditions. Standard period is 14.
Moving Average Convergence Divergence (MACD): Shows the relationship between two moving averages of an asset's price. It consists of the MACD line, signal line, and histogram.1 Used for trend identification and momentum.
1.
medium.com
medium.com
Stochastic Oscillator: Compares a particular closing price of an asset to a range of its prices over a certain period. Also used to identify overbought/oversold conditions.
Commodity Channel Index (CCI): Identifies cyclical trends and can signal overbought/oversold levels.
Layout: Oscillators are usually placed in separate panes below the main chart. You might choose 1 or 2 that best suit your strategy (e.g., RSI and MACD).
Volatility Indicators:
Bollinger Bands: Consist of a middle band (typically an SMA) and two outer bands representing standard deviations. They help identify volatility and potential price breakouts or mean reversion.
Keltner Channels: Similar to Bollinger Bands but use Average True Range (ATR) for the outer bands. Can be used for breakout and trend-following strategies.
Average True Range (ATR): Measures market volatility. Useful for setting stop-loss orders.
Layout: Bollinger Bands and Keltner Channels are overlaid on the main price chart. ATR is usually in a separate pane.
Trend-Following Indicators:
Ichimoku Cloud (Ichimoku Kinko Hyo): A comprehensive indicator that defines support/resistance, identifies trend direction, and provides trading signals. It includes several components like the Kumo (Cloud), Tenkan-sen, and Kijun-sen.
Donchian Channels: Plots the highest high and lowest low over a set period. Useful for identifying breakouts and trend direction.
Layout: Ichimoku Cloud and Donchian Channels are overlaid on the main price chart.
Recommendation for a Balanced Layout:
Main Chart: Candlesticks, 2-3 EMAs (e.g., 21, 50, 200), Bollinger Bands or Keltner Channels.
Pane 1 (below main): Volume.
Pane 2 (below main): RSI (14) or MACD.
Pane 3 (optional): CCI or ATR if your strategy heavily relies on them.
3. Drawing Tools:
Effective use of drawing tools is crucial for technical analysis:
Trendlines: Connect swing highs or lows to identify the direction and strength of trends.
Support and Resistance Levels: Horizontal lines drawn at key price levels where the price has historically struggled to break above (resistance) or fall below (support).
Fibonacci Retracement and Extension Levels: Help identify potential support/resistance levels and price targets based on Fibonacci ratios.
Channels: Parallel trendlines that can define a price range.
Chart Patterns: Use tools to identify patterns like head and shoulders, triangles, flags, and pennants.
Layout Tip: Keep your most frequently used drawing tools easily accessible in the TradingView drawing panel.
4. Multi-Timeframe Analysis & Multi-Chart Layouts:
Analyzing commodities across different timeframes can provide a broader market perspective. TradingView allows you to set up multi-chart layouts (the number of charts available depends on your subscription plan).
Common Setup:
Chart 1 (Long-Term): Weekly or Daily chart to identify the major trend.
Chart 2 (Medium-Term): 4-hour or Daily chart for more detailed trend analysis and identifying key levels.
Chart 3 (Short-Term): 1-hour or 15-minute chart for entry and exit signals.
Synchronization: TradingView allows you to synchronize symbols, crosshair, interval, and drawings across multiple charts in a layout, which can be very efficient.
5. Customization and Saving Your Layout:
Appearance: Customize chart colors (background, candles, grids), scales, and lines to your preference for better visual clarity and reduced eye strain. Access these via Chart Settings (the gear icon).
Saving Layouts: Once you have a setup you like, save it as a chart layout in TradingView. You can create multiple layouts for different commodities, strategies, or analytical purposes.
Indicator Templates: Save combinations of indicators as templates for quick application to new charts.
Tips for the "Best" Layout:
Keep it Clean: Avoid cluttering your chart with too many indicators. Focus on a few that you understand well and that complement your strategy.
Consistency: Use consistent settings for your indicators across different charts and timeframes.
Practice: The "best" layout is one that works for you. Experiment with different indicators and setups on a demo account or through backtesting to see what yields the best results for your trading style.
Stay Informed: Be aware that some commodities (e.g., agricultural products) can be influenced by seasonal patterns or specific reports (like USDA reports for crops, EIA for oil). While not a direct part of the "chart layout," integrating this knowledge with your technical analysis is crucial. TradingView has features to display key events like earnings reports or dividends, which can be relevant. Some community scripts on TradingView even offer overlays for planting and harvesting seasons for agricultural commodities.
By following these guidelines and experimenting to find what suits your individual needs, you can create a powerful and effective commodity technical chart layout in TradingView. Remember to regularly review and refine your layout as your trading strategies evolve.