Gold Breaks Below 3000: Weekly Support at 2950-60 Now CriticalGold is showing weakness and breaking down supports on daily closing basis, as expected and explained in my previous posts and weekly analysis video. Gold has now trading below two major support levels - the first at 3050-60 and the second at 3000-20. Yesterday price closed under 3000 on a daily basis, which clearly signals weakness in the market.
As discussed in my weekly analysis video, price is now testing the first weekly support at the 2950-60 area. I've made some changes to my mapping based on recent price action. Previously, I expected price to hold at 3000 on daily charts, but since it has already closed below 3000, we now need to watch the 2950-60 zone for possible retracement/pullback signs.
I expect this pullback to begin soon (within the next 2-4 trading days), and during this period, I anticipate gold will maintain its weakness/correction trend.
Gold

Gold hits important support. Is the downtrend over?
📊 Trump's "reciprocal tariffs" policy is affecting the entire financial market in general and gold prices in particular. The trade war is approaching and the market continued to fall sharply on Monday. Not staying out of the game, OANDA:XAUUSD is also inevitable to sell off when market volatility increases. Let's analyze the next developments of gold from the perspective of **Technical Analysis:** and the opportunity to find profits at this time:
🔹 **Frame D**: After 3 consecutive days of decline, FOREXCOM:XAUUSD prices have temporarily maintained the upward price trend. And currently the price is at an important support area, the old peak area 1 month ago. Whether the correction ends here or not, we will need to consider further in the next time frames
🔹 **H4 frame**: The important key zone has been broken, the bearish price structure has not changed, it is not yet possible to confirm that this downtrend has ended.
🔹 **H1 frame**: The bearish price structure is very clear, however, the selling force is not as strong as before. The support area still brings a cautious mentality to the bears, plus the profit-taking action for SELL positions after the past 3 days.
✅**Trading plan:*
Looking at the price structure, although the price is at an important support area, we are still not sure that this downtrend has ended, so the BUY option will not be considered. However, the current area is no longer suitable for setting up a SELL position. The priority at the moment is to wait for the price to return to the marked resistance area to TRADE WITH THE MEDIUM TERM TREND. The market volatility is very high at the moment so pay attention to reduce the corresponding Volume and Stoploss with the loss you can accept.
💪 **Wishing you success in achieving profits!**

Gold Daily Rejection at ATH Signals Potential Correction Phase?The price has entered the projected topping zone that we discussed in previous posts, with increased volatility in the 3,100-3,150 range. This aligns perfectly with earlier forecast. The current situation presents two likely scenarios:
Scenario 1: Pullback and Double Top
If bears manage to keep the price below the previous day's high , we could see a pullback to the first support area around 3,050-3,060. From there, price might bounce back up to retest the all-time high, forming a double top pattern before beginning a more significant move to lower levels.
Scenario 2: Direct Move to Major Support
Alternatively, we could see a more decisive move down, bypassing the intermediate support and heading directly to the high-volume support zone visible on the volume profile around 2,900-2,880.
for Intraday the Major Support is at 3100-3110 zone , resistance is at PDH.
Gold Price Analysis: Critical Test of 3000 Support Gold price has experienced significant downside movement from last week closing to current day opening, gold price breakdown the key support zone at 3050-3060 that had previously acted as a support for bulls. Today's decline has pushed price down to test a major second support area between 3000-3020, which appears to be a critical inflection point for future price direction.
Current Technical Situation
Price has broken the 3050-60 support area, which now becomes resistance
Price now Testing major support zone at 3000-3020
High volume nodes visible at current levels suggest a potential reaction point
Potential Scenarios
Bullish Case:
If bulls defend the major 3000-3020 support zone with a daily close above 3000
This would suggest the possibility of a pullback toward the previous support-turned-resistance
Bearish Case:
Daily close below 3000 would indicate failure of major support
This could accelerate selling pressure toward the next support level around 2950
today's daily and this week close is particularly significant. A close above 3000 would maintain the possibility of a recovery/consolidation phase, while a close below could invite further technical selling. The volume profile suggests substantial interest at current levels, which could provide the necessary support for a potential bounce if buyers step in.
Monitor price action closely around the 3000 psychological level, as this round number also aligns with technical support and could prove decisive for near-term direction.

GOLD WEEKLY OPEN – Sellers Hit Early, But Market Psychology🟡 GOLD WEEKLY OPEN – Sellers Hit Early, But Market Psychology Will Lead the Way
Gold kicked off the new week with a sharp drop during the Asian session, falling over 40 points from the previous highs (around 3018) down into the 297x zone. This reflects lingering sell pressure from the previous week’s volume.
However, gold quickly bounced back by nearly 40 points, confirming strong buy interest around 297x — a key level on the higher timeframes.
📌 This 297x zone is a critical support on H4/D1. A confirmed break below it could open the door for a deeper sell-off into 295x and beyond.
🔍 Technical Overview:
The broader trend on H4 and D1 still leans bullish.
However, psychological reactions from market participants are currently stronger than clean technical patterns.
On H1 and H2, price is now reacting to the 0.5 Fibonacci retracement.
A close below 3030 could trigger a renewed bearish move toward the 295x target.
🧠 Sentiment Will Drive Direction:
So far, only Asian and Australian sessions have participated.
We’ll need to monitor the London & US sessions closely to confirm directional conviction.
This is a sentiment-led market, not one purely ruled by structure → only trade from key zones with clean reaction signals.
🧭 KEY PRICE LEVELS:
🔺 Resistance:
3055 – 3076 – 3107
🔻 Support:
3024 – 3005 – 2970 – 2952
🎯 TRADE PLAN
🟢 BUY ZONE: 2980 – 2978
SL: 2974
TP: 2984 – 2988 – 2992 – 2996 – 3000
🔴 SELL ZONE: 3076 – 3078
SL: 3082
TP: 3072 – 3068 – 3064 – 3060 – 3056 – 3050
📅 Important this week:
Major data coming: CPI – PPI – FOMC Speeches → Expect potential spikes midweek. Stay alert, and I’ll update key reaction zones as the sessions unfold.
Stick to clear plans and always use TP/SL — capital protection comes first.
Good luck team,
— AD | Money Market Flow

This chart shows a potential bullish setup for Gold (XAUUSD) on This chart shows a potential bullish setup for Gold (XAUUSD) on the 15-minute timeframe, with some key technical elements and a projected trade idea. Here's a breakdown of the analysis:
1. Current Market Overview
Price: Trading around $3,038.51.
Trend: Recent downtrend followed by a minor recovery.
Indicators:
EMA 200 (Blue): Currently at $3,090.41, acting as a dynamic resistance.
EMA 30 (Red): Positioned below the EMA 200, indicating a still bearish trend but with potential for a pullback.
2. Key Zones & Labels
Limit Entry Zone: Highlighted around $3,025.72 (bottom purple zone)
Labeled as “LIMIT ENTRY”, indicating a potential buy entry.
This area corresponds with a fair value gap (fvg) — often used in smart money concepts as a sign of institutional interest.
Target Zone: Around $3,082.22 (top purple zone)
Labeled as “target point EA”.
Lies just below the EMA 200 resistance level, which is a likely take-profit area for a bullish move.
3. Projected Price Action
A possible bullish retracement is anticipated:
Dip into the limit entry/fvg zone at ~$3,025.
Then, a rally targeting the $3,082 zone, possibly extending toward the EMA 200 at ~$3,090.
4. Trade Setup (Based on the Chart)
Entry: Around $3,025.72 (limit buy)
Target: Between $3,082.22 - $3,090.41
Risk: Likely below the FVG zone (~$3,015–$3,020), depending on risk appetite.

XAU/USD Holding Above $3,050 – Breakout or Pullback Next?XAU/USD Update 📊
Gold just touched $3,061 and is now hovering around $3,056. Price is holding within the ascending channel, showing signs of consolidation.
🟢 Bullish Scenario: If buyers defend this level, we could see another push toward $3,100+, with $3,153 still in play as a key resistance.
🔴 Bearish Risk: A break below $3,050 - $3,020 could trigger a deeper correction toward $2,980, where stronger demand may step in.
📉 Watching price action closely—let’s see how it reacts from here! 🚀

GOLD CRASHES HARD — BUT THE BIG SHORT VIEW WAS ALREADY 🟡 GOLD CRASHES HARD — BUT THE BIG SHORT VIEW WAS ALREADY IN PLAY
Gold dropped — and dropped even harder than expected.
But for those following closely, this wasn’t a surprise.
From the start of April, we had been watching for signs of reversal after gold kept printing new ATHs. The candlestick behavior on the higher timeframes was already hinting at exhaustion — and today’s move validated that broader view.
🔍 Why I’ve Been Calling for a BIG SHORT — Not Just in Gold
This isn’t just about XAUUSD.
Zoom out and you’ll see the signs across the board:
US, EU, and Asian stock markets are in a steep decline
Crypto is stagnant, with no new capital inflow and little investor interest
And gold — after a historic run — is now facing intense profit-taking pressure, especially under growing geopolitical and global trade risks
In this environment, many investors are moving to cash and staying on the sidelines.
📉 DXY: A Potential Comeback?
The USD Index (DXY) has been heavily sold off in recent months.
But if you look closely — it's now testing a multi-year support zone that's held strong for nearly 3 years.
AD’s view?
If this level holds — and if recent tariff policies + international pressure from Trump continue — we could see a real USD recovery in the coming weeks.
Trump appears to be playing hardball — not just for his own benefit, but strategically for the U.S.
His aggressive trade moves are forcing nations to reconsider tariff terms. And in the short term, that puts Trump in a position of power — globally.
🤔 The Fed’s Dilemma
Even as Trump escalates trade pressure, the Fed remains cautious.
They’ve held back from rate cuts — waiting for clearer outcomes from these global negotiations.
All eyes are now on Trump’s next moves — and how other major economies will respond.
🔮 Strategy Moving Forward
Many investors are still in risk-off mode, hoarding cash and waiting for further declines.
AD still expects further downside in gold next week, alongside a potential short-term bounce in DXY.
→ After that, once the trade talk dust settles, we could very well see Gold resume its climb, while USD retests major supports on the D1 timeframe.
📌 I’ll be back with a full weekly outlook tomorrow, but for now — absorb this Gold/USD landscape and build your strategy for the new week.
Stay sharp & protect your capital.
— AD | Money Market Flow

GOLD LONG/SHORT POTENTIAL TRADE SETUPS WITH GOOD R:RHigh Volatility & Price Sensitivity
Historical price action shows aggressive rejections from these levels, confirming their importance.
These zones act as magnetic levels where price either reverses or experiences momentum-based breakouts.
Zone Bounce & Breakout Strategies
Zone Bounce: Entry is planned when price touches the demand zone for buying or the supply zone for selling, expecting a reversal.
Fresh Zone Breakout: If price breaks above a fresh demand zone with volume confirmation, it signals bullish continuation. The opposite applies to supply zones.
Entry & Execution (5-Minute Timeframe)
The 5-minute timeframe allows precision-based entries with minimal drawdown.
Candlestick confirmation, such as pin bars, engulfing patterns, or wicks rejecting the zone, enhances trade validity.
Risk Management & Stop-Loss Placement
Stop-losses are placed slightly beyond the zone to account for false breakouts.
Take-profit targets are set at the nearest structural level or swing high/low for optimal risk-reward management. Happy Trading
Gold Rollercoaster Day: Powell Speech, Jobs Report, and TariffGold Price Action Analysis: End of First week of April
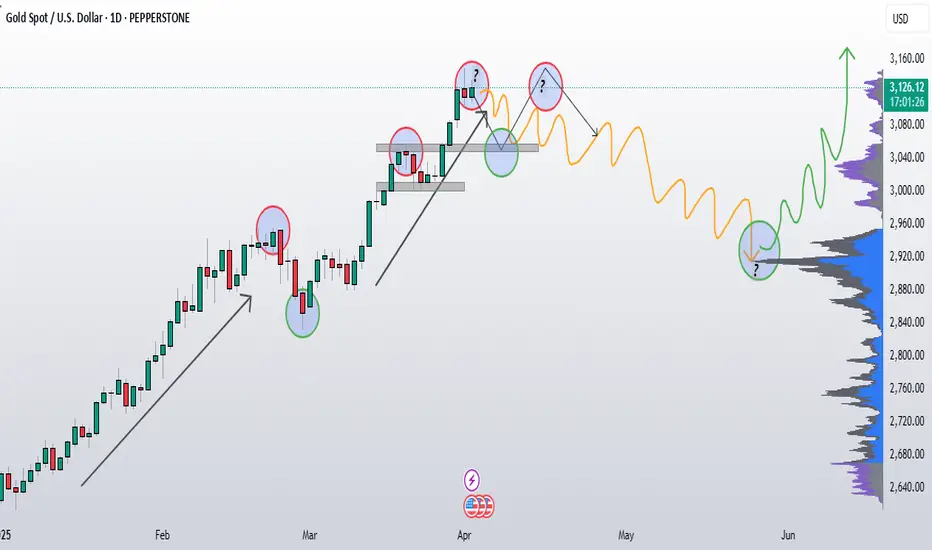
Gold appears to have reached a potential top area (marked by the first red circle on the chart tat we discussed in previous posts). Price then retested the major support zone between 3050-60 (grey rectangle) and following my mapping so far in very precise way.
Current Technical Situation
The daily close above 3,100 is significant as it suggests bulls haven't completely lost control despite the recent pullback. This level now serves as immediate support, and holding above it keeps the bullish structure intact for now.
Potential Scenarios
1. Double Top Formation: The most notable pattern developing is a potential double top structure. If price rallies back up to test recent highs (marked with "Double Top/ Failed New High?" in the second red circle), but fails to break through convincingly, we could see a more significant correction.
2. Consolidation Phase: After the strong rally from March, gold may need time to digest these gains. The price action suggests we might be entering a period of consolidation with range-bound movement between support (3,050-60) and resistance (3,125-50).
Volume Analysis
The High Vol Area marked on the right side of the chart indicates significant market participation at these levels, which often serves as price magnets (and now going to act as resistance on Daily TF) during consolidation phases.
Looking Forward
Watch the 3,100 level closely - a break below(Day Close) could accelerate selling....
If price approaches the previous high again, pay attention to momentum and volume to assess if it's a genuine breakout or a double top trap
Overall outlook: Correction to consolidation phase likely in the near term.

TRADE WAR STORM BREWING – IS A GLOBAL BIGSHORT COMING?🚨 TRADE WAR STORM BREWING – IS A GLOBAL BIGSHORT COMING?
In the past 24 hours, global financial markets have been rocked by the shock announcement of Trump’s aggressive global tariff policy. This isn’t just a geopolitical maneuver — it’s a potential trigger for massive systemic volatility, affecting everything from U.S. equities to Gold, DXY, crypto, and major global indices in Asia and Europe.
🔍 What Just Happened?
We saw Gold crash over 100 points, a move that caught many traders off guard. Under normal circumstances, a weakening USD would be bullish for Gold. But here’s the twist: the Dollar also dropped sharply, yet Gold was still aggressively sold off.
Why?
👉 A plausible explanation is that major funds and investors liquidated their Gold positions to cover equity losses or to meet margin calls from collapsing positions across other markets.
This is no ordinary move — it may well be the beginning of a “BIGSHORT” phase across global assets.
🧨 This Is Just the Beginning
The market reaction suggests that we are not in a routine correction. Instead, we may be witnessing the early stages of a coordinated risk-off movement — one sparked by fears of a new global trade war with far-reaching implications.
Tariffs on aluminum, steel, manufacturing goods, and industrial inputs have already disrupted entire supply chains. Industry-specific disruptions (e.g. construction, healthcare, utilities, wholesale) are beginning to show — this is not a drill.
📉 U.S. Macro Data Is Getting Worse
The headline inflation data in the U.S. continues to fall, but other economic indicators are flashing red:
ISM Services PMI (Mar): 50.8 (vs. 53.0 expected)
Employment: 46.2 (prev: 53.9) — a sharp drop
New Orders: 50.4
Export Orders & Backlogs: Both declined significantly
👉 The ISM Services sector represents more than 70% of U.S. GDP. A reading this weak suggests that the U.S. economy may be slowing faster than expected.
🧠 Market Sentiment Is Shaky
Fear is back. And worse: FOMO and panic are driving decisions, not logic.
Retail and institutional traders alike are struggling to digest the overlapping risks: tariffs, inflation uncertainty, interest rates, and recession fears.
Tonight brings another major catalyst:
📆 Nonfarm Payrolls (NFP) — a key employment report that could reinforce or break the current narrative.
🏦 Will the Fed Cut Rates Earlier Than Expected?
Here’s what markets are now pricing in:
Rate cuts may start as early as May or June 2025
Probabilities have risen for 2–4 rate cuts this year, compared to 2 cuts expected previously
Odds of a summer pivot are now well above 50%
If the Fed sees continued weakness in labor and services, it may have no choice but to cut earlier — regardless of inflation progress.
⚠️ Strategic Takeaway: Watch, Don’t Chase
Before looking for entries, take a breath.
This is a time when doing nothing might be the smartest trade.
“Sometimes, staying on the sidelines is how you survive the storm.”
Let the volatility play out — and prepare for high-probability setups, not emotional trades.
📊 TECHNICAL LEVELS TO WATCH
🔺 Resistance Levels:
3110 – 3119 – 3136 – 3148 – 3167
🔻 Support Levels:
3086 – 3075 – 3055 – 3040 – 3024
BUY ZONE: 3056 – 3054
SL: 3050
TP: 3060 – 3064 – 3068 – 3072 – 3076 – 3080
SELL ZONE: 3148 – 3150
SL: 3154
TP: 3144 – 3140 – 3136 – 3132 – 3128 – 3124 – 3120
💬 Final Thoughts
The combination of geopolitical tariffs, recession fears, and Fed policy uncertainty has created a perfect storm across global markets.
We’re entering a phase where any careless trade can wipe out weeks of progress. Be cautious. Stay informed. Wait for clarity before going big.
📌 As for Gold:
Are we seeing just a pullback — or is this the calm before an ATH breakout?
Stay sharp. Set clear SL/TP. Follow the macro, respect the chart — and most importantly, don’t trade scared.
🧠 Patience is profit. Let the market come to you.

Gold (XAU/USD) Technical Analysis: SMC Trading point update
This chart is a technical analysis of Gold (XAU/USD) on a 4-hour timeframe. Here’s a breakdown
1. Ascending Channel:
The price is moving within an upward channel, showing a bullish trend.
Higher highs and higher lows confirm the uptrend.
2. Support and Resistance Zones:
Yellow Boxes: Key support zones where price previously consolidated before moving higher.
Red Arrows: Marking resistance zones where the price faced rejection.
Green Arrows: Indicating support levels where the price bounced.
3. Current Price Action:
Price recently dropped to a key support zone (around $3,050).
A bullish reaction is expected from this level.
If support holds, the price may continue the uptrend toward the target of $3,186.
4. Projected Move:
The black zigzag line suggests a potential bounce from support.
If the support level holds, price could move back up within the channel.
Mr SMC Trading point
Conclusion:
If price respects the support zone, there could be a good buying opportunity.
A break below the support zone would signal potential bearish movement.
Monitoring price action around the yellow zone is crucial for confirming direction.
Pales support boost 🚀 analysis follow )

GOLD ANALYSIS – NEW ATH AFTER TRADE TARIFF SHOCK!📊 GOLD ANALYSIS – NEW ATH AFTER TRADE TARIFF SHOCK!
Former U.S. President Donald Trump has officially announced a comprehensive global tariff policy, targeting multiple countries and regions. This unexpected move triggered strong risk-off sentiment, resulting in:
📉 Massive asset sell-offs
💵 A sharp decline in USD strength
🪙 And another all-time high (ATH) for GOLD
Gold broke out aggressively from a long-standing sideways triangle pattern, confirming strong bullish momentum. The counter-tariff reactions from other countries were far more aggressive than forecast, further fueling gold’s safe-haven appeal.
🔍 Technical Perspective
Yesterday, we successfully identified and traded within the triangle pattern by connecting recent highs and lows. The breakout came exactly as expected, especially nearing the end of the consolidation range — a classic price behavior traders should always watch for!
Now that the breakout has occurred, our focus shifts to BUYING on a retest of the breakout zone. Early entries during the Asian and European sessions are preferred, while we’ll reassess during the U.S. session due to upcoming economic data.
🔔 Note: With major events like Nonfarm Payrolls (NFP) coming soon, stay alert for volatility and unexpected moves.
📌 Key Resistance Levels:
3167 (ATH) - 3175 - 3185 - 3198 - 3206 (psychological/Fibonacci extensions – wait for candle confirmation)
📌 Key Support Levels:
3140 - 3132 - 3120
🎯 Trade Setups
BUY ZONE: 3132 – 3130
Stop Loss: 3126
Take Profits: 3136 – 3140 – 3144 – 3148 – 3152 – 3156 – 3160
SELL ZONE: 3185 – 3187
Stop Loss: 3191
Take Profits: 3180 – 3176 – 3172 – 3168 – 3160
⚠️ Final Notes:
The uptrend is clearly dominant — no need to FOMO sell at current highs. Be patient, wait for the market to reach key resistance zones (psychological or Fibonacci-based), then reassess.
📌 Avoid overtrading or aggressive selling — the tariff announcement is a global macro driver with deep market impact.
We’ll wait for Friday’s NFP to reassess broader sentiment.
As always: Respect your TP/SL levels to protect your capital.
Stay safe & trade smart! 💼📈

Gold short-term analysis: a new round of rise beginsPrecious metals benefited significantly from a sudden surge in risk aversion this week. U.S. President Donald Trump confirmed that reciprocal tariffs would be imposed on all countries on Tuesday, after hopes for a possible last-minute easing were dashed. Market tensions have risen significantly as the deadline approaches. Meanwhile, major banks remain bullish on the outlook for precious metals. Goldman Sachs Group Inc. sharply raised its gold forecast, predicting it will reach $4,500 by the end of the year.
Unexpected central bank demand and strong inflows into gold ETFs are the main factors supporting prices. U.S. Treasury yields gapped lower on Monday, approaching the March low of 4.172%. Market data shows that gold pricing has not only not become more expensive, but has become cheaper, suggesting that the market expects the current high to become the new normal and there is still room for upside in the future.
The 1-hour moving average of gold continues to cross upward and diverge. The support of the 1-hour moving average of gold has moved up to 3096, but gold is now far away from the moving average. So wait patiently for the adjustment and then continue to go long after stepping back. The 1-hour gold price fell to 3100 yesterday and stabilized again. So today, gold continues to go long on dips above 3100.
Don't guess the top of gold in a bull market. This is the best reflection of this year's market. The current market has hit a new high. For our intraday gold investment, I think we should continue to be bullish, because in the general direction, gold has completely broken through and stabilized above the 3100 mark. The trend in the first quarter showed a trend of exceeding strong rise, and the market continued to attack higher points above!
After gold stepped back, it hit a new high again. Gold bulls continued to be strong. Gold broke through 3127 again, so bulls were better and gold fell back to continue to be bullish. From the one-hour chart, gold broke through the new high in the morning and continued to rise, and the intraday 3127 line has turned into a support level. If it falls back to 3127 again, we will buy directly!
Key points:
First support: 3125, second support: 3113, third support: 3102
First resistance: 3148, second resistance: 3159, third resistance: 3170
Operation ideas:
Buy: 3120-3123, SL: 3112, TP: 3140-3150;

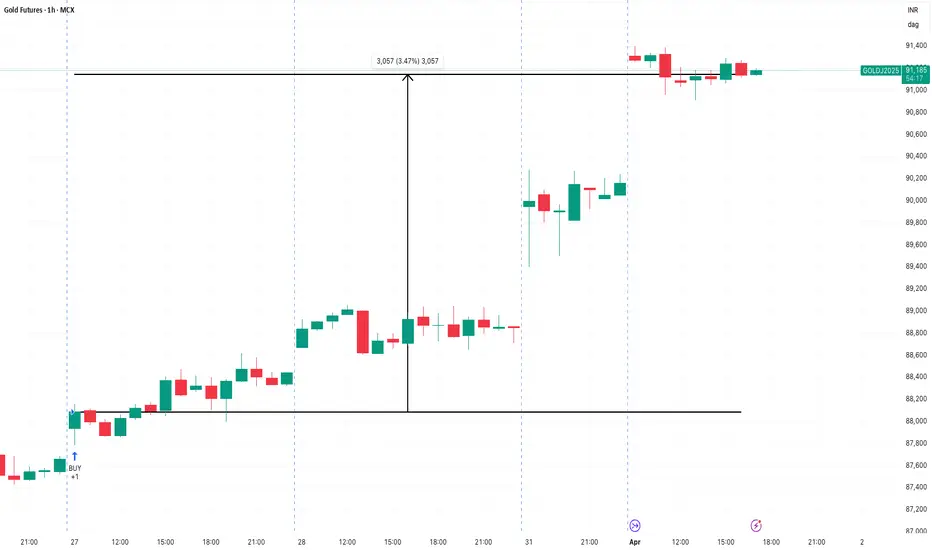
Gold – Bullish Trade Setup Using TTFIGold – Bullish Trade Setup Using TTFI
📉 Market: Gold
⏳ Timeframe: 1 Hr Chart
📊 Trading System: TTFI Trading System
🔍 Trade Idea Overview:
This analysis presents a Bullish Trade Setup identified using the TTFI Trading System.
📌 Entry Point:
A Buy signal was triggered near 88,088 confirming Upside momentum.
Gold Hits Projected Target ZoneThe price is currently within the projected topping area that I marked on chart and We're seeing increased volatility in the 3,100-3,150 zone, expecting that the bullish momentum may continue for another 1-2 days as no significant weakness is visible on higher timeframes,After the current push, expect the projected correction phase to begin and we have to wait for higher time frame to confirm this, This upcoming correction should be viewed as a healthy reset within the longer-term bull market rather than a trend reversal.

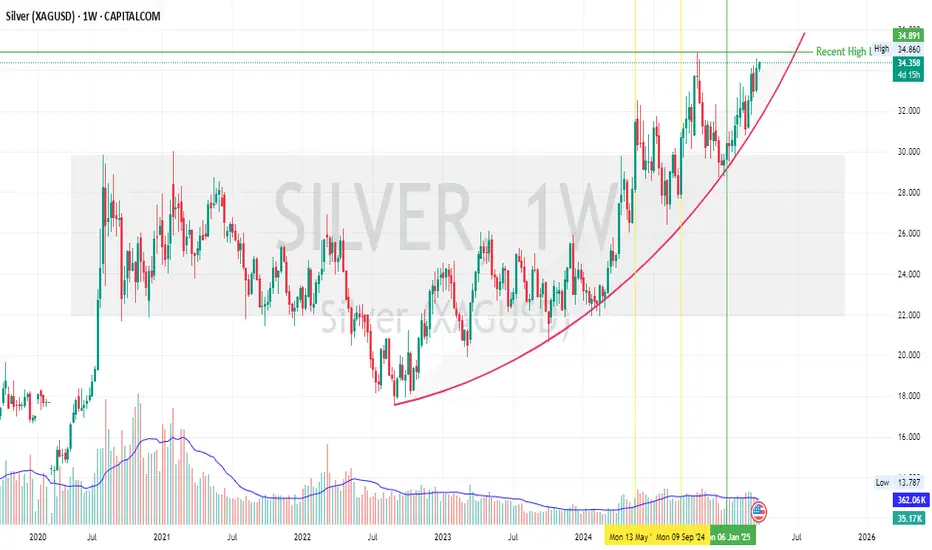
Silver Going Parabolic Silver tried to break out of the horizontal range thrice (marked on chart), but was finally successful only in its third attempt on 6th Jan 2025 and did a retest too.
Post 6th Jan 2025, Silver has been in uptrend keeping up with the Gold in terms of trajectory.
It looks like there is more room upwards as geopolitical events (Tariffs, trade wars etc) shape coming months and uncertainty remains high.
Lets see how it plays out.
Trade Safe
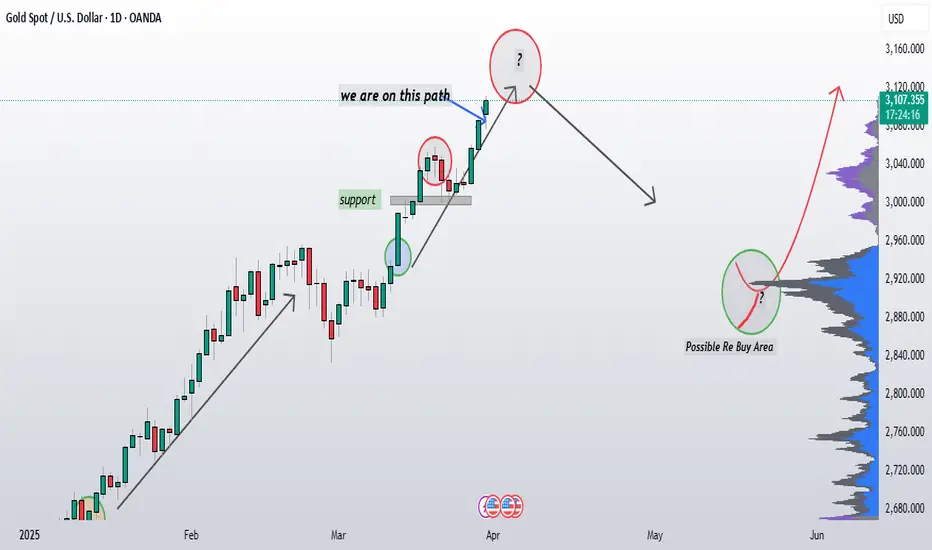
Gold target hit at 3100: Still looking strong My previously projected path from the beginning of the year has played out with remarkable accuracy, validating our bullish outlook since January 2025 and we have captured every buy move with great precision .
We've seen consistent higher highs and higher lows within this uptrend.Recent price action shows increased volatility near to current price zone 3100-10.
The market is now entering my projected topping area (red circle),The market has followed projected path and is now entering a critical decision zone (This week or next) after this I am expecting a subsequent correction phase as marked on chart.
GOLD – Unshaken Through Chaos - 50 new all-time highs🟡 GOLD – Unshaken Through Chaos | A Structural Bull Run Backed by Global Repricing
Gold isn’t just rallying — it’s sending a message.
Over the past 12 months, gold has set over 50 new all-time highs, a breakout sequence unmatched in over a decade. This is now officially the longest bullish streak in 12 years, and the third longest in modern history, only behind the volatile 1979–1980 period — a time when the global economy was grappling with runaway inflation, stagnant growth, and widespread unemployment.
But what makes this current bull cycle unique is not just the price action, but the structural shift behind the move.
📈 The Numbers Speak for Themselves:
YTD 2024 performance: +16%
12-month gain: +39%
Price range: From ~$1,200 to nearly $1,600/oz
3rd consecutive bullish year
These gains are not speculative pumps — they are a response to systemic instability. The macro backdrop is screaming uncertainty:
Sticky, structural inflation
Slowing global economic growth
Real interest rates still hovering around zero or negative
Geopolitical risk escalating in nearly every region of the world
This isn’t a short squeeze. It’s a capital migration.
🏦 The Central Bank Bid: The Silent Giant
What separates this rally from past cycles is who’s buying.
Unlike the 2011 gold run — driven heavily by retail FOMO and speculative ETF flows — today’s surge is institutionally anchored.
The strongest force in the current trend? Central banks.
Led by China, Russia, Turkey, and several BRICS nations, central banks have been accumulating gold at a record pace, shifting reserves away from USD exposure and hedging long-term geopolitical and economic risks. This isn't just diversification — it's a statement of monetary sovereignty.
Their consistent demand is forming a strong floor under price, insulating gold from violent retracements even during short-term corrections.
🔍 The Psychology of this Bull Market
This isn’t the kind of rally that fades on CPI noise.
The capital flow is defensive, not aggressive.
Funds are rotating into gold not to chase yield, but to preserve value. In times when fiat devaluation, sovereign debt instability, and political fragmentation are on the rise — gold doesn’t just shine, it leads.
The market is re-pricing systemic risk.
Investors are no longer reacting to inflation headlines. They are positioning for longer-term fragility in global monetary policy. That’s why even when inflation prints soften temporarily, gold still holds ground.
📌 What Comes Next?
Yes, technically, a pullback is healthy — even expected.
Extended breakouts are often followed by short-term consolidations. But the medium- to long-term structure remains intact.
Gold is not in a bubble. It’s in rotation.
In a world full of uncertainty, inflation volatility, and central bank crossfire — gold remains the most trusted asset for capital protection. And this rally? It’s not the end of something.
It’s just the beginning of a new monetary cycle.
— AD | Money Market Flow
📢 Join our community of serious traders.
Let’s grow, learn, and win together inside the MMFlow Trading Channel.
Tap in and be part of the flow.

Gold silver update next Our Spot #Gold Range Prediction from 31/03/2025 to 04/04/2025 is as under.
Gold Spot : 3023$-3126$
Gold INR : 88100-91050
Our Spot #Silver Range prediction from 31/03/2025 to 04/04/2025 is as under.
Silver Spot: 33.44$-35.05$
Silver INR: 98400-103200
It must be remembered that price of precious metal depends on so many world wide factors like inflation, Fed interest rate, trade barrier, geopolitical tension, demand, supply, bond yield, dollar index , GDP, payroll data, CPI, currency fluctuation, debt ceiling , expected tax & duty changes, other commodity price crude oil etc. etc. and hence there can not be any accurate barometer of predicting precious metal price.
Gold INR has been calculated taking Gold Spot international price and converting the same assuming fixed Indian rupee rate. However, this is not accurate method as change in rupee value to dollar can substantially impact Gold INR price. Pl. note that price of commodity doesn't depend upon performence of company but depend upon performence of world economy, hence it is extremely risky to trade in commodities. Commodities market also become more volatile during contract expiry.
These are not a recommendation for buy or sell. This view is only for educational purpose. You are requested to consult your financial advisor before entering in to any trade.

Gold silver update Our Spot #Gold Range Prediction from 31/03/2025 to 04/04/2025 is as under.
Gold Spot : 3023$-3126$
Gold INR : 88100-91050
Our Spot #Silver Range prediction from 31/03/2025 to 04/04/2025 is as under.
Silver Spot: 33.44$-35.05$
Silver INR: 98400-103200
It must be remembered that price of precious metal depends on so many world wide factors like inflation, Fed interest rate, trade barrier, geopolitical tension, demand, supply, bond yield, dollar index , GDP, payroll data, CPI, currency fluctuation, debt ceiling , expected tax & duty changes, other commodity price crude oil etc. etc. and hence there can not be any accurate barometer of predicting precious metal price.
Gold INR has been calculated taking Gold Spot international price and converting the same assuming fixed Indian rupee rate. However, this is not accurate method as change in rupee value to dollar can substantially impact Gold INR price. Pl. note that price of commodity doesn't depend upon performence of company but depend upon performence of world economy, hence it is extremely risky to trade in commodities. Commodities market also become more volatile during contract expiry.
These are not a recommendation for buy or sell. This view is only for educational purpose. You are requested to consult your financial advisor before entering in to any trade.

Good silver next wives Our Spot #Gold Range Prediction from 31/03/2025 to 04/04/2025 is as under.
Gold Spot : 3023$-3126$
Gold INR : 88100-91050
Our Spot #Silver Range prediction from 31/03/2025 to 04/04/2025 is as under.
Silver Spot: 33.44$-35.05$
Silver INR: 98400-103200
It must be remembered that price of precious metal depends on so many world wide factors like inflation, Fed interest rate, trade barrier, geopolitical tension, demand, supply, bond yield, dollar index , GDP, payroll data, CPI, currency fluctuation, debt ceiling , expected tax & duty changes, other commodity price crude oil etc. etc. and hence there can not be any accurate barometer of predicting precious metal price.
Gold INR has been calculated taking Gold Spot international price and converting the same assuming fixed Indian rupee rate. However, this is not accurate method as change in rupee value to dollar can substantially impact Gold INR price. Pl. note that price of commodity doesn't depend upon performence of company but depend upon performence of world economy, hence it is extremely risky to trade in commodities. Commodities market also become more volatile during contract expiry.
These are not a recommendation for buy or sell. This view is only for educational purpose. You are requested to consult your financial advisor before entering in to any trade.

Gold Rallies Ahead of Critical PCE Report – Is a Reversal ComingAs expected, Gold reached a new all-time high (ATH) following the bullish momentum we anticipated yesterday.
However, this upside move seems to have arrived earlier than projected — potentially a pre-positioning move before a major correction triggered by tonight’s PCE inflation data and profit-taking ahead of the weekend.
With current momentum, Gold could easily target $3100 as global stock markets — from the US to Asia — are sharply declining.
This reflects rising concerns over a global economic slowdown, and highlights the growing demand for safe haven assets like Gold.
📰 Tonight’s PCE data will offer key insights into inflation in the current macro context.
If PCE inflation decreases, Gold is likely to continue its rally.
However, if PCE shows higher inflation, we could see heavy sell pressure enter the market — leading to a sharp drop in XAUUSD.
That said, recent CPI and PPI data suggest that inflation may already be easing, supporting the bullish case — or at least explaining the early price surge.
🟡 Strategy for Today:
Look for early BUY entries during Asia & London sessions at key lower supports.
Avoid SELL positions for now — wait for price to reach major psychological resistance levels like $3100 before considering a short setup.
🧭 Key Levels:
🔻 Support: 3064 – 3055 – 3048 – 3040 – 3032
🔺 Psychological Resistance: 3090 – 3100 – 3106 – 3110
🎯 Trade Zones – 29/03:
BUY ZONE: 3056 – 3054
SL: 3050
TP: 3060 – 3064 – 3068 – 3072 – 3076 – 3080 – ???
🔴 SELL ZONE: 3100 – 3102
SL: 3107
TP: 3096 – 3090 – 3086 – 3082 – 3078 – 3074 – 3070
🧠 Final Reminder:
It’s Friday — and PCE inflation data tonight is crucial.
If you feel unsure or your trading psychology is shaky, stay out and wait for clarity post-news.
As always, respect your SL/TP levels and protect your capital at all costs.
Good luck, homies! Let’s trade smart.
— AD | Money Market Flow
