The Gold Bullish Setup You Can't Miss!OANDA:XAUUSD The price is clearly approaching a critical support zone, one that has previously triggered positive reactions in the market. This zone also aligns closely with the psychological level of $4,000, which tends to capture the market’s full attention.
Given the current momentum, there’s a strong possibility that buyers will step in and push prices higher. A confirmation, such as a solid rejection pattern, a bullish engulfing candle, or a long lower shadow, would significantly increase the likelihood of a rebound. If my analysis proves accurate, and buyers regain control, we could see the price rise to around $4,070.
However, if the price breaks below this key support, it would negate the bullish outlook and could lead to further declines.
Please note, this is not financial advice!
Gold

XAUUSD – Battle Zones of the Day🌐 MARKET CONTEXT
Gold enters today’s session after a period of compressed volatility, where price tapped both buy-side and sell-side liquidity several times without forming a decisive trend. On the M30 chart, the intraday structure remains bearish, with price consistently rejecting premium levels and forming lower highs.
Recent Catalysts:
USD holds mild strength following a slightly hawkish tone from the Federal Reserve
Market is awaiting mid-week economic releases → leading to a cautious sentiment
Risk appetite remains neutral with no strong safe-haven flows
Session Expectations:
London Session: Likely to generate early liquidity sweeps towards premium zones
New York Session: Higher probability of seeing genuine directional expansion
Bias: Bearish intraday unless price reaches discount zones and forms a CHoCH
Price is currently trading within mid-range levels, making the extreme liquidity zones the safest points for execution.
📉 TECHNICAL ANALYSIS (SMC + LIQUIDITY STRUCTURE)
Market Structure
M30 structure: Lower Highs → Lower Lows
Equilibrium zone: 4075–4085
Inducement layers accumulating above 4147 and 4070
Liquidity
BSL: Above 4147 & 4070
SSL: Below 4033 and the deeper pocket at 3993
Market forming engineered liquidity wicks on both sides
Imbalance Zones
Bearish FVG: 4147–4148 → strong scalp sell zone
Minor imbalance: 4070–4071
Discount imbalances: 4033 and 3993 support buy setups
🔑 KEY PRICE ZONES (Clear & Attractive Explanations)
4148–4147 → Premium Liquidity Trap – Ideal Scalp Sell
A premium zone combining an unmitigated bearish order block and BSL inducement.
This area often triggers breakout buyers before institutions reverse the move.
4071–4070 → Secondary Premium Liquidity – Fast Rejection Zone
A small liquidity pool above equilibrium designed to sweep early highs before price turns bearish again.
4035–4033 → Discount Reaction Zone – Scalping Demand
A micro order block aligned with a cluster of sell-side liquidity.
Provides clean, low-drawdown intraday rebounds.
3995–3993 → Deep Discount Liquidity Pool – High-Value Reversal Zone
A major liquidity pocket aligned with higher-timeframe discounts.
If price reaches here, a strong reversal is highly probable.
⚙️ TRADE SETUPS (SMC-Driven, High Precision)
✔️ SELL SETUP 1 – Premium Scalp
Entry: 4148–4147
Stop-loss: 4126
Targets: 4135 → 4120 → 4085
Logic: BSL sweep + FVG fill leading to strong bearish rejection.
✔️ SELL SETUP 2 – Mid-Range Liquidity Sweep
Entry: 4071–4070
Stop-loss: 4077
Targets: 4058 → 4043 → 4033
Logic: Sweep of mini BSL followed by downward displacement.
✔️ BUY SETUP 1 – Intraday Rebound
Entry: 4035–4033
Stop-loss: 4027
Targets: 4048 → 4070
Logic: SSL sweep with potential for a micro CHoCH → clean bounce setup.
✔️ BUY SETUP 2 – Deep Discount Reversal
Entry: 3995–3993
Stop-loss: 3987
Targets: 4010 → 4040 → 4070
Logic: Strong higher-timeframe discount zone → excellent reversal potential.
🧠 NOTES / SESSION PLAN
Avoid trading in mid-range areas — only execute at the extreme liquidity zones
Expect fake movements during London open
New York session likely provides the main trend direction
Wait for M5/M15 confirmation signals (CHoCH + BOS)
Avoid buying around premium levels to stay clear of liquidity traps
🏁 CONCLUSION
XAUUSD continues to hold a bearish intraday structure, favouring premium-zone sell opportunities at 4147 and 4070.
Discount-zone levels at 4033 and 3993 remain high-probability areas for intraday bounces or deeper reversals.
Trade only at liquidity extremes.
Be patient.
Let the market form the trap — and then strike with precision.

Gold H1 – Sideway or Preparing for a Bigger Break?🟡 XAUUSD – Intraday Smart Money Plan | by Ryan_TitanTrader (20/11)
📈 Market Context
Gold continues to move inside a tight consolidation as markets digest fresh headlines:
Treasury markets just erased hopes for a December rate cut and now even a January cut is doubtful, following hawkish tones revealed in the latest Fed minutes.
This shift reinforces USD strength in the short term and pressures gold’s bullish momentum, keeping price trapped between well-defined liquidity zones.
Key implications from the news:
• The 6-month Treasury yield jumped back to 3.83%, aligning with hawkish expectations.
• Rate-cut bets evaporating → USD stays firm, limiting gold’s upside.
• Institutions are engineering both-side liquidity sweeps ahead of upcoming Fed speakers.
• Gold is currently hovering around ~$4,070 inside a neutral zone where no clean premium/discount imbalance exists.
Until the market receives fresh macro catalysts, price is likely to sweep liquidity at the edges of the range before choosing direction.
🔎 Technical Analysis (1H / SMC Structure)
• Structure: Price remains inside a short-term sideways distribution after the recent CHoCH + BOS sequence.
• Premium Sell Zone: 4145–4147, aligning with unmitigated supply + buy-side liquidity resting above recent highs.
• Discount Buy Zone: 4004–4002, sitting inside last clean demand with previous sell-side sweep.
• Liquidity Map:
→ Buy-side liquidity: above 4145–4150 (equal-high cluster).
→ Sell-side liquidity: below 4004–3997, where earlier long positions were cleared.
🔴 Sell Setup (Premium Reaction Zone)
• Entry: 4145 – 4147
• Stop-Loss: 4155
• Take-Profit:
→ 4085 (minor imbalance)
→ 4045 (range midpoint)
→ 4004 – 4002 (discount demand)
📌 Execution rule: Wait for liquidity sweep into zone + bearish CHoCH M5–M15 before entering.
🟢 Buy Setup (Discount Reaction Zone)
• Entry: 4004 – 4002
• Stop-Loss: 3997
• Take-Profit:
→ 4040 (short-term range high)
→ 4075 (inefficiency fill)
→ 4140 (premium retest)
📌 Valid only if price sweeps the 4000–3997 liquidity pocket and shows strong bullish displacement.
⚠️ Risk Management Notes
• Expect increased volatility as markets reposition after the sharp decline in rate-cut expectations.
• Avoid trading inside the 4030–4080 chop zone unless a clear structure break occurs.
• Reduce risk size during sudden USD spikes caused by Treasury-yield moves.
• Trail stops progressively as each liquidity level is taken.
📝 Summary
Gold is currently stuck in a clean intraday range as hawkish Fed minutes remove hopes for early rate cuts, pushing USD up and holding gold below premium supply.
SMC structure favors liquidity-sweep setups at both edges:
• Sell Zone: 4145–4147 (premium supply)
• Buy Zone: 4004–4002 (discount accumulation)
Expect classic manipulation → reaction → continuation patterns until the market resolves the new macro pressure.
📍 Follow @Ryan_TitanTrader for more Smart Money updates.

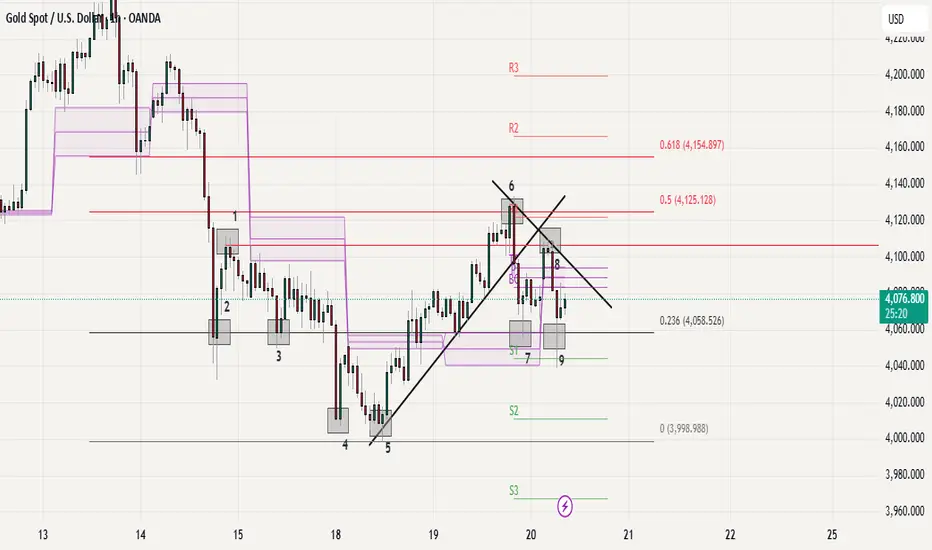
Gold Current Price Action Structure Looking weak under 6 and 8||
Support at 7 and 9, more correction under these POI.//
to go bullish need to claim /breakout on 6//
major support / Demand at 4 and 5//
Overall sentiments as per structure is correction /bearish for short term .
Cup and Handle Detected: A Bullish Outlook for XAUUSDOANDA:XAUUSD is forming a very clear Cup and Handle pattern. Price previously dropped toward the 4000 region, rounded out, and then climbed back toward 4080, completing the cup structure. At the moment, the market is making a mild pullback and shaping a tight and well controlled handle.
If price can break this resistance with strong momentum, the next target I expect is around 4150. Until a confirmed breakout appears, patience remains essential. No breakout means no trade.
This is a classic bullish formation, and market expectations are gradually strengthening.

XAUUSD: Likely continuation following pullbackXAUUSD has surged into a strong uptrend, and I predict that this momentum will continue, with a potential target around 4,150, as shown on my chart.
The current price level may be a critical turning point. Here, the price could find support and continue to rise, or if it breaks below, we might see an extension of the downward trend.
If I had to choose a direction, I would lean towards more upside, but the final decision should be based on price action to determine the next move.
However, if the price breaks decisively below the trendline, it would invalidate the bullish scenario, indicating that the uptrend could pause or even reverse in the short term.
These are just my personal views based on chart analysis, not financial advice. Always verify your setups and manage your risk carefully.

GOLD H1 – Trump’s Fed Comments Shake Market Sentiment🟡 XAUUSD – Intraday Smart Money Plan | by Ryan_TitanTrader (19/11)
📈 Market Context
Gold is trading in a tight corrective structure as markets react to breaking headlines that Donald Trump is considering removing Fed Chair Jerome Powell.
This news injects uncertainty into Fed policy expectations, causing short-term volatility in USD and positioning gold at a critical decision zone.
• Trump’s comments increase speculation about a potential policy shift, which may temporarily weaken USD sentiment.
• However, gold remains capped below the premium supply zone as institutional flows continue to engineer liquidity sweeps.
• Price is hovering near $4,080 ahead of key Fed-related discussions, keeping both sides of liquidity active.
Institutional order flow suggests controlled accumulation at the discount range while premium regions remain defended by sellers.
🔎 Technical Analysis (1H / SMC Structure)
• Structure: Price is forming a short-term distribution pattern after multiple BOS events from the 4150 breakdown.
• Premium Sell Zone: 4109–4111, aligning with unmitigated supply and internal liquidity pockets.
• Discount Buy Zone: 4009–4007, sitting inside a clean demand block + previous sell-side sweep.
• Liquidity:
→ Buy-side liquidity sits above 4111, where equal-high clusters form.
→ Sell-side liquidity rests between 4007–4000, where earlier long positions were cleared.
🔴 Sell Setup (Premium Reaction Zone)
• Entry: 4109 – 4111
• Stop-Loss: 4119
• Take-Profit:
→ 4055 (minor inefficiency)
→ 4028 (BOS retest)
→ 4009–4007 (discount demand)
📌 Execute only after a liquidity sweep into the zone + bearish CHOCH on M5–M15.
🟢 Buy Setup (Discount Reaction Zone)
• Entry: 4009 – 4007
• Stop-Loss: 4000
• Take-Profit:
→ 4040 (short-term range high)
→ 4075 (inefficiency rebound)
→ 4105/4110 (premium retest)
📌 Valid if price sweeps 4007 and shows bullish displacement.
⚠️ Risk Management Notes
• Expect volatility as traders react to Trump’s comments on Fed leadership.
• Avoid trading in the 4030–4080 chop zone without a clear structural break.
• Reduce position size during impulsive spikes around USD sentiment shifts.
• Trail stops once price clears each liquidity pocket.
📝 Summary
Gold is being influenced heavily by uncertainty around Trump’s remarks about replacing Fed Chair Powell. Liquidity is building at both extremes, offering clean opportunities at the edges of the range.
• Sell Zone: 4109–4111 (premium supply)
• Buy Zone: 4009–4007 (discount accumulation)
Expect a manipulation → reaction → continuation pattern as institutions play both sides of the current structure.
📍 Follow @Ryan_TitanTrader for more Smart Money updates.
🎁 Gifts in BIO for traders who follow daily plans.

XAUUSD | Bulls Hold Control Above 4070 - Eyes on 4090–4100 ZoneGold (XAUUSD) continues to show strong bullish structure, and price action above the 4070 key support reinforces buyers’ dominance.
If price sustains above this level, the next upside liquidity area sits at 4090–4100 , a zone where previous reactions have occurred.
Bullish Scenario:
Holding above 4070 keeps momentum pointed toward 4082 and then the 4090 zone.
The bullish outlook remains valid as long as price stays above 4059, which currently acts as intraday invalidation.
What I’m Watching:
A clean intraday consolidation above 4070
Momentum strength into 4082
Whether buyers can break into the 4090–4100 resistance pocket
This setup highlights how the market could behave, not financial advice—just educational analysis.
📌 Disclaimer:
This analysis is for educational purposes only and is not financial advice. Always manage risk and follow your trading plan.
Your feedback drives our content and keeps everyone trading smarter. Let’s make those pips together! 🚀
Happy Trading,
– The InvestPro Team

GOLD H1 – Hawkish Fed Pressure Ahead of Key NFP Data🟡 XAUUSD – Intraday Smart Money Plan | by Ryan_TitanTrader (18/11)
📈 Market Context
Gold is trading inside a bearish corrective channel as markets react to hawkish Federal Reserve commentary and positioning ahead of this week’s U.S. NFP data.
• Fed officials signaled a stronger stance against premature rate cuts, keeping USD supported and limiting gold’s upside.
• Price continues to hover near $4,080, reflecting uncertainty as traders balance Fed tone with upcoming labour-market reports.
Institutional order flow shows controlled downside pressure, with engineered liquidity sweeps forming around both channel extremes.
🔎 Technical Analysis (1H / SMC Structure)
• Structure: Price remains inside a Bearish Correction Channel, creating consecutive BOS points, confirming distribution.
• Premium Sell Zone: 4107–4105 aligns with a previous mitigation block + internal liquidity.
• Discount Buy Zone: 3983–3985 sits at the lower boundary of the channel + liquidity sweep zone.
• Liquidity:
→ Buy-side liquidity above 4107 (clean equal-high pocket).
→ Sell-side liquidity resting around 3985–3976, where prior long positions were removed.
🔴 Sell Setup (Premium Reaction Zone)
• Entry: 4,107 – 4,105
• Stop-Loss: 4,117
• Take-Profit Targets:
→ 4,060 (minor imbalance fill)
→ 4,030 (BOS retest)
→ 3,985 (discount zone)
📌 Execute only after a liquidity sweep into the zone + bearish BOS on M5–M15.
🟢 Buy Setup (Discount Reaction Zone)
• Entry: 3,983 – 3,985
• Stop-Loss: 3,976
• Take-Profit Targets:
→ 4,030 (short-term structure high)
→ 4,060 (inefficiency midpoint)
→ 4,105 (premium retest)
📌 Valid if price taps channel low + shows bullish displacement.
⚠️ Risk Management Notes
• Expect volatility as markets digest hawkish Fed remarks before NFP.
• Avoid entering trades inside the 4020–4070 chop region without clear BOS.
• Reduce position size during news hours.
• Trail stops once price clears each liquidity pocket.
📝 Summary
Gold remains pressured by Fed rhetoric, but liquidity is building at both extremes.
• Sell Zone: 4107–4105 (premium mitigation area)
• Buy Zone: 3983–3985 (discount liquidity sweep)
Price is likely to form a manipulation → reaction → continuation pattern within the channel.
📍 Follow @Ryan_TitanTrader for more Smart Money updates ⚡
🎁 More insights & gifts on my TradingView profile.

Pressured Below 4050$ as Bears Target the 4,000$ Liquidity BreakGold continues to trade under heavy selling pressure, staying capped beneath 4,050$ and hovering just above the major liquidity floor at 4,000$.
With fading expectations for a December Fed cut and cautious global sentiment, buyers remain defensive while sellers maintain structural control.
📊 Technical Outlook (H1)
Price remains inside a tight 4,053$ → 4,000$ distribution zone, with the descending trendline keeping gold suppressed.
The POC around 4,053$ is acting as a firm ceiling; every retest so far has been rejected.
Fibonacci projections from the last drop highlight two major downside liquidity zones:
3,945$ → first liquidity cluster
3,876$ → deeper extension and key demand
Current structure resembles a bear flag, hinting that the market may be preparing for another downside expansion.
🎯 Key Scenarios
1️⃣ Bearish Breakdown (Primary Scenario)
If gold loses 4,000$, expect momentum to accelerate into:
3,945$
3,876$
This remains the most probable path while price holds below 4,053$.
2️⃣ Liquidity Sweep → Short-Covering Bounce
If price sweeps 3,945$ and forms bullish rejection wicks:
A relief bounce could develop back toward 4,000$,
Then 4,053$ (POC)
And possibly 4,098$ if buyers gain traction.
Still a corrective move unless bulls reclaim the upper structure.
❌ Invalidation (Bearish Bias Weakens)
H4 acceptance above 4,098$
→ would shift the narrative and force a reassessment of trend direction.
⚜️ MMFLOW TRADING Insight
Gold is still trading below value and below the trendline — this is not a bullish environment yet.
The market must either break 4,000$ or reclaim 4,053$–4,098$ before any stronger directional conviction returns.
“Let the market show its hand. In a downtrend, weak rallies are opportunities — not reversals.”

GOLD H1 – Will Retail Sales Trigger Gold’s Next Big Move?🟡 XAUUSD – Intraday Smart Money Plan | by Ryan_TitanTrader (17/11)
📈 Market Context
Gold is trading inside a corrective phase as markets anticipate today’s U.S. Retail Sales data and several Fed speeches — both crucial for assessing whether inflation momentum is slowing or rebounding.
• Weak retail numbers may hint at cooling consumer strength, supporting safe-haven bids in gold.
• Strong data could revive USD demand, prompting sell-side setups from premium zones.
Institutional flows show engineered pushes into inefficiency before a directional leg unfolds.
🔎 Technical Analysis (1H / SMC Structure)
• Structure: Gold is forming a short-term accumulation at the discount range after consecutive bearish candles and a deep liquidity sweep below 4030.
• FVG Sell Zone: 4140–4138 aligns with an unmitigated FVG + internal liquidity — ideal for sell-side reactions.
• Discount Zone: 4008–4010 is the last clean demand zone + sweep area, matching the chart’s projected bullish inducement.
• Liquidity:
→ Buy-side liquidity rests above 4140.
→ Sell-side liquidity remains exposed near 4000–3995.
🔴 Sell Setup (Premium Reaction Zone)
• Entry: 4,140 – 4,138
• Stop-Loss: 4,150
• Take-Profit Targets:
→ 4,095 (intra-day imbalance fill)
→ 4,060 (previous BOS block)
→ 4,010 (discount accumulation area)
📌 Trade only after a liquidity sweep into FVG + bearish BOS on M5–M15.
🟢 Buy Setup (Discount Reaction Zone)
• Entry: 4,010 – 4,008
• Stop-Loss: 4,000
• Take-Profit Targets:
→ 4,060 (short-term structure high)
→ 4,095 (mid-range inefficiency)
→ 4,138 (final premium reaction zone)
📌 Valid if price sweeps 4008 and shows bullish BOS + displacement.
⚠️ Risk Management Notes
• Expect volatility during the U.S. Retail Sales release.
• Avoid chasing price inside the 4060–4100 chop region.
• Lock profits at each liquidity level and trail stops.
• Keep total risk under 1–2% per setup.
📝 Summary
Gold remains in a engineered pullback phase with clear liquidity pockets at both extremes.
• Sell Zone: 4140–4138 (FVG / premium reaction zone)
• Buy Zone: 4008–4010 (discount accumulation zone)
A clean manipulation–reaction–continuation pattern is likely before the next intraday move.
📍 Follow @Ryan_TitanTrader for more Smart Money updates ⚡
Check out my TradingView profile for special gifts 🎁

GOLD DAILY TRADING 17/11: BUY TODAY🦁 THE GOLDEN ARENA – 17 NOV, 2025
“Rebound or Trap? Let the Orderflow Decide.”
A visually striking TradingView plan – part narrative, part tactical map. This is not just a bias, it’s a battlefield strategy.
🧭 MARKET CONTEXT SNAPSHOT
Price currently consolidating around 4076 – 4084, after clean breaks of structure (BOS) and a deep retracement.
Significant supply zones confirmed at 4157 – 4180, where POC clusters, FVG imbalances, and volume absorptions align.
Orderflow on M5–M30 shows fading buy pressure and aggressive sells into lower highs.
🎯 CORE STRATEGIES FOR TODAY
🔺 Scenario 1: Breakout Trap SELL (High Conviction)
Target Zone 4178 – 4180 (Main Supply)
Stop Loss (SL) 4185
Take Profit 1 (TP1) 4155 (Low volume node)
Take Profit 2 (TP2) 4100 (Local support)
Take Profit 3 (TP3) 4040 (Structural SSL level)
🔍 Why this setup?
Clear liquidity pool above 4178 being targeted.
Volume tapering off into the move → classic reversal signal.
Footprint shows absorption candles at key supply.
🪙 Scenario 2: FVG Scalping SELL (Secondary)
Entry Zone 4157 – 4158
SL 4163
TP 4100 – 4105
✅ Perfect for short-term scalpers looking to ride the intraday rejection from the imbalance zone.
🟢 Bullish Reversal INVALIDATION (Failsafe Plan)
Trigger Break and hold above 4185
Entry Breakout Buy above 4190
SL 4175
TP 4220
Only flip bullish if aggressive buyers step in + strong delta + profile breakout.
🧱 KEY PRICE ZONES TO MONITOR
Level Description
4185 Stopline – invalidates Sell
4178 – 4180 Main SELL Zone (POC + FVG)
4157 – 4158 Minor FVG Scalping Area
4100 Micro support + Bull trap
4040 SSL – liquidity target
📊 VOLUME & ORDERFLOW INSIGHT
M5–M30 Footprints:
Massive seller imbalances from 4175+
Footprint at 4084 shows buyer exhaustion
Volume Profile:
High-volume node at 4178 acting as strong resistance
Low-volume gap below 4155 → fast price travel zone
Delta:
Negative delta buildup confirming sell bias
💡 EXECUTION CHECKLIST
✅ Wait for entry trigger at marked zones – don’t pre-empt.
🚫 Avoid FOMO buy into supply unless 4185 is cleanly broken.
🔔 Set alerts at 4157 and 4180 for rejection signs.
🧠 TRADING MANTRA OF THE DAY
"The chart speaks in structure,
The volume whispers the truth,
But the orderflow shouts the conviction."
📌 Bias: SELL on retracements toward supply → hold for 4100–4040
📌 Watchlist: Footprint aggression, absorption blocks, spoof traps

XAUUSD Double Bull Flag — Danger AheadHello my dear traders, Laura here.
This week, the market has been extremely tense, and the price action reflects it well.
As I mentioned before, we are currently seeing the formation of a large bull flag. Just above it, a smaller flag is developing, and this smaller structure is the key trigger for any potential continuation. The bullish outlook remains valid only if this smaller flag breaks cleanly.
The recent pullback dipped deeper than expected, which signals hesitation from buyers. When confidence fades, even a promising breakout can turn into a sweet trap that lifts briefly before falling sharply.
Because of this, patience becomes essential. Before entering, we need a clear and decisive breakout that confirms strength. Specifically, we should look for a candle that breaks through resistance with firmness and clarity. If such a confirmation appears, the path toward the 4,300 level becomes structurally supported.
On the other hand, if the price falls below the lower trendline, the bullish scenario is invalidated immediately. At that point, the setup no longer holds and should not be traded.
For now, the principle is straightforward.
No breakout means no entry. Stay disciplined and avoid letting the market pull you into unnecessary risk.

Gold (Neowave Trading Idea)Hello everyone
# Gold is started walking again in daily charts and its going or atleast try for the time being to break its all time again.
## Stoploss will be 3964 if breaks dont sell just exit.
Thanks

XAUUSD: Continuing Uptrend with Potential Expansion to $4,280OANDA:XAUUSD has shown strong performance in the ascending channel, and I expect this trend to continue as shown in my chart, with a target price of $4,280.
The current area represents a key turning point, where prices could find support allowing them to rise, or they may break down, which could lead to a further downward movement.
If I were to choose the most likely direction, I would lean towards upward price movement. However, only market action will determine whether the channel will continue or not.
If the downtrend line is breached strongly, it will invalidate the bullish scenario, meaning that the bullish momentum could weaken or even reverse in the short term.
These are just my personal forecasts based on technical analysis, and they do not represent financial advice. Always make sure to verify your setups and manage risks wisely.
Wishing you successful and profitable trading!

$Gold: Breakdown or Bounce?🔻 #Gold Breakdown or Bounce? 🔺
Price tested a critical level (upward sloping trendline - Breakdown Retest ) after a bearish engulfing and is now pulling back. Will the breakdown continue, or can bulls reclaim control? 👀
Trendline break 🚨
Breakdown retest ⚠️
Key levels to watch:
🚧 Resistance: $4099.40 - $4126.08 / $4185.91 - $4195.21 / $4355.80 - $4381.44
🛡 Support: $4024.53 / $3932.10 - $3930.62 / $3953.00
Below $3953 → opens downside toward $3500.20–$3432.84 📉
Between ATH & $3953 → market likely stays trendless/choppy ⚖️
TVC:GOLD #Gold #XAUUSD #Forex #BearishEngulfing #CandleStickPatterns #BreakdownRetest #BearishReversal #PriceAction #ForexTrading
📌 #Disclaimer: This analysis is shared for educational purposes only. It is not a buy/sell recommendation. Please do your own research before making any trading decisions.

GOLD H1 – Gold Reacts to Mixed U.S. Inflation Data🟡 XAUUSD – Intraday Smart Money Plan | by Ryan_TitanTrader (14/11)
📈 Market Context
Gold continues to trade within a balanced range as investors digest the latest U.S. inflation data. The CPI report showed cooling price pressures, while producer prices (PPI) are due soon — both shaping market sentiment toward the Fed’s December rate outlook.
• Softer inflation supports a bullish bias if gold holds the discount zone.
• Renewed USD strength could trigger short setups from premium liquidity zones.
Institutional flows suggest engineered liquidity hunts before a decisive move resumes.
🔎 Technical Analysis (1H / SMC Structure)
• Structure: Gold remains in a short-term bullish correction after a strong sell-off, with recent ChoCH signaling a possible re-accumulation phase.
• Premium Zone: 4300–4298 aligns with a previous unmitigated supply and internal liquidity — ideal for sell-side reactions.
• Discount Zone: 4144–4142 overlaps with the last bullish OB and EMA100 area — a potential demand zone for continuation.
• Liquidity: Resting buy-side liquidity sits above 4300, while inducement below 4140 could lure early longs before true accumulation.
🔴 Sell Setup (Premium Reaction Zone)
• Entry: 4,300 – 4,298
• Stop-Loss: 4,310
• Take-Profit Targets:
→ 4,178 (previous BOS zone)
→ 4,144 (discount retest)
→ 4,110 (deep liquidity pocket)
📌 Valid only after a liquidity sweep and bearish BOS confirmation on M5–M15.
🟢 Buy Setup (Discount Reaction Zone)
• Entry: 4,144 – 4,142
• Stop-Loss: 4,135
• Take-Profit Targets:
→ 4,185 (minor structure high)
→ 4,210 (liquidity void fill)
→ 4,300 (final premium reaction zone)
📌 Valid if price reclaims structure with bullish BOS confirmation.
⚠️ Risk Management Notes
• Stay patient until U.S. PPI data confirms direction.
• Avoid trades between 4175–4250 (low R/R consolidation area).
• Scale out partials near liquidity pools and trail stops after confirmation.
• Maintain disciplined risk exposure under 2%.
Summary
Gold is in an engineered equilibrium phase — liquidity pools are forming at both extremes.
• Sell zone: 4300–4298 (premium reaction zone)
• Buy zone: 4144–4142 (discount accumulation zone)
Expect manipulation around mid-range levels before a clean directional move unfolds.
📍Follow @Ryan_TitanTrader for more Smart Money updates ⚡

Gold H1 – Gold Awaits U.S. PPI Data After 5-Wave Completion🟡 XAUUSD – Elliott Wave Intraday Outlook | 14/11
📈 Elliott Wave Context
Gold has completed a textbook 5-wave impulsive rally, peaking near 4250 before entering a corrective phase. The current retracement appears to be forming an ABC correction, with price now approaching the C-wave completion zone around 4145–4147.
Today’s focus shifts to the upcoming U.S. Producer Price Index (PPI) report — a crucial inflation indicator that may influence Fed policy expectations and short-term dollar momentum.
• A hotter PPI print could strengthen USD and trigger a brief sell-off from premium zones.
• A softer reading could weaken USD and fuel a renewed push from discount levels.
🔎 Wave Structure Breakdown (H1)
• Wave 1 → Initial breakout from liquidity trap (~4070).
• Wave 2 → Shallow retracement, respecting prior OB.
• Wave 3 → Strong extension into new highs (~4220+).
• Wave 4 → Sideways correction with internal liquidity grab.
• Wave 5 → Final push to ~4250 — marking potential top.
Now the market is tracing an A–B–C corrective structure, with wave C expected to finalize near the BUY ZONE 4145–4147 (SL 4138) before the next bullish leg resumes.
Intraday Trade Zones (Elliott-Based)
🟩 BUY ZONE: 4145 – 4147 | SL 4138
Looking for completion of wave C and bullish reversal confirmation (BOS or mitigation from demand block).
Targets: 4205 → 4230 → 4250
🟥 SELL ZONE: 4245 – 4243 | SL 4252
Scalp opportunity aligning with potential wave B retest or short-term overextension before larger correction.
Targets: 4180 → 4150
📌 Summary
Gold remains technically bullish after completing a 5-wave structure but is currently digesting gains through a corrective ABC phase. The 4145–4147 discount zone serves as a high-probability wave C completion area, especially if PPI data softens USD momentum.
Wait for structure confirmation before entering, and monitor the PPI release as it may dictate whether gold extends higher or deepens its correction.

Gold Maintains Bullish Structure Despite 4245 Rejection We have seen a sharp rejection from the 4245 level yesterday, forming a red candle . However,. Gold found solid support at the weekly R3 level around 4147 and managed to close above it, which is a significant technical development. Currently, we're witnessing a strong recovery rally on lower tf that suggests the bulls aren't ready to give up just yet.
When we zoom in to the daily timeframe, yesterday's downward move appears to be just a normal bearish candle rather than a trend reversal signal. The key factor supporting this view is that price was trading well above the weekly R3 level throughout the session. In a healthy uptrend, these kinds of pullbacks are quite normal and often provide opportunities for fresh entries. The overall bullish structure on the daily chart remains intact, which gives me confidence that this isn't the beginning of a major correction.
Looking at the current setup, the first critical support level at 4140-4150. This zone has proven its importance multiple times, and as long as price holds above this area, I'm maintaining a bullish bias. A daily close below 4140-4150 would be the first warning sign that we might be heading back into consolidation territory. That scenario would require a reassessment of the trend direction.
However, if gold continues to respect the 4140-4150 support zone and builds on today's recovery momentum, we could see price pushing toward higher levels in the coming sessions. The bulls have shown their presence at key support areas, and with the daily structure still favoring upside, the path of least resistance appears to be upward for now.

GOLD H1 – Gold Awaits U.S. PPI Data for Directional Clarity🟡 XAUUSD – Intraday Smart Money Plan | by Ryan_TitanTrader (13/11)
📈 Market Context
Gold is consolidating after a strong impulsive leg, with intraday traders now focused on the upcoming U.S. Producer Price Index (PPI) release — a key inflation metric that often shapes Fed expectations.
• A hot PPI reading could strengthen the USD and trigger a sell-off from premium levels.
• A softer print may weaken the dollar, encouraging another liquidity grab above 4250.
Institutional order flow shows potential for engineered liquidity sweeps around both extremes before the next directional push.
🔎 Technical Analysis (1H / SMC Structure)
• Structure: Still bullish overall, but showing early distribution near the 4250 handle.
• Premium Zone: 4255–4253 aligns with an unmitigated supply and prior buy-side liquidity pool — a prime short setup if price reacts after a liquidity sweep.
• Discount Zone: 4168–4166 sits within the recent FVG and above EMA100 — a valid area for re-accumulation and continuation if price corrects deeper.
• Liquidity: Equal highs at 4255 and lows near 4156 signal potential stop-hunt traps before a decisive move.
🔴 Sell Setup (Premium Reaction Zone)
• Entry: 4,255 – 4,253
• Stop-Loss: 4,265
• Take-Profit Targets:
→ 4,182 (previous BOS zone)
→ 4,148 (mid-range equilibrium)
→ 4,110 (discount reaction zone)
📌 Valid only if price sweeps buy-side liquidity and confirms bearish BOS on M5–M15.
🟢 Buy Setup (Discount Reaction Zone)
• Entry: 4,166 – 4,168
• Stop-Loss: 4,156
• Take-Profit Targets:
→ 4,210 (short-term liquidity pocket)
→ 4,248 (imbalance fill zone)
→ 4,255 (final liquidity target)
📌 Valid only if price mitigates the FVG and reclaims structure with bullish BOS confirmation.
⚠️ Risk Management Notes
• Wait for PPI volatility before entering trades.
• Avoid trading mid-range (4180–4210) – low R/R zone.
• Scale out partials near liquidity points and trail stops post-confirmation.
• Maintain disciplined risk: 1–2% max per setup.
Summary
Gold is in pre-news equilibrium, with both buy- and sell-side liquidity pools clearly defined:
• Sell zone: 4255–4253 (premium reaction area)
• Buy zone: 4168–4166 (discount re-entry area)
Expect engineered liquidity grabs before a decisive move — patience and structure confirmation remain key.
📍Follow @Ryan_TitanTrader for real-time Smart Money updates ⚡

GOLD: Big Pullback Loading Before a 4400 Rally?Bias: Bullish – Buy-the-Dip Strategy
Approach: Smart Money Concepts (SMC)
🌐 Market Context
Gold continues to show a strong recovery, maintaining a clear bullish structure across the H1, H4, and Daily timeframes.
Institutional order flow remains firmly on the buy-side as:
Liquidity on H1/H4 highs is being swept consistently
Pullbacks are respecting Demand Order Blocks (OBs)
Multiple Breaks of Structure (BOS) confirm bullish continuation
However, the region 4280 – 4330 (FVG + major trap zone) has historically triggered strong distribution – making it a likely area for liquidity hunts and fake breakouts before any corrective move.
🎯 Key Price Levels
🔴 Resistance Zones (Potential Distribution Areas)
4274 – 4295
4330 – 4345 (FVG + Biggest Trap Zone)
Expect volatility and sharp reactions here – suitable for partial profit-taking, not for chasing buy entries.
🟢 Support / Buy Zones (Institutional Demand Areas)
1️⃣ BUY Opportunity – Shallow Pullback (High Probability)
Entry: 4170 – 4190 (H4 OB + BOS retest)
SL: Below 4170
TP1: 4275
TP2: 4360 – 4400
➡️ This is today’s primary setup. Requires clear bullish confirmation on entry.
2️⃣ BUY Opportunity – Deep Pullback (High R:R Setup)
Entry: 4100 – 4120 (Deep OB + liquidity sweep level)
SL: Below 4100
TP1: 4275
TP2: 4360 – 4400
➡️ Best scenario if the market retraces deeply — exceptional Risk:Reward.
📉 Why Selling Is Not a Priority
Despite resistance overhead, the market remains:
Bullish in structure
Supported by demand zones
Without a confirmed Market Structure Shift (MSS) → Bearish BOS
Therefore, selling remains counter-trend and not part of the main trading plan today.
📈 Institutional Technical Outlook (H1/H4)
1. Price approaching 4280 – 4330 trap zone
Expect:
Liquidity sweeps
Wick-driven false breakouts
Short-term corrections back into OB before continuing upwards
2. Liquidity Map
4170 liquidity pool below current price → likely target for engineered pullback
4300 – 4350 equal highs → attractive upside draw for smart money
🧠 Professional Trade Plan Summary
✔️ Do not chase breakouts near resistance
✔️ Wait for price to retrace into:
4170 – 4190
4100 – 4120
✔️ Main targets:
TP1: 4275
TP2: 4360 – 4400
✔️ At TP1:
Secure 50%
Move SL to Break-Even
✔️ Plan invalidation if price closes below 4100
📌 Notes for Large-Capital Traders (UK/EU)
Today’s environment is ideal for high-quality, low-frequency entries at institutional demand zones.
Avoid buying at highs; patience will deliver the best setups.
This plan follows a clean institutional trend-following methodology — suitable for accounts prioritising consistency and low drawdown.
📊 Daily Bias: Strong BUY
⏳ Waiting for pullback towards 4170 – 4190 or 4100 – 4120
🚀 Targeting 4360 – 4400 over the next sessions

Gold Holds Firm Near $4,180 as Markets Await Fed Signal Gold prices are holding steady around $4,184 per ounce, maintaining strong momentum after last week’s sharp rebound of nearly $250 from the $3,930 low. On the 4-hour chart, the uptrend remains intact with multiple Fair Value Gaps acting as key support zones. The nearest support is seen between $4,150–4,120, while resistance lies at $4,220–4,260.
According to Kitco and Reuters, the rally is largely supported by growing expectations that the Federal Reserve may cut rates in December, amid signs of a cooling U.S. economy. The reopening of the U.S. government after a 35-day shutdown means crucial data such as CPI, NFP, and GDP will soon be released — which could reinforce the market’s belief that a dovish shift is near.
Adding to the intrigue, the U.S. Supreme Court is set to review former President Donald Trump’s authority to dismiss Fed Governor Lisa Cook in early 2026. Analysts warn that if this threatens the Fed’s independence, it could trigger a sharp decline in the U.S. dollar and push gold up by as much as $500 per ounce.
Meanwhile, UBS forecasts global gold demand in 2025 could reach its highest level since 2011, as central banks continue increasing reserves. Heightened geopolitical risks — including the upcoming U.S. election in 2026, the Middle East conflict, and renewed U.S.–China trade tensions — are further strengthening gold’s appeal as a safe haven.
In the near term, gold could correct slightly towards $4,150–4,120 before resuming its advance towards $4,260. A decisive break above that level could open the path to $4,300–4,340. With a weakening dollar, potential rate cuts, and global uncertainty, gold appears well-positioned for the next medium-term bullish cycle.

GOLD H1 – Awaiting CPI Data for Next Big Move🟡 XAUUSD – Intraday Smart Money Plan | by Ryan_TitanTrader (12/11)
📈 Market Context
Gold remains in a controlled retracement phase after a strong impulsive leg last week. The market is now consolidating within a defined 1H range, showing clear reactions near short-term EMAs as traders await today’s U.S. CPI release, a key driver of intraday volatility.
• A higher-than-expected CPI could reignite USD strength and push gold toward the discount zone.
• A softer CPI print may trigger a renewed push into the premium zone, inviting liquidity grabs above 4200.
Institutional flows remain balanced between short-term profit-taking and position building ahead of the inflation print, suggesting engineered liquidity sweeps before the real move unfolds.
🔎 Technical Analysis (1H / SMC Style)
• Structure: Market structure is still bullish but showing distribution signs at the top of the range.
• Premium Zone: 4201–4199 aligns with unmitigated supply — a prime area for potential sell-side reaction if CPI sparks a bullish liquidity sweep.
• Discount Zone: 4083–4081 overlaps with the 0.618 Fibonacci retracement and sits just above EMA100 — an ideal re-accumulation area for institutional buys.
• Liquidity: Equal lows near 4080 and equal highs near 4200 make both sides vulnerable to engineered stop-hunts before direction is confirmed.
🔴 Sell Setup (Premium Reaction Zone)
• Entry: 4,201 – 4,199
• Stop-Loss: 4,210
• Take-Profit Targets:
→ 4,140 (first liquidity pocket)
→ 4,102 (mid-range equilibrium)
→ 4,083 (discount zone confluence)
📌 Only valid if CPI causes a liquidity sweep into premium, followed by M5–M15 bearish BOS confirmation.
🟢 Buy Setup (Discount Reaction Zone)
• Entry: 4,081 – 4,083
• Stop-Loss: 4,074
• Take-Profit Targets:
→ 4,102
→ 4,140
→ 4,199
📌 Only valid if price sweeps 4080 liquidity and reclaims structure with bullish BOS on M15 timeframe.
⚠️ Risk Management Notes
• Wait for CPI-induced volatility before executing any setup.
• Avoid mid-range trades between 4100–4140 — this is equilibrium noise.
• Reduce size pre-news; volatility spikes can trigger premature stops.
• Scale partials at each liquidity pocket and trail stop-losses accordingly.
✅ Summary
Gold is consolidating ahead of CPI, with dual liquidity zones clearly defined:
• Sell zone: 4201–4199 (premium reaction area)
• Buy zone: 4083–4081 (discount re-entry area)
The market is likely to hunt one side of liquidity before revealing true intent. Traders should remain patient, trade from extremes, and align entries with confirmed structure shifts.
FOLLOW @Ryan_TitanTrader for real-time SMC updates ⚡
