GOLD (XAU/USD) – Bullish Continuation Toward Higher Highs🔍 Technical Analysis (H1):
Market Structure:
Gold remains in a strong bullish structure with clear higher highs & higher lows ✔️, firmly respecting the ascending trendline 📈.
Breakout & Momentum:
Multiple clean breakouts above previous resistance zones confirm strong buying pressure 💪. Each breakout is followed by healthy pullbacks, showing controlled bullish momentum.
POI → Pivot Support:
Previous POI zones have successfully flipped into support 🔄, and price is currently holding above the Pivot Point zone, which strengthens bullish continuation bias 🟢.
Current Price Action:
Price is consolidating above the pivot area, suggesting a brief pause before the next impulsive move higher ⏳➡️⬆️.
🎯 Upside Targets:
Target 1: 5,300 🎯
Target 2: 5,330 🎯🎯
Extended Target: 5,360+ 🚀 (if bullish momentum accelerates)
🛡️ Invalidation / Support to Watch:
Bullish bias remains valid as long as price holds above the Pivot Point zone. A break below may trigger a deeper pullback, not trend reversal ⚠️.
📌 Conclusion:
Overall trend is bullish, structure is healthy, and price action favors a continuation toward the marked target zone after minor consolidation 📦➡️🚀.
✨ Trade with the trend & manage risk wisely! 💼📊
Goldbullish

“Bullish Pullback → Trendline Support Holding for Next Rally🔍 Key Technical Analysis
Price previously formed a strong bearish breakout, followed by a price rebound from a high pivot demand zone (POI) 🔄
Market has established a clear upward channel, confirming a medium-term bullish structure 📈
Break of Structure (BOS) to the upside signals a shift from bearish to bullish momentum ✅
Price is currently pulling back toward the upward trendline & horizontal support, indicating a healthy retracement, not a reversal 🟦
Bullish momentum remains valid as long as price holds above the support zone around 4,440 – 4,450 💪
Liquidity is resting above recent highs near the resistance trendline 🎯
🎯 Potential Price Targets (with stickers)
Target Type Price Area Sticker
TP1 → Recent High Retest 4,490 – 4,500 🎯
TP2 → Trendline Resistance 4,520 – 4,540 🚀💰
📌 TP1 = Conservative & high-probability target
📌 TP2 = Extended bullish move if momentum accelerates
📌 Trade Setup Idea
🟢 Buy Zone:
➤ 4,440 – 4,455 (trendline + support confluence)
🎯 Take Profit:
➤ TP1: 4,500 🎯
➤ TP2: 4,535 🚀
🧭 Overall Market Bias
Factor Bias
Market Structure Bullish 📈
Trend Upward Channel Holding ✅
Momentum Buyers in control 💹
Liquidity Target Above highs 💧

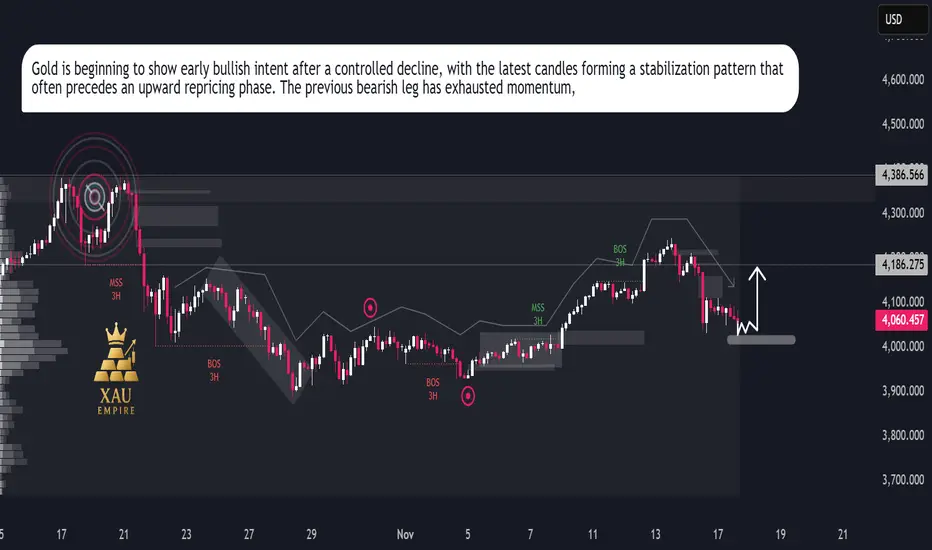
XAUUSD Repricing MoveXAUUSD Repricing Move
Gold continues to trade inside a broader corrective cycle, with price action showing a clear transition from prior strength into a short-term distribution phase. The chart highlights repeated breaks in market structure and shifts in order flow, signalling a controlled decline built on institutional rebalancing.
After the recent downside sweep, price is now hovering around a key reaction zone where liquidity has already been absorbed. Sellers dominated the previous swing, but the latest candles show a slowdown in bearish momentum, indicating that the market may be preparing for a corrective repricing attempt.
The volume footprint on the left side of the chart reflects previous heavy activity from major participants, and the current area sits beneath an inefficiency pocket that remains unmitigated. This opens the door for a short-term bullish rotation if buyers defend this accumulation region. The marked arrow in your chart aligns with a potential internal shift where gold could attempt a short retracement toward the mid-range of the prior move.
Momentum indicators embedded in the structure show reduced volatility, meaning the market may be positioning itself for a liquidity-driven bounce rather than continuing straight lower. The next sessions will reveal whether this zone becomes a launch point for a recovery leg or if the broader trend resumes its downward trajectory.
Gold (XAU/USD) Technical Analysis: Key Resistance Test Before BrThis chart represents a Gold (XAU/USD) 30-minute timeframe analysis from TradingView. Here are the key takeaways:
Technical Indicators & Levels
Exponential Moving Averages (EMAs)
200 EMA (Blue Line): 3,110.97 – A long-term trend indicator.
30 EMA (Red Line): 3,134.65 – A short-term trend indicator.
Key Levels
Resistance Point: Around 3,136.56.
Support Zone (Stop Loss Level): 3,103.16.
Target Point: 3,167.44, indicating a potential 1.62% upside.
Potential Trade Setup
Scenario 1 (Bullish Case):
If price breaks above resistance (3,136.56) and holds, the next target is 3,167.44.
A bullish breakout could indicate further momentum.
Scenario 2 (Bearish Case):
If price fails to break resistance and drops, it could test the support zone around 3,103.16.
A break below this level might lead to further downside.
Pattern Analysis:
The chart suggests a potential retest of resistance before a breakout.
A possible accumulation phase before a strong move.
Conclusion
Bullish above 3,136.56, targeting 3,167.44.
Bearish below 3,103.16, watching for downside risk.
The 200 EMA (3,110.97) could act as dynamic support.

POSSIBLE GOLD MOVE WITH 1:10 RISK REWARD AT SUPPLY ZONEGOLD SHOWING A GOOD UP MOVE WITH 1:10 RISK REWARD
DUE TO THESE REASON
ALL THE SETUPS ARE JUST FOR EDUCATIONAL PURPOSE
A. Volumes showing buyers are showing intrest .
and shock zone going to break
which preventing the market to move any one direction now it trying to break the strong resistant lable
B. after the break of this rectangle it will boost the market potential for break
C. also its resisting from a strong neckline the neckline also got weeker ald the price is ready to break in the outer region
all of these reason are indicating the same thing its ready for breakout BREAKOUT trading are follws good risk reward
please dont use more than one percentage of your capitalfollow risk reward and tradeing rules
that will help you to to become a bettertrader
thank you

Xauusd long possible Xauusd gold buy @ 1977
Stop loss 1967 (100 pips)
Target 2010 (330 pips)
Lot size recommended 0.01 for 100 usd equity
Lot size recommended 0.10 for 1000 usd equity
Open a buy position on gold and thanks me later
Follow fxlifestylemanpritfx for more updates

Gold about to go longFollowing the current bullish trend, the minor bearish wave on lower timeframes is coming to a halt. Gold is supported by the strong level at 1920 and 1900 respectively, which will be enough volume to see it soar towards 1953 and 1980, the remaining porting of q1 2023. We will have to wait and see how these two support levels behave before entering long and daily levels falling below 1900 will invalidate the bullish momentum at least for q1. Fundamentals will aid in deciding an optimum trade entry long. Today is the last trading day for January, you might want to follow the W1 close and hunt for safe entries before NFP next month.
