GOLD (XAU/USD) – Bullish Continuation Toward Higher Highs🔍 Technical Analysis (H1):
Market Structure:
Gold remains in a strong bullish structure with clear higher highs & higher lows ✔️, firmly respecting the ascending trendline 📈.
Breakout & Momentum:
Multiple clean breakouts above previous resistance zones confirm strong buying pressure 💪. Each breakout is followed by healthy pullbacks, showing controlled bullish momentum.
POI → Pivot Support:
Previous POI zones have successfully flipped into support 🔄, and price is currently holding above the Pivot Point zone, which strengthens bullish continuation bias 🟢.
Current Price Action:
Price is consolidating above the pivot area, suggesting a brief pause before the next impulsive move higher ⏳➡️⬆️.
🎯 Upside Targets:
Target 1: 5,300 🎯
Target 2: 5,330 🎯🎯
Extended Target: 5,360+ 🚀 (if bullish momentum accelerates)
🛡️ Invalidation / Support to Watch:
Bullish bias remains valid as long as price holds above the Pivot Point zone. A break below may trigger a deeper pullback, not trend reversal ⚠️.
📌 Conclusion:
Overall trend is bullish, structure is healthy, and price action favors a continuation toward the marked target zone after minor consolidation 📦➡️🚀.
✨ Trade with the trend & manage risk wisely! 💼📊
Goldbuy

GOLD (XAU/USD) – Bullish Continuation Toward Premium Zone🔍 Technical Analysis Breakdown
Market Structure: Clear bullish structure with higher highs & higher lows intact ✔️
Trendline: Price continues to respect the ascending trendline, confirming strong upside momentum 📈
Breakouts: Multiple confirmed bullish breakouts from consolidation and range zones 🔓
Volume: Strong bullish volume expansion during impulsive moves, validating institutional participation 💥
POI (Point of Interest): Repeated reactions from POI zones, acting as reliable demand areas 🎯
Pivot Point: The green pivot zone is holding as dynamic support after the pullback 🟩
Pullback: Current retracement is corrective and healthy, indicating accumulation before continuation 🔄
🎯 Targets & Trade Projection
Primary Target (TP1): 🟢 4,850 – 4,860
Extended Target (TP2): 🟢 4,890 – 4,920 (premium supply / liquidity zone)
Bullish Continuation Zone: Grey consolidation box → expected higher-low formation then expansion ⬆️
🛑 Invalidation / Risk Level
Bias invalidated below: ❌ 4,740 – 4,720 (High Pivot / trendline break)
✨ Trade Bias: Bullish Continuation
📍 Strategy: Buy pullbacks above pivot | Hold longs while trendline holds
📌 Key Message:
As long as GOLD holds above the pivot point + rising trendline, the path of least resistance remains upward toward the marked targets 🚀💰

XAU/USD – Bullish Range Breakout with Pivot Support | Target in Technical Analysis (H1):
📊 Market Structure:
Gold maintains a strong bullish structure with clear Higher Highs & Higher Lows ✅, perfectly aligned with the ascending trendline 📈.
📦 Range → Breakout:
Price consolidated inside a range 🔄 and then delivered a clean bullish breakout 💥, signaling accumulation and continuation strength.
🎯 POI (Point of Interest):
Multiple POI reactions 🟢 confirm aggressive buyer interest at demand zones, reinforcing bullish conviction.
🔁 Pivot Point Flip:
The marked pivot zone has flipped from resistance into strong support 🟩 — a textbook bullish continuation signal.
🕯️ Current Price Action:
Price is holding above the pivot point and consolidating bullishly, indicating acceptance at higher levels 📌.
🎯 Upside Target Projection
🎯 Primary Target: 4,750 – 4,760
(Liquidity zone & projected resistance)
🔄 Expected Path:
Minor pullbacks inside the grey zone 🔍 ➝ continuation toward the target 🚀
❌ Invalidation Level
⚠️ A strong H1 close below the pivot support (~4,690–4,700) would weaken the bullish bias and signal possible range re-entry.
Bias: 📈 Bullish Continuation
Trade Idea: 🧠 Buy pullbacks above pivot 🟢 | Aim for liquidity at highs 🎯🚀

GOLD (XAU/USD) – Bullish Continuation After Breakout🔍 Market Structure & Key Observations
Price is respecting a clean upward trendline, confirming a strong bullish structure 📈
Multiple POI (Point of Interest) reactions show consistent buying interest → Smart Money accumulation 💼
Clear Breakouts + BOS (Break of Structure) validate trend continuation ✔️
The former resistance at the High Pivot Point has flipped into strong support 🟢
Current consolidation above support suggests bullish continuation, not distribution
🎯 Suitable Target Zones (High Probability)
🎯 Primary Target (TP1)
➤ 4,640 – 4,655 🎯
Aligns with the upper channel resistance
Matches measured move from the recent impulse
High-probability target while price holds above support
🚀 Extended Target (TP2)
➤ 4,680 – 4,700 🚀💰
Channel expansion target
Liquidity resting above recent highs
Valid if bullish momentum accelerates
📌 Bullish Trade Idea (Optional Setup)
🟢 Buy on Pullback Zone:
➤ 4,590 – 4,605
(confluence of support level + trendline)
❌ Invalidation / Stop-Loss:
➤ Below 4,565
🎯 Take Profit Levels:
TP1: 4,650 🎯
TP2: 4,690 🚀
📊 Risk–Reward Ratio: ~ 1:2.5 to 1:3+
🧭 Overall Market Outlook
Factor Bias
Trend Strong Bullish 📈
Momentum Buyers in control 💪
Structure Higher Highs & Higher Lows ✅
Liquidity Target Above recent highs 💧

“Bullish Momentum Accelerates → Trendline Support Holding for ?🟡 GOLD (XAU/USD) – Strong Bullish Continuation After Breakout 🚀📈
🔍 Market Structure & Key Observations
Price is respecting a clean upward trendline, confirming a strong bullish structure 📈
Multiple POI (Point of Interest) reactions show consistent buyer absorption → Smart Money accumulation 💼
A clear Breakout + BOS (Break of Structure) has occurred above the previous range ✔️
Price is now holding above the High Pivot Point, which has flipped into support 🟢
Current consolidation above support signals bullish momentum continuation, not exhaustion
🎯 Suitable Target Zones (High Probability)
🎯 Primary Target (TP1)
➤ 4,620 – 4,635 🎯
Aligned with projected bullish leg
Matches upper continuation structure
High probability if price holds above support
🚀 Extended Target (TP2)
➤ 4,660 – 4,680 🚀💰
Channel expansion target
Liquidity resting above recent highs
Valid if momentum accelerates
📌 Bullish Trade Scenario (Optional Setup)
🟢 Buy on Pullback Zone:
➤ 4,565 – 4,585 (trendline + support confluence)
🎯 Take Profit Levels:
TP1: 4,630 🎯
TP2: 4,675 🚀
📊 Risk–Reward: ~1:2.5 to 1:3+
🧭 Market Outlook
Factor Bias
Trend Strong Bullish 📈
Momentum Buyers in control 💪
Structure Higher highs & higher lows ✅
Liquidity Target Above highs 💧

XAU/USD Range Market – Sell from PremiumGold is currently trading in a clear ranging (TR) environment after the recent bullish expansion. On the H1 timeframe, price has reacted from the premium zone near the previous highs, while liquidity remains stacked below the range.
🔻 Sell Scenario:
Price is expected to react from the 4303 – 4306 resistance zone, aligned with prior distribution and rejection. This area favors short-term sell opportunities while the market remains inside the range.
🔺 Buy Scenario:
The 4247 – 4245 zone represents a liquidity pocket below the major value area, offering a favorable risk-to-reward setup. With a tight stop-loss, buy limit orders are valid if price sweeps liquidity and shows reaction.
📌 Key Levels:
Resistance: 4303 – 4306
Support / Liquidity: 4247 – 4245
As long as price stays within the range, sell from premium and buy from discount remains the primary strategy. Always respect stop-loss levels and manage risk accordingly.

GOLD Rise Up to $5000 Gold will be rising up to 5K dollors and its EWT seems 2nd wave is pushing to 3rd wave in my PoV .Gold Position Traders Holds Gold for 2026 and May returns High . Flippers can do buy at the current price and forward upwards to the market

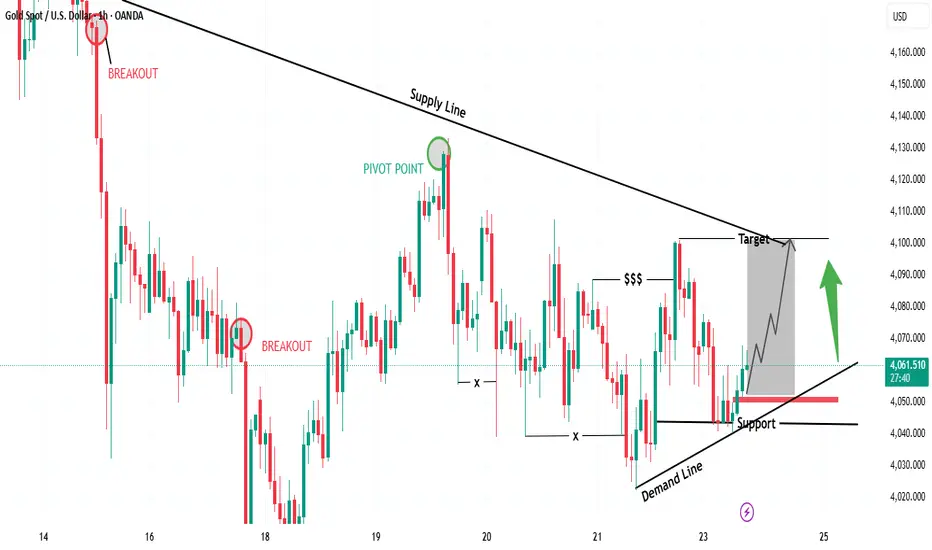
“Gold Rebounding from Demand – Targeting Supply Line Retest🔍 Key Observations
📉 Supply Line (Downtrend Resistance)
Each rally is being capped by the descending supply line
📈 Demand Line (Ascending Support)
Buyers defending higher lows
Strong bullish reaction off support
💰 Liquidity Grab ($$$)
Liquidity was taken below swing lows — bullish signal
Smart money likely securing positions before pushing up
🟢 Bullish Confirmation
If price holds above demand line + support zone
Expect bullish continuation toward supply line retest
🎯 Suitable Target Levels
Target Level (Approx) Status
🥇 First Target 4,095 – 4,105 At supply line retest
🥈 Extended Target 4,120 – 4,130 Breakout continuation
📌 Trade Idea (Bullish Scenario)
Entry Zone: 4,055 – 4,065 🟩
Stop Loss: Below 4,025 ❌
Take Profit 1: 4,100 🎯
Take Profit 2: 4,125 🚀
RR Ratio: 1:2.5 – 1:3 📈
🧭 Market Sentiment
📍 Bias → Short-term Bullish
🛑 But… sellers may reappear at supply line
⚠️ Watch for fakeouts near the target
Gold (XAU/USD) 4H Chart Analysis – Short-Term Reversal from ?Technical Overview:
Gold has recently rebounded from a High Demand Zone around the $3,900–$3,910 region, showing clear signs of buyer re-entry after a prolonged bearish correction. The candle structure suggests strong bullish intent, with higher lows forming and a potential continuation toward the next liquidity area.
Key Observations:
🔹 High Demand Zone: Price reacted strongly here, indicating institutional buying pressure.
🔹 High Prop POI (Point of Interest): Served as a key accumulation level before the breakout.
🔹 SMC Trap: Indicates a prior liquidity grab, trapping late sellers before the move up.
🔹 Bullish Momentum Building: Consecutive bullish candles after rejection from the demand zone strengthen the reversal bias.
Target Projection:
🎯 Immediate Target: $4,080 – $4,100 (aligned with local resistance and liquidity grab zone).
🛑 Support: $3,905 (must hold to maintain bullish structure).
💎 Extended Target (if momentum continues): $4,160 – $4,180 (previous major swing high zone).
Summary:
Gold is showing a short-term recovery phase within a broader bullish structure. A confirmed 4H close above $4,030 would likely propel price toward the $4,100 region, while a drop below $3,900 would invalidate the bullish setup.
📊 Suggested Title:
"Gold Rebounds from Key Demand Zone, Eyes $4,100 Resistance 🔥"

Gold at Key Support — Will XAUUSD Bounce From 3900 - 3895?Gold is testing a crucial demand zone at 3900–3895, where buyers have previously stepped in.
If this level continues to hold, we could see a bullish intraday rebound play out.
📊 Trade Setup
Buy Zone: 3900 – 3895
Stop Loss: 3878
Target 1: 3924
Target 2: 3936
💡 Technical Outlook
Price action is hinting at renewed buying pressure around 3900, with candles showing wicks and slowing momentum on the downside.
This could indicate that bulls are defending this key zone, setting up for a short-term bounce toward the 3920–3935 area.
Watch for:
A bullish engulfing candle or strong rejection wick near 3895
Increasing volume confirmation on smaller timeframes (M15–H1)
🧭 Bias
✅ Expecting a bullish bounce from the 3900–3895 zone
❌ Invalidated if price closes below 3878
⚠️ Disclaimer
This is for educational purposes only — not financial advice. Always manage your risk and use proper position sizing.

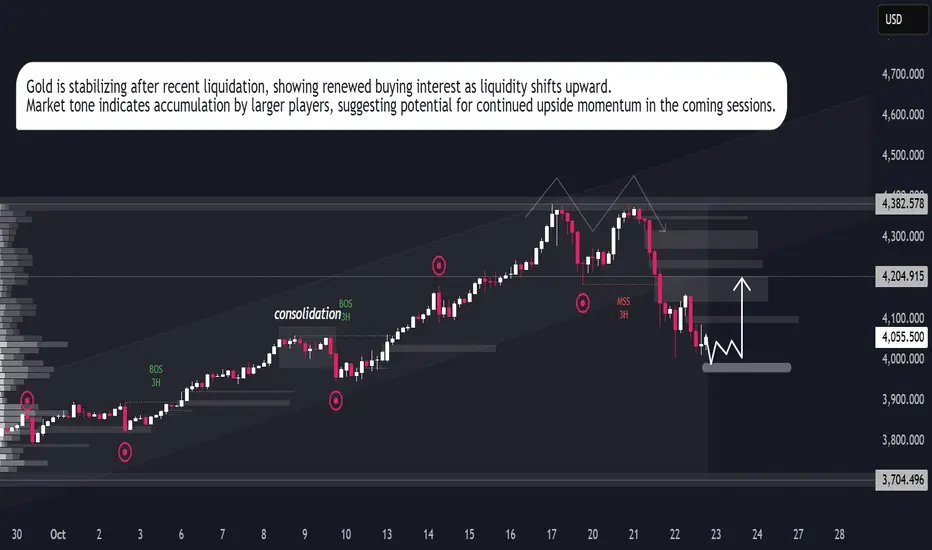
Buy Pressure Building on GoldGold is displaying signs of buyer re-entry after a period of controlled downside movement. The recent liquidity sweep around the lower range indicates that short-term selling pressure has been largely absorbed, creating favorable conditions for a potential upward expansion.
Market activity suggests renewed interest from institutional participants accumulating within the current price zone. The consolidation phase appears to be forming a base, signaling the possibility of a directional shift as liquidity gradually migrates upward. Increasing momentum on the lower end of the range reflects confidence returning to the market, setting the stage for a possible continuation toward higher valuation areas.
The outlook remains constructive as long as current accumulation behavior sustains, with market sentiment leaning toward a recovery-driven advance in the near term.
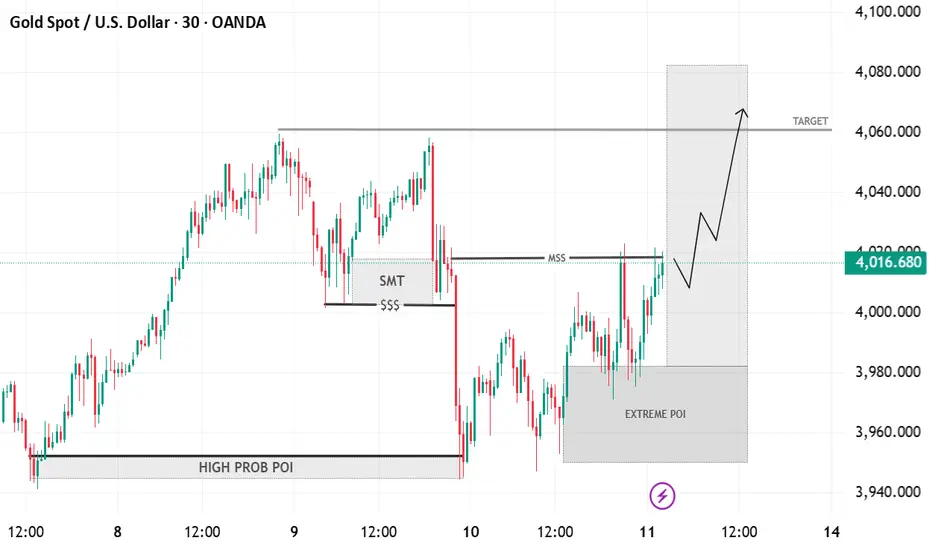
Gold–Bullish Reversal Setup from Extreme POI Toward 4060 TargetTimeframe: 30-minute chart (XAU/USD – Gold Spot vs U.S. Dollar)
Market Structure:
Price made a structural low (SMT) around the $$$ liquidity zone.
A Market Structure Shift (MSS) occurred as price broke above short-term highs.
POI (Point of Interest) Zones:
High Probability POI: Previous accumulation zone that caused a bullish impulse.
Extreme POI: Current demand zone (around 3960–3980), where price is rebounding.
Current Price Action:
Price has reacted bullishly from the Extreme POI.
The breakout above MSS signals possible continuation to the upside.
Target Zone:
The shaded grey target area (~4060–4080) aligns with previous liquidity highs.
Bias:
Bullish short-term bias toward 4060–4080 zone, assuming the demand zone holds.
Break below Extreme POI would invalidate the setup and suggest deeper retracement.
Gold (XAU/USD) Rebound Setup – Support Holding Strong!Analysis:
Gold (XAU/USD) is showing signs of bullish strength after testing the $4,000–$3,970 support zone, where buyers are stepping back in. The recent consolidation above support suggests a potential reversal and continuation of the uptrend.
The setup highlights:
Support Zone: Around $3,970 – $4,000, acting as a key accumulation area.
Bullish Trigger: A breakout above minor resistance could drive momentum higher.
Targets:
🎯 Target 1: $4,101
🎯 Target 2: $4,150
🎯 Target 3: $4,200
Stop Loss: Below $3,970 to protect against a downside breakout.
📈 Outlook: As long as price sustains above support, Gold remains bullish, aiming for a breakout towards $4,150 and $4,200 levels.

GOLD 03/09: TIME TO SELL, WHERE TO BUY TODAY?1. Overall Analysis
Elliott Wave:
Wave (5) seems to have completed, signalling a possible distribution phase.
The market is likely moving into an ABC corrective structure, with Wave A expected to retrace to key Fibonacci levels before a Wave B rebound.
Smart Money Concept (SMC):
The Break of Structure (BOS) is confirmed.
There’s a Fair Value Gap (FVG) around the 3,500 level, which price may revisit to fill.
The CP Order Buy Zone near 3,485 indicates a strong liquidity area for potential medium- to long-term buying opportunities.
2. SELL Plan
SELL Zone: 3,550 – 3,552
Stop Loss (SL): 3,558
Take Profit (TP):
TP1: 3,526 (Fib 0.266 – short-term target)
TP2: 3,517 (Fib 0.382 – first support level)
TP3: 3,508 – 3,506 (BUY SCALP/FVG zone)
Logic:
Price has completed Wave 5, forming a distribution zone.
Smart Money may sweep liquidity around 3,550 before pushing the price down to test the FVG levels.
3. BUY SCALP Plan
BUY Zone: 3,508 – 3,506 (aligning with the FVG)
Stop Loss (SL): 3,499
Take Profit (TP):
TP1: 3,526 (Fib 0.266 retracement)
TP2: 3,540 (previous reaction level)
Logic:
This zone lines up with an unfilled FVG and the 0.5–0.618 retracement levels of the last leg.
If price holds its bullish structure here, Wave B could stage a strong rebound.
4. Medium-Term BUY Zone
CP Order Buy Zone: Around 3,485
Logic:
This area acts as a major liquidity pool, often targeted by Smart Money.
If price breaks below 3,506, this level could be the next key spot for medium-term accumulation, with an eye on a Wave C move back toward 3,550+.
5. Main Scenarios
Primary Setup:
Look for a SELL entry at 3,550 – 3,552 with SL at 3,558, and scale out profits at support levels.
Watch for a BUY SCALP setup in the 3,508 – 3,506 range if bullish confirmation appears.
Alternate Setup:
If price dips below 3,506 and keeps falling, wait for confirmation at 3,485 to build a medium-term long position.
6. Risk Management
Always place tight stop-losses for each setup.
For SELL trades: lower your position size during high-impact news events.
For BUY SCALP trades: only enter after confirmation signals, such as a pin bar, engulfing candle, or a minor structure break on the M5/M15 charts.

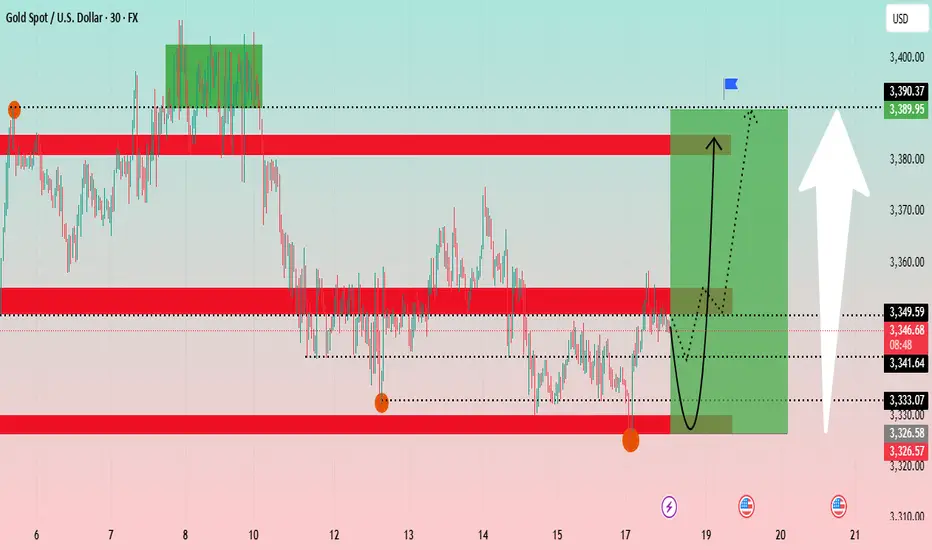
Gold Technical Analysis: Navigating Key Support ?The Gold chart shows a 30-minute timeframe analysis, highlighting recent price consolidation and potential future trends. The analysis suggests a potential V-shape recovery for gold.
Key Levels: The price is currently at a critical juncture, having tested a support zone around 3,326 - 3,333 USD. This zone has proven to be a strong base. Above it, a significant resistance zone is identified between 3,349 - 3,353 USD. Further up, another major resistance is at approximately 3,389 USD.
Price Action: The price has recently experienced a sharp decline and is now in a consolidation phase. The chart projects a potential bounce from the current levels, indicated by the black curved arrow, with the target being the upper resistance zone around 3,389 USD. The green shaded box illustrates the potential upward movement from the current position.
Conclusion: Gold appears to be at a key support level and could be poised for a rally if it successfully breaks above the immediate resistance zone.
Bitcoin (BTC/USDT) 4-Hour Chart Analysis
The Bitcoin chart shows a 4-hour timeframe analysis, focusing on a short-term uptrend channel.
Key Levels: The price is trading within an ascending channel. A significant support zone is identified between 112,000 - 114,000 USDT. A "weak supply zone" is marked around 118,000 USDT, which is currently acting as support. A major resistance is at approximately 124,564 USDT.
Price Action: After a strong push towards the channel's upper boundary, the price has pulled back and is now retesting the "weak supply zone." The blue and red arrows project two possible scenarios: a bounce back up towards the channel's high, or a deeper retracement towards the channel's lower trendline. The price movement appears to be following the blue projected path.
Indicators: The Ichimoku cloud and RSI strategy are used to confirm the trend and identify entry/exit points. The price is above the Ichimoku cloud, indicating a bullish trend.
Conclusion: Bitcoin is at a pivotal point within its uptrend channel. Its ability to hold the 118,000 USDT level will be crucial for a potential re-test of the 124,564 USDT resistance.
XAUUSD Bullish Trend Continuation: Potential Move to $3,400!The price action shows a higher high ("high") and a higher low ("low"), which are characteristic of an uptrend. An upward trendline has been established, connecting a series of higher lows, which is acting as a dynamic support level. A significant horizontal support zone has also been identified around the $3,260 - $3,280 price range, where the price previously found support.
Recently, the price experienced a pullback and bounced off the upward trendline. The analysis anticipates a continuation of the upward momentum toward a key resistance zone. This resistance zone is located around the $3,400 - $3,420 level. A specific target price of $3,408.833 is highlighted within this zone, suggesting a potential area where the upward movement might pause or reverse.
The chart includes a potential corrective wave pattern labeled with "C"s, indicating a recent three-wave pullback within the larger trend. The current price is shown at $3,353.520, positioned above both the horizontal support and the upward trendline, reinforcing the bullish sentiment.

Technical Analysis on XAU/USD (Gold vs USD) – Bullish Reversal 📊 Chart Overview:
This chart of XAU/USD (Gold) on a lower timeframe shows a potential bullish reversal setup. The price action has formed a series of lower highs and lower lows, but now a bullish momentum is building up, suggesting a possible breakout to the upside.
🔍 Key Observations:
🟠 Swing Points Identified:
The orange circles mark significant swing highs and lows, clearly outlining a recent downtrend.
The latest swing low (bottom-right) shows a strong rejection with a bullish engulfing candle forming, indicating buyer interest.
📦 Demand Zone (Support Area):
The grey rectangle near the lower region marks a demand zone where buyers have stepped in before.
Price has reacted strongly from this zone again, validating it as a key support level.
📉 Resistance Turned Potential Breakout Zone:
The red line (~3,291.416) represents a resistance level that was previously support.
Price has broken above it and now appears to be retesting it, indicating a possible retest-confirmation for a bullish continuation.
🎯 Target & Risk Management:
✅ Entry: Confirmed breakout and retest around 3,291.
📈 Target: 3,364.819 (green zone above), based on previous resistance.
❌ Stop Loss: Below 3,267.772, the recent swing low.
The setup offers a favorable risk-to-reward ratio.
🧭 Projection Path:
The white arrowed path illustrates a likely pullback before continuation upward, suggesting a bullish structure if confirmed.
✅ Conclusion:
Gold is showing signs of a bullish reversal from a well-defined demand zone, with a potential rally toward the 3,365 area. A successful retest of the broken resistance as new support would strengthen the bullish bias.
📌 Watch closely for confirmation candles on the retest before entering.

Bitcoin vs Gold trade Battle:-As you can see Bitcoin and Gold chart . You can notice that both both charts are inverse bitcoin making every day higher high formation same time gold made its low and next days its recover almost half but next2 session gold are declining its prices but same time bitcoin made all time high .
Conclusion:- Bitcoin have hardest resistance that now facing @ 82500$ there is 2 possibilities for btc . Consolidation for few days at least 5 days or fall down to 74000-76000$ area .
Gold :-If BITCOIN gonna fall sharply than gold can rise and shine and also hold the level of 2700$ .
Stay tuned for more updates and follow me .

BUY GOLD 10 JUNE its showing a good upward momentum BUY GOLD 10 JUNE its showing a good upward momentum
with strong double confermation it will go up
first one technically showing a strong trendline faceing
secondly its faceing a stong support
volumes are also down
its a good one for buy
BUY GOLD 10 JUNE its showing a good upward momentum
with strong double confermation it will go up
first one technically showing a strong trendline faceing
secondly its faceing a stong support
volumes are also down
its a good one for buy

Gold Order Block in 1HR | Look BulishIn gold form order block in 1hr time frame and also long 4hr order block is there.
if you are trading in gold so Look for Buy
LIKE,SHARE,FOLLOW
( mentor of your mentor)

Xauusd long possible Xauusd gold buy @ 1977
Stop loss 1967 (100 pips)
Target 2010 (330 pips)
Lot size recommended 0.01 for 100 usd equity
Lot size recommended 0.10 for 1000 usd equity
Open a buy position on gold and thanks me later
Follow fxlifestylemanpritfx for more updates

GOLD target for all mcx traderHi every one
I am gold king
you can watch my anlysis
You can start Investing in gold
Note: this is not buy sale tips
this is my perfect analysis gann cycle
R u ready

GOLD long setup (check the description)we have captured the down trend since the beinginng on trend change
currently price has breached some fair value area and ob's from medium time frame
as i have captured the big trend personally i wont be shorting instead will wait for my buying zone
58810 and 58665 is new current resistace
58275 and 58120 is the level where price would like wick this level to sweep the liquidity and stop loss of remaining buyers
there after 58090 - 57970 would be the non mitigated old order block where there will be order and we can new buying from this level
57650 to 57875 will be last demand zone for gold where it will be value zone for buyers
