Gold (XAU/USD) 4H Chart Analysis – Short-Term Reversal from ?Technical Overview:
Gold has recently rebounded from a High Demand Zone around the $3,900–$3,910 region, showing clear signs of buyer re-entry after a prolonged bearish correction. The candle structure suggests strong bullish intent, with higher lows forming and a potential continuation toward the next liquidity area.
Key Observations:
🔹 High Demand Zone: Price reacted strongly here, indicating institutional buying pressure.
🔹 High Prop POI (Point of Interest): Served as a key accumulation level before the breakout.
🔹 SMC Trap: Indicates a prior liquidity grab, trapping late sellers before the move up.
🔹 Bullish Momentum Building: Consecutive bullish candles after rejection from the demand zone strengthen the reversal bias.
Target Projection:
🎯 Immediate Target: $4,080 – $4,100 (aligned with local resistance and liquidity grab zone).
🛑 Support: $3,905 (must hold to maintain bullish structure).
💎 Extended Target (if momentum continues): $4,160 – $4,180 (previous major swing high zone).
Summary:
Gold is showing a short-term recovery phase within a broader bullish structure. A confirmed 4H close above $4,030 would likely propel price toward the $4,100 region, while a drop below $3,900 would invalidate the bullish setup.
📊 Suggested Title:
"Gold Rebounds from Key Demand Zone, Eyes $4,100 Resistance 🔥"
Goldbuysetup

“Gold Rebounds from Demand Zone — Short-Term Recovery Ahead”Analysis:
Gold (XAU/USD) on the 4-hour chart shows a strong corrective decline after forming an SMC trap near the 4,250–4,300 zone, where liquidity was swept before a sharp selloff. Price has now reached the High Probability POI (Point of Interest) around the 3,850–3,880 region, showing early signs of a bullish reaction.
The recent candle structure indicates buyers are stepping in from this demand zone, confirming a potential short-term reversal. If momentum sustains, the first target zone lies around 3,950–3,980, aligning with minor resistance and previous imbalance fill.
Outlook:
📈 Bias: Bullish correction (short-term)
🧭 Key Support: 3,850 – 3,880
🎯 Target: 3,950 – 3,980
⚠️ Invalidation: Break below 3,840 may reopen bearish continuation toward 3,780

Gold at Key Support — Will XAUUSD Bounce From 3900 - 3895?Gold is testing a crucial demand zone at 3900–3895, where buyers have previously stepped in.
If this level continues to hold, we could see a bullish intraday rebound play out.
📊 Trade Setup
Buy Zone: 3900 – 3895
Stop Loss: 3878
Target 1: 3924
Target 2: 3936
💡 Technical Outlook
Price action is hinting at renewed buying pressure around 3900, with candles showing wicks and slowing momentum on the downside.
This could indicate that bulls are defending this key zone, setting up for a short-term bounce toward the 3920–3935 area.
Watch for:
A bullish engulfing candle or strong rejection wick near 3895
Increasing volume confirmation on smaller timeframes (M15–H1)
🧭 Bias
✅ Expecting a bullish bounce from the 3900–3895 zone
❌ Invalidated if price closes below 3878
⚠️ Disclaimer
This is for educational purposes only — not financial advice. Always manage your risk and use proper position sizing.

Gold (XAU/USD) Breakout Rally Toward New HighsAnalysis:
Gold (XAU/USD) continues its strong bullish momentum on the 4-hour chart, forming a series of higher highs and higher lows, confirming a sustained uptrend. The recent breakout above the resistance zone near $4,150–$4,170 indicates renewed buying interest and momentum buildup.
After a brief retest of the breakout area, price has started climbing again — a sign of trend continuation supported by bullish candle formations and strong market sentiment.
Technical Outlook:
Support Zone: $4,140 – $4,170 (previous resistance turned support)
Bullish Confirmation: Continuation pattern with clean structure and volume support
Momentum Bias: Strongly bullish while above $4,150
🎯 Target: $4,300 – $4,320 zone
🛑 Stop Loss: Below $4,140 to limit downside risk
📈 Summary:
As long as gold stays above the breakout level of $4,170, the market remains bullish, with upside potential toward $4,300–$4,320, aligning with the next major resistance area.

GOLD SHOWING A GOOD UP MOVE WITH 1:8 RISK REWARD GOLD SHOWING A GOOD UP MOVE WITH 1:8 RISK REWARD
DUE TO THESE REASON
A. its following a rectangle pattern that stocked the market
which preventing the market to move any one direction now it trying to break the strong resistant lable
B. after the break of this rectangle it will boost the market potential for break
C. also its resisting from a strong neckline the neckline also got weeker ald the price is ready to break in the outer region
all of these reason are indicating the same thing its ready for breakout BREAKOUT trading are follws good risk reward
please dont use more than one percentage of your capitalfollow risk reward and tradeing rules
that will help you to to become a bettertrader
thank you

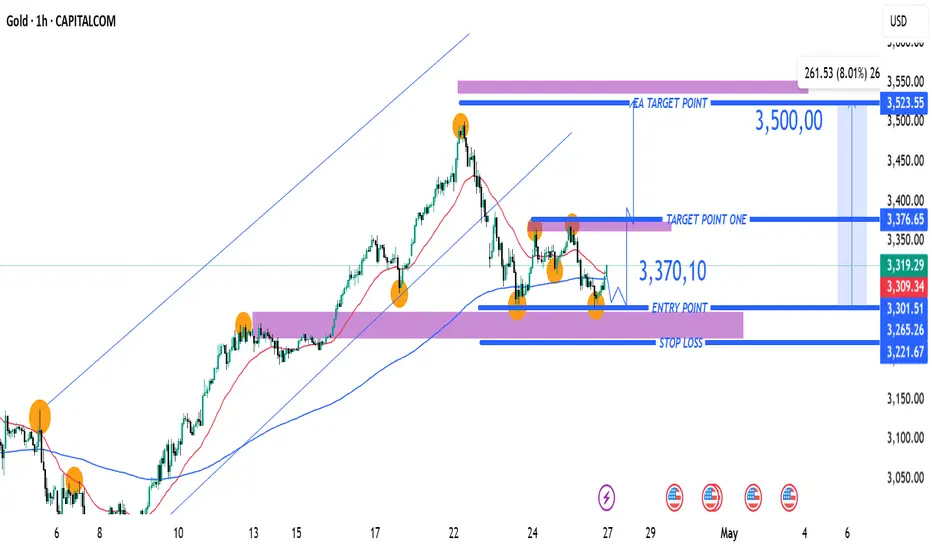
(XAU/USD) 1H Chart: Long Setup Targeting 3,500 with Key SupportEntry Point: Suggested near 3,301.51 USD (marked with the purple support zone).
Stop Loss Zone: Below 3,266.87 to 3,221.67 USD (marked in blue and purple). This is where you limit your loss if the trade goes wrong.
First Target (Target Point One): 3,376.65 USD.
Final Target (EA Target Point): 3,523.55 USD (~8.26% potential gain from entry).
Main Setup Idea:
The price is consolidating around the support zone.
There's a plan to buy (go long) at the purple zone (Entry Point) and aim for the two target points
Gold (XAUUSD) Reversal Setup: Buy Opportunity from Demand Zone t GOLD (XAUUSD)
Timeframe: 30-minute
Indicators:
EMA 30 (Red): 3,000.22
EMA 200 (Blue): 3,042.92
🔍 Price Action & Zones
Current Price: 2,982.27
Support Zone (Demand Zone): ~2,940.27 (highlighted in purple, labeled as STOP LOSS)
Resistance Zone (Supply Zone): ~3,040.17–3,042.92 (labeled as EA TARGET POINT)
📈 Trade Idea (Based on Drawing)
Strategy: Buy from demand zone, targeting supply zone
Entry: Near 2,940.27
Stop Loss: Slightly below 2,940.27
Target: ~3,040.17
Risk to Reward: ~1:2.6 (visually)
📊 EMA Dynamics
Bearish Bias in the Medium Term: Price is trading below the 200 EMA, indicating an overall bearish trend.
Short-Term Weakness: The price has also dropped below the 30 EMA, confirming bearish momentum in the short run.
🔄 Possible Scenario
Price is currently heading back down toward the demand zone, where a bounce is anticipated.
If it respects that zone, we may see a reversal toward the target zone at ~3,040.
If it breaks below 2,940, the setup would be invalidated (stop loss hit).
⚠️ Things to Watch
Rejection or support confirmation at 2,940 zone is key before entry.
Be cautious of continued bearish momentum if economic news or global risk sentiment shifts.
Look for bullish reversal patterns (e.g. hammer, bullish engulfing) at the demand zone for confirmation.

Gold (XAUUSD) 30-Minute Trade Setup: Bullish Reversal from SuppoThis chart represents a trading analysis for Gold (XAUUSD) on a 30-minute timeframe. Here are the key points from the chart:
Technical Indicators:
EMA (30, close) - Red Line: 3,124.52 (shorter-term trend)
EMA (200, close) - Blue Line: 3,090.41 (longer-term trend)
Trade Setup:
Entry Point: 3,108.21
Stop Loss: 3,098.52 (just below the support zone)
Target Point: 3,149.04 (potential profit level)
Analysis:
The price is currently bouncing from a purple support zone, which aligns with a short-term retracement.
The 30 EMA (red) is currently above the price, indicating short-term resistance.
The 200 EMA (blue) is significantly lower, showing that the overall trend is still bullish.
A potential long (buy) trade is suggested, as price is expected to reverse from the support level towards the target point of 3,149.04.
Risk-to-Reward Ratio:
The stop loss is set below the key support level to minimize risk.
The target price provides a significant profit potential.
Conclusion:
If price holds above 3,108.21, there is a strong bullish case.
If price breaks below 3,098.52, the bullish setup may become invalid.
Monitoring the 30 EMA resistance will be crucial for confirmation.

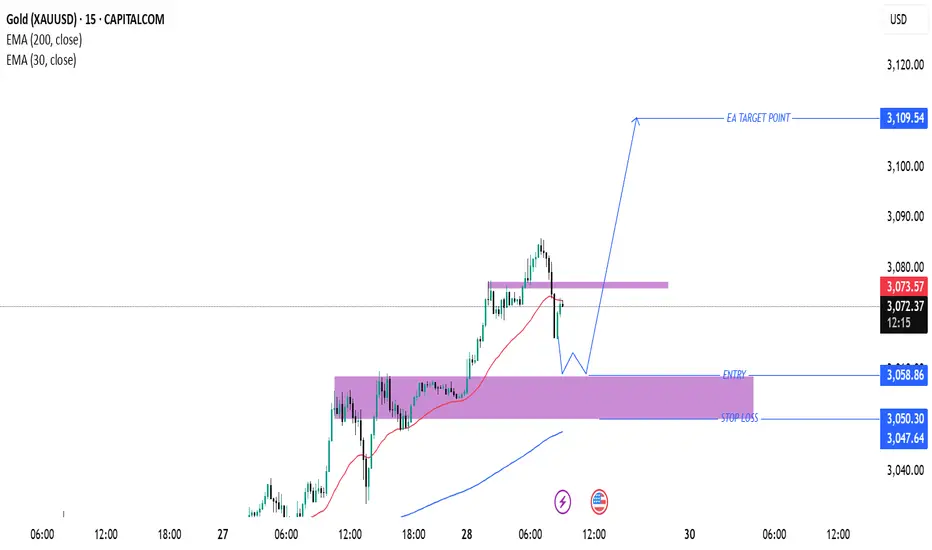
Gold (XAU/USD) Trade Setup & Analysis – March 28, 2025Gold (XAU/USD) Trade Analysis – March 28, 2025
Current Market Overview:
Price: $3,073.77
Recent High: $3,074.00
Recent Low: $3,070.29
EMA (30): $3,073.71 (Short-term trend)
EMA (200): $3,047.40 (Long-term trend)
Technical Analysis:
Support & Demand Zone:
The highlighted purple area represents a strong support zone around $3,050 - $3,058, where buyers may step in.
The price is currently pulling back into this area, indicating a potential bullish reversal opportunity.
Bullish Projection:
The chart suggests a retracement to the demand zone, followed by a strong bullish continuation.
A breakout from the minor resistance zone around $3,073 - $3,075 would confirm the uptrend.
Target & Stop Loss:
Entry Zone: Around $3,058.86 (near the demand zone).
Stop Loss: Below $3,047.40 (under the key support and EMA 200).
Target: $3,109.54 (significant resistance level and profit-taking point).
Trade Strategy:
Wait for confirmation of a bullish rejection at the support zone before entering.
If price breaks above the minor resistance, it could indicate momentum toward the target.
Risk-to-reward ratio looks favorable with a potential upside move of +50 points if the trend continues.
Conclusion:
The setup favors a bullish continuation after a pullback.
Key Levels to Watch: $3,058 (entry), $3,047 (stop loss), and $3,109 (target).
Traders should monitor price action at the demand zone before entering a long position.
GOLD SHOWING A GOOD UP MOVE WITH 1:10 RISK REWARD CPI NEWS SETUPSURESHOOT SETUP CPI news tradeing
GOLD SHOWING A GOOD UP MOVE WITH 1:10 RISK REWARD
CPI NEWS SETUP
DUE TO THESE REASON
A. its following a rectangle pattern that stocked the market
which preventing the market to move any one direction now it trying to break the strong resistant lable
B. after the break of this rectangle it will boost the market potential for break
C. also its resisting from a strong neckline the neckline also got weeker ald the price is ready to break in the outer region
all of these reason are indicating the same thing its ready for breakout BREAKOUT trading are follws good risk reward
please dont use more than one percentage of your capitalfollow risk reward and tradeing rules
that will help you to to become a bettertrader
thank you

Buy Goldbees for the long runStart Buying Goldbees as you wont get it at the current levels after 1 Jan 2023. The Chart is very clearly depicting a strong Bullish Upmove on Gold.
It could be due to high inflation or it could be due to rising commodity prices or it may be due to Government printing money. Whatever the reason is look at Rate of Change indicator below. The Roc is depicting that there is a clear breakout and the Current prices are above 6M 12M 24M & 36M EMA.

GoldGold at important support, if it failing to sustain orange line then green chart is good buy level for investments.
Below 46462 and sustains then gold will fall upto 45000 or 44600

GOLD Near Support LevelsGold Comex is trading near channel support levels of 1680-1690$ One can Go Long at these levels, Also its trading at 20 Months average of 1691$ per ounce. We may see commodity resuming its uptrend.
