Gold Spot Ready For Big Move in Coming Days - 30 October 2025Gold prices may see a major breakout soon. Traders eye upcoming data and Fed signals for the next big move in the gold spot market.
Goldforecast

Gold Bulls Eye Major Resistance – Can They Break Through?Gold continues to trade in an upward trend, recovering strongly from recent lows. On the 4-hour chart, price is moving closer to a falling resistance trendline, which has acted as a major barrier in the past. This makes the upcoming resistance zone very important for short-term traders.
The next key resistance lies between $4250–$4265, where profit booking can be expected. This area has multiple technical confluences, and traders should monitor how price reacts here. A successful breakout and close above this zone could lead to an extended rally toward $4320–$4350.
However, if price faces rejection from this trendline, a short-term pullback toward the $4120–$4080 support zone would be normal and healthy for the trend. Despite the short-term caution, the overall market structure for Gold remains bullish as long as the price stays above support.
Disclaimer: This analysis is for educational purposes only and should not be taken as financial advice. Please do your own research or consult your financial advisor before investing.
Analysis By @TraderRahulPal | More analysis & educational content on my profile.
If you found this helpful, don’t forget to like and follow for regular updates.

Gold Reaches Exhaustion Zone — Sell Momentum LoadingGold Reaches Exhaustion Zone — Sell Momentum Loading
Gold is showing signs of upside exhaustion, with price repeatedly failing to gain momentum as it approaches the mid-range premium zone near the 4,245 area. The recent structure reflects a market transitioning from short-term recovery into renewed weakness, with each bullish attempt losing strength faster than the previous one.
Order flow remains dominated by distribution behaviour, and the chart signals a potential liquidity sweep followed by a bearish continuation. The projected rejection zone suggests that buyers are running into an area of heavy supply, where institutional activity has previously triggered aggressive downside extensions. Volume distribution across the range also highlights diminishing demand at higher prices, reinforcing the likelihood of a downward rotation.
As the market continues to respect its broader range ceiling, the probability increases for price to revisit deeper value regions. With momentum fading and the current leg showing hesitation, gold is positioned for a potential sell-side move toward lower mean-reversion levels.

XAUUSD | Bulls Hold Control Above 4070 - Eyes on 4090–4100 ZoneGold (XAUUSD) continues to show strong bullish structure, and price action above the 4070 key support reinforces buyers’ dominance.
If price sustains above this level, the next upside liquidity area sits at 4090–4100 , a zone where previous reactions have occurred.
Bullish Scenario:
Holding above 4070 keeps momentum pointed toward 4082 and then the 4090 zone.
The bullish outlook remains valid as long as price stays above 4059, which currently acts as intraday invalidation.
What I’m Watching:
A clean intraday consolidation above 4070
Momentum strength into 4082
Whether buyers can break into the 4090–4100 resistance pocket
This setup highlights how the market could behave, not financial advice—just educational analysis.
📌 Disclaimer:
This analysis is for educational purposes only and is not financial advice. Always manage risk and follow your trading plan.
Your feedback drives our content and keeps everyone trading smarter. Let’s make those pips together! 🚀
Happy Trading,
– The InvestPro Team

XAUUSD Repricing MoveXAUUSD Repricing Move
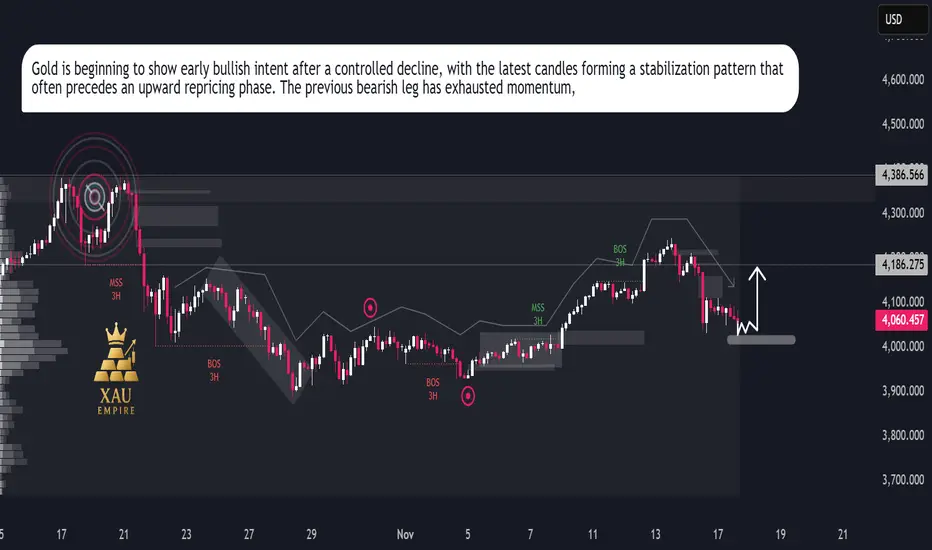
Gold continues to trade inside a broader corrective cycle, with price action showing a clear transition from prior strength into a short-term distribution phase. The chart highlights repeated breaks in market structure and shifts in order flow, signalling a controlled decline built on institutional rebalancing.
After the recent downside sweep, price is now hovering around a key reaction zone where liquidity has already been absorbed. Sellers dominated the previous swing, but the latest candles show a slowdown in bearish momentum, indicating that the market may be preparing for a corrective repricing attempt.
The volume footprint on the left side of the chart reflects previous heavy activity from major participants, and the current area sits beneath an inefficiency pocket that remains unmitigated. This opens the door for a short-term bullish rotation if buyers defend this accumulation region. The marked arrow in your chart aligns with a potential internal shift where gold could attempt a short retracement toward the mid-range of the prior move.
Momentum indicators embedded in the structure show reduced volatility, meaning the market may be positioning itself for a liquidity-driven bounce rather than continuing straight lower. The next sessions will reveal whether this zone becomes a launch point for a recovery leg or if the broader trend resumes its downward trajectory.
XAUUSD / GOLD Analysis – Buy Opportunity Ahead!Gold has formed a strong double-bottom support zone at 4095 – 4090, signaling potential bullish momentum. As long as Gold remains above 4080, the bias stays bullish for short-term buyers.
🧭 Trading Plan:
Buy Zone: 4095 – 4090
Stop Loss: Below 4080 (close basis)
Targets: 🎯 4010, 4030, 4040
💡 Technical Reasoning:
Double-bottom pattern confirmation on 1H/4H timeframe
RSI bouncing from oversold area
Price rejecting key support zone multiple times
Potential bullish divergence forming
⚠️ Risk Management:
Always use proper risk-to-reward management and position sizing. Gold can move fast during high volatility sessions — keep your stops tight and targets realistic.
🔔 Conclusion:
If Gold holds above 4080, buyers could dominate the next leg. Watch price action closely near 4095 – 4090 for entry confirmation.

Gold – Distribution Before DropGold – Distribution Before Drop
Gold is showing signs of exhaustion after the recent corrective bounce. The 3H market structure highlights a clear distribution pattern, as price continues to reject from the 4,100–4,250 supply zone. Repeated Break of Structure (BOS) signals that bearish momentum remains dominant.
Institutional activity suggests that liquidity is being built above local highs, preparing for another downside leg. The current market sentiment stays bearish as long as price trades below the key premium area. A confirmed rejection from this zone could trigger a decline toward the 3,904 liquidity pool.
Only a breakout and hold above 4,250 would invalidate this scenario and shift bias back to bullish accumulation.

GOLD LIKELY TO RETRACE INTO DEMAND BEFORE EXTENDING HIGHER📅 November 10, 2025 | XAUUSD Daily Trading Plan 💰
🧭 Market Structure Overview
Gold continues to trade within a bullish structure, confirmed by multiple Breaks of Structure (BOS) and a Change of Character (CHoCH) on the 30M timeframe.
The market recently printed a Weak High at 4070, indicating that liquidity remains above and buyers are still in control.
After a strong impulsive leg to the upside, price is expected to retrace into the nearest demand zones before resuming the bullish leg. The unmitigated order blocks around 4001–3999 and 3969–3967 present high-probability re-entry areas.
📊 Technical Breakdown
Structure: Bullish
Liquidity: Equal highs at 4070 likely to be swept before deeper retracement.
Zones of Interest:
Demand #1 → 4001–3999
Demand #2 → 3969–3967
Fair Value Gap: Between 4005–3990 offers potential rebalancing area.
🎯 Trading Plan (LONG Bias)
Entry Zone 1: 4001 – 3999
Entry Zone 2: 3969 – 3967
Take Profit (TP): 4078
Stop Loss (SL): 3994 (6$ risk)
Bias: ✅ LONG
🧩 Rationale
The recent bullish impulse following the CHoCH confirms a structural shift to the upside.
With liquidity resting above the Weak High, we anticipate a short-term retracement to fill imbalance and tap into discount demand zones.
From these zones, bullish continuation towards 4078 remains the most probable scenario — unless price breaks below 3965, which would invalidate the setup.
📌 Summary
Price remains bullish with strong momentum.
Wait for retracement into the identified demand zones for a high-probability long continuation setup.

GOLD SHOWS WEAKNESS – SELL THE RALLY TOWARD DEMAND!📅 WEEKLY PLAN – November 8, 2025
🚀 HOOK TITLE:
🔥 GOLD SHOWS WEAKNESS – SELL THE RALLY TOWARD DEMAND! 🔥
📊 Market Analysis:
Gold continues to respect a bearish market structure, showing clear Break of Structure (BOS) and Change of Character (CHoCH) patterns on the 2H chart.
After multiple rejections from the upper zones, price is likely forming a lower high before heading to retest the demand below.
The market is currently consolidating between 4020–3980, suggesting a potential liquidity grab before the next impulsive drop.
🎯 Trade Plan:
🔹 Setup 1 – Sell Zone (4037–4039)
Entry: 4037–4039
SL: 4043
TP1: 4018
TP2: 3976
TP3: 3931
🔹 Setup 2 – Sell Zone (4018–4020)
Entry: 4018–4020
SL: 4024
TP1: 3976
TP2: 3931
TP3: 3929
🔹 Setup 3 – Buy Reaction Zone (optional scalp)
Entry: 3931–3929
SL: 3923
TP1: 3974
TP2: 4018
(Only consider if strong bullish rejection or FVG fill appears)
📈 Outlook:
Bias remains bearish unless price breaks and closes above 4043 (invalidating lower-high structure).
Smart traders should sell into strength, waiting for confirmation wicks or bearish engulfing on lower timeframes (M15–M30) inside the marked zones.
📌 Weekly Bias: 🟥 SHORT / SELL MODE
Targeting the imbalance fill toward 3930 area.

XAUUSD – Consolidation Before Drop**Gold (XAUUSD) – Consolidation Before Potential Downside Move**
Gold continues to hover in a consolidation range after the recent breakout and structural shift on the 3H chart. The bullish momentum that previously dominated has now slowed, indicating a possible distribution phase forming near the $4,050–$4,100 zone.
The market structure shows repeated rejections at the upper boundary, suggesting that buyers are losing strength. With BOS (Break of Structure) confirmations in the recent candles and a clear lack of higher highs, a potential downside continuation could unfold once the current range is broken.
If sellers take control below $3,978, the next liquidity targets lie around **$3,886** and possibly **$3,614**. This scenario aligns with the broader retracement expectation after a strong prior uptrend.
However, a confirmed breakout above the consolidation area would shift the short-term bias back to bullish, with upside potential toward **$4,248** and beyond.
**Market Outlook:** Neutral → Bearish
**Bias:** Short-term corrective move expected
**Key Levels:**
* Resistance: $4,050 – $4,100
* Support: $3,886 – $3,614
**Tags:** #Gold #XAUUSD #GoldAnalysis #XAUUSDforecast #GoldPricePrediction #GoldTrading #GoldMarket #Commodities #TradingViewIdeas

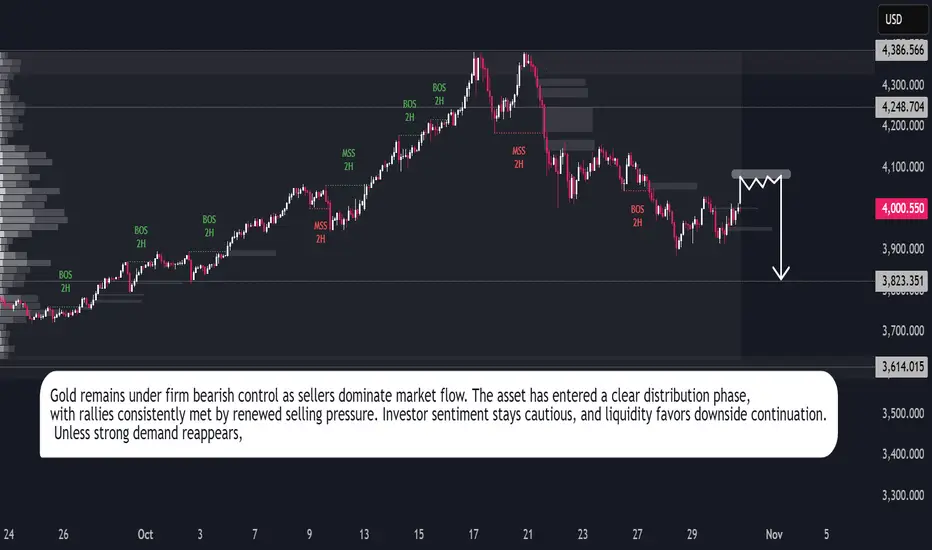
Gold Outlook: Bears Stay in ControlGold continues to operate within a bearish market environment characterized by persistent liquidation and declining momentum. The recent structural shift reflects an ongoing reallocation of capital away from defensive metals toward higher-yield instruments, signaling a broader change in market positioning.
Trading activity indicates that each upward movement is being met with renewed selling interest, suggesting limited participation from institutional buyers. This behavior aligns with the prevailing sentiment of caution, as investors prioritize stability over speculative exposure.
The broader outlook remains subdued, with market conditions favoring continued downside until clearer evidence of renewed demand emerges. Gold’s performance reflects a phase of market adjustment, where declining liquidity and moderate volatility reinforce the persistence of bearish sentiment across the short-term horizon.
GOLD READY FOR A BULLISH REBIRTH | Pullback Buy Setup Inside🧭 DAILY TRADING PLAN — GOLD (XAU/USD)
Date: Oct 30, 2025
Main timeframe: H1 – M30
Strategy: SMC + EMA Confluence + Trendline Reversal
🧩 MARKET CONTEXT
Gold has just completed a liquidity sweep below 3920 and is forming a bullish corrective structure along the rising trendline.
The short-term structure shows CHoCH → BOS confirmation around 3950–3970, signaling a potential reversal phase.
Price is currently testing the EMA zone (H1) and approaching the key supply at 4026–4028, where short-term profit-taking might appear.
Overall, market sentiment remains bullish toward 4020–4030, but a short retracement could occur before the next leg up.
🎯 TRADE PLAN
BUY SETUP #1
Entry: 3950 – 3948
SL: 3943
TP: 4018 → 4026
(R:R ≈ 1:3)
If price fails to hold above 3948, wait for a deeper liquidity grab:
BUY SETUP #2
Entry: 3921 – 3919
SL: 3913
TP: 3980 → 4020
(Liquidity sweep + trendline confluence)
SELL SETUP (Counter-trade)
Entry: 4026 – 4028 (rejection zone)
SL: 4033
TP: 3970 – 3950
(Only valid if bearish BOS appears on M15)
🔍 TECHNICAL INSIGHT
Structure flipped bullish after CHoCH & BOS on M30
Trendline support remains intact
EMA 34 crossing upward on H1 – confirming short-term momentum
Main liquidity pools sit around 3919 (below) and 4028 (above)
Expect pullback → bullish continuation as long as price stays above 3948

Gold Forecast — Market Turning BullishGold (XAU/USD) maintains a strong long-term bullish trend, supported by rising investor demand and global macroeconomic stability. After completing a healthy correction phase, the market is showing renewed strength, indicating a potential continuation of the broader uptrend.
Current price action reflects accumulation behavior among institutional traders, signaling confidence in gold’s long-term value growth. The consistent pattern of higher lows and steady momentum suggests that buyers are firmly in control, preparing for another upward expansion cycle.
From a fundamental perspective, global inflation concerns, a weaker U.S. dollar, and geopolitical tensions continue to support gold prices. Investors are increasingly seeking protection in safe-haven assets, which further strengthens gold’s long-term position in the market.
Technical structure and sentiment both align with a buy-side outlook, highlighting the potential for gold to extend gains as liquidity continues to build in the current price zones.
In summary, gold remains in a strong buying phase, with market data, investor sentiment, and macroeconomic indicators all favoring sustained upward momentum.
Keywords: Gold forecast, XAU/USD analysis, gold long-term trend, gold price outlook, bullish gold market, gold accumulation phase, forex gold trading, gold price prediction 2025.
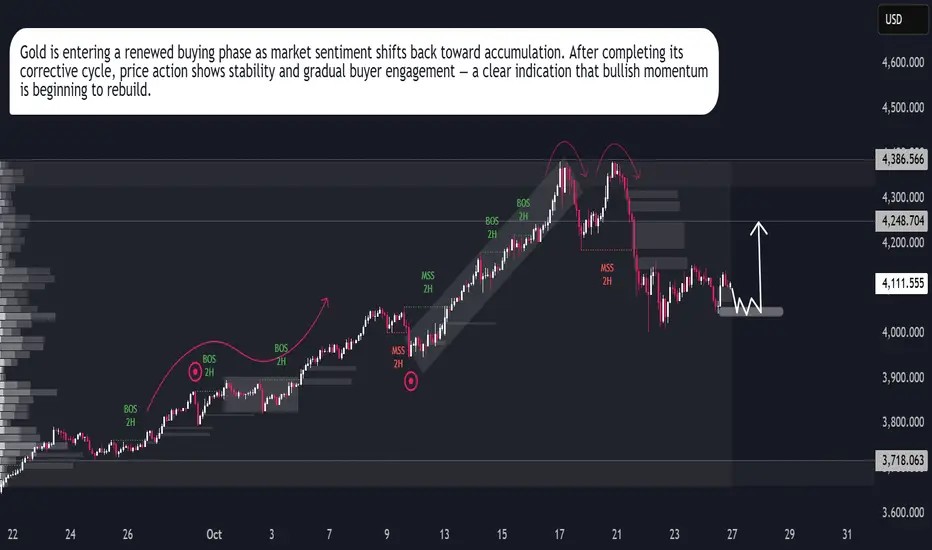
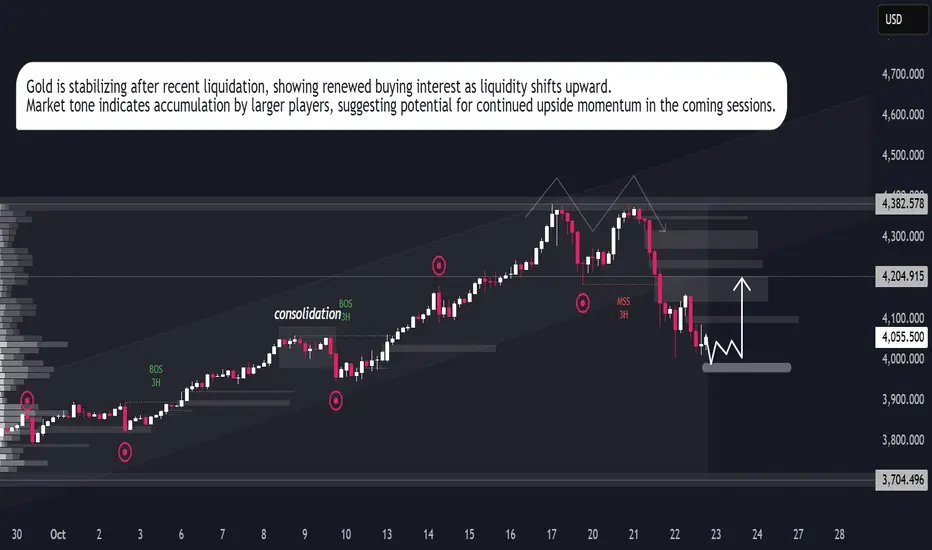
Buy Pressure Building on GoldGold is displaying signs of buyer re-entry after a period of controlled downside movement. The recent liquidity sweep around the lower range indicates that short-term selling pressure has been largely absorbed, creating favorable conditions for a potential upward expansion.
Market activity suggests renewed interest from institutional participants accumulating within the current price zone. The consolidation phase appears to be forming a base, signaling the possibility of a directional shift as liquidity gradually migrates upward. Increasing momentum on the lower end of the range reflects confidence returning to the market, setting the stage for a possible continuation toward higher valuation areas.
The outlook remains constructive as long as current accumulation behavior sustains, with market sentiment leaning toward a recovery-driven advance in the near term.
Gold Price Outlook | Buyers Stay in Full ControlGold remains firmly positioned within its broader bullish trajectory, supported by consistent demand from both institutional and retail investors. The market has shown strong resilience, forming a well-defined higher-low structure, which reflects continued accumulation. Price action indicates that buyers are confidently stepping in after each controlled pullback, maintaining upward momentum.
The current market tone favors continuation toward the 4,180–4,250 range if momentum persists. Short-term retracements into the 4,070–4,090 area may offer new buying opportunities for position traders aligning with the prevailing trend. Macroeconomic factors such as ongoing inflation concerns, geopolitical instability, and cautious monetary policy stance continue to underpin gold’s strength.
Gold → Ready for the Next Bullish WaveGold (XAUUSD) continues to gain momentum as shifting global conditions drive investors toward safer assets. The ongoing uncertainty in financial markets, coupled with renewed concerns over U.S. fiscal policy and interest rate adjustments, has strengthened gold’s long-term appeal.
Recent market behavior reflects consistent institutional demand, with traders positioning ahead of potential monetary easing cycles. As confidence in traditional currencies weakens, gold remains a preferred store of value for both investors and central banks.
Structurally, the market is maintaining a healthy uptrend, showing controlled corrections within a broader bullish framework. The latest price movements suggest that momentum is building for another upward phase, possibly targeting new historical zones if global instability persists.
In summary, gold’s outlook stays constructive — supported by both macroeconomic sentiment and steady technical momentum.
How do you see the XAUUSD trajectory evolving — continuation of growth or a major pause ahead?

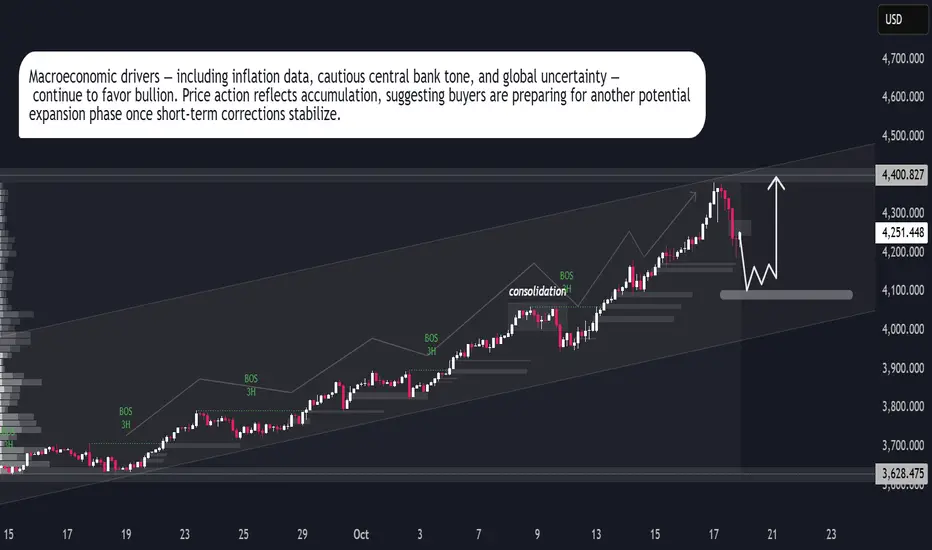
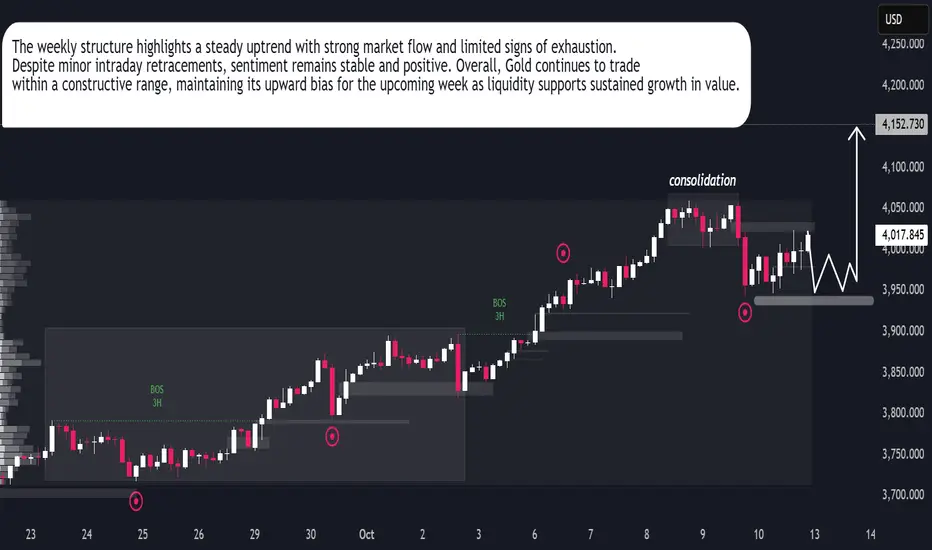
XAUUSD | Bulls Maintain Weekly ControlGold continues to display firm momentum as investor confidence remains stable despite short-term fluctuations. The latest weekly candle structure shows price holding within a steady consolidation range, signaling accumulation rather than weakness. Market behavior suggests large participants are preparing for another expansion phase after absorbing liquidity in the lower zones.
Institutional interest remains evident, with consistent buying pressure observed on dips, indicating sustained optimism for further growth. The current behavior aligns with broader market sentiment favoring safe-haven assets amid global uncertainty. Overall, Gold retains its dominance as capital flows stay supportive of the uptrend, positioning the metal for renewed strength in the upcoming sessions.
Gold Neowave Update | 09/10/2025Namaskaram Everyone
Welcome to intelligent investor, we provide market insights by synchronising and combining all the price action waves from different time frames and gives you single trend.
Previous Video

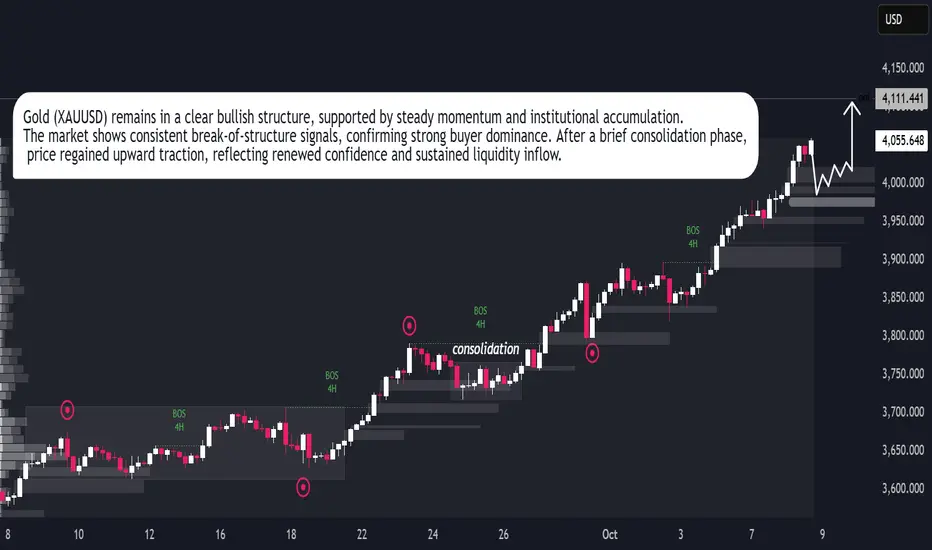
Gold Price Rally Sustains – Market Eyes Next Breakout PointGold (XAUUSD) continues to follow a strong bullish trajectory, confirming consistent market confidence and institutional participation. The chart structure reveals clear liquidity shifts and a steady series of bullish break-of-structure (BOS) points, suggesting that buyers remain in firm control. After a brief consolidation phase, gold resumed upward momentum, supported by sustained volume and steady market sentiment.
The current trend indicates controlled buying pressure rather than speculative spikes, showing the market’s preference for stability as price builds toward higher levels. If momentum maintains its present pace, gold could extend gains in the short term while maintaining its established bullish rhythm across the higher timeframe outlook.
Gold Market Outlook – Bullish Trend Building MomentumGold continues to follow a structured bullish cycle, where each consolidation phase has been followed by a breakout and expansion. Market behavior shows liquidity being collected in sideway ranges, then released to fuel upward momentum.
At the current stage, price is trading around $3,870, showing signs of a potential short-term pullback to gather liquidity from the mid-zone. Once this corrective move stabilizes, the chart suggests a renewed bullish impulse with a projected upside target toward the $3,965 level.
This pattern highlights that the market remains in a controlled bullish phase, where temporary retracements are acting as setups for continuation rather than reversal. The underlying flow still favors higher levels as long as buyers maintain activity after corrections.

Gold Market Analysis – Sell Opportunity Emerging in XAU/USDGold has been climbing with strong momentum, but the current leg is showing signs of transition. After a period of consolidation, the market expanded upward, taking liquidity from previous highs and creating an extended run. This behavior often reflects the final stage of a bullish cycle before rebalancing begins.
What stands out now is the engineered path of price: a push into untested liquidity zones above, followed by a potential shift as large players unwind positions. Once liquidity is collected at the extremes, price tends to rotate back into inefficiencies left behind during the rapid climb.
This suggests gold is not simply trending higher, but moving through a liquidity cycle. The near-term structure favors a sweep of higher levels, then a corrective phase where price retraces to refill imbalances and reset order flow for the next directional move.

Gold Price Analysis: Liquidity Redistribution in PlayThe current correction phase is unfolding as part of the broader cycle, where price is retracing into areas of liquidity to rebalance market flow. This is not necessarily weakness, but a redistribution process that allows the market to set up for its next decisive move.
Following the recent rally, price entered a period of consolidation before breaking higher again, showing that buyers remain active. The ongoing return toward previously untested zones reflects how institutional flow realigns, creating space for renewed expansion.
If bullish intent continues, gold could extend toward higher levels after short pauses, with volatility remaining a key factor. The structure highlights that retracements are being used as preparation for continuation rather than reversal.

Gold Forecast: Liquidity Rotation Shaping Price ActionGold Forecast: Liquidity Rotation Shaping Price Action
Gold’s recent movement reflects shifting dynamics between liquidity capture and market rebalancing. The push above 3,800 was less about sustained trend extension and more about triggering stops and gathering liquidity before rotating lower. This type of move often indicates that large participants are managing positioning rather than chasing new highs.
The current correction phase is part of that process. Price is being driven back into zones where imbalances remain, allowing institutional flow to realign. Instead of showing weakness, this return highlights how markets redistribute liquidity to prepare for the next decisive move.
From a flow perspective, gold remains in an accumulation phase. Consolidation pockets reveal ongoing positioning, while the corrective dip reflects controlled market engineering rather than disorder. If this cycle continues, the next stage could see energy released in the form of a renewed expansion leg once sufficient liquidity has been absorbed.
In essence, gold is navigating a liquidity-driven cycle: sweep → redistribute → prepare → expand. The underlying order flow still favors upward continuation once the current rebalancing phase completes.
