XAUUSD Forecast – Gold Price Action and Market InsightsXAUUSD Forecast – Gold Price Action and Market Insights
Gold is showing signs of stabilization after recent fluctuations, with price consolidating around the mid-range levels. The chart highlights repeated sequences of structural breaks and shifts, indicating that liquidity has been actively swept on both the buy and sell side.
The latest market move shows a controlled decline, followed by an attempt to absorb selling pressure. Current positioning suggests the possibility of a short-term liquidity grab to the downside, which could fuel a stronger recovery leg in the sessions ahead.
The projected outlook favors a scenario where buyers regain momentum, aiming to retest the upper price zones. If this momentum develops, the market may establish a renewed upward leg in alignment with the broader bullish cycle observed across higher timeframes.
From a macro perspective, gold continues to be supported by demand for safe-haven assets amid ongoing global financial uncertainty and shifting monetary policies. This backdrop enhances the probability of gold sustaining its mid-term bullish trajectory despite temporary corrective phases.
Goldforecast

Gold Breaking Limits – Trend Speaks for ItselfGold Breaking Limits – Trend Speaks for Itself
Gold Market Outlook
Gold continues to demonstrate a well-structured bullish cycle, characterized by steady momentum and clean trend development. The market has transitioned from a prolonged consolidation phase into a sustained directional move, where each breakout is validated by controlled retracements. This reflects strong participation and confidence from larger players.
The sequence of market shifts and break-of-structure signals highlight how short-term pullbacks are consistently absorbed, turning into fuel for further expansion. Price action is orderly, with no signs of erratic volatility, showing that buyers remain in control and liquidity is being managed efficiently.
Overall, gold is moving in line with the broader macro sentiment. The rhythm of accumulation, expansion, and continuation suggests that the current cycle has not yet exhausted its potential. While interim pauses are expected, the structural integrity of the trend continues to favor upside development over the medium term.

Strategic Long-Term Perspective on GoldGold Market Analysis – Report View
Gold has delivered a strong bullish cycle after weeks of accumulation. The past phase showed a contracting range where liquidity was built up and multiple structural shifts occurred, signaling preparation for expansion. Once price broke out of that range in late August, momentum accelerated, leading to a clean and sustained rally into September.
The recent move highlights how market flow continues to favor the upside, with each correction acting as a re-accumulation zone rather than a trend reversal. Institutional order flow remains visible, supporting higher valuations as price respects bullish market structure.
Currently, gold is stabilizing after the sharp leg upward. This pause suggests a phase of healthy consolidation, likely absorbing liquidity before attempting the next impulsive wave higher. Overall sentiment remains constructive, with bullish continuation the dominant narrative unless a major structural shift occurs.

Gold Outlook – Short-Term Pullback, Long-Term StrengthGold has shown a strong bullish phase over recent weeks after a long consolidation. The market moved from accumulation into expansion, reflecting renewed participation by larger players. This upward momentum indicates strong capital inflows, supported by macroeconomic uncertainty and shifting investor sentiment.
Technically, price has broken out of a prolonged range and established a clear upward trajectory. Market structure suggests that buyers remain in control, though current price levels are showing signs of potential exhaustion, which could trigger short-term corrective moves before the broader trend resumes.
Fundamentally, global economic pressures continue to boost gold’s role as a safe-haven asset. Concerns over inflation, central bank policy adjustments, and currency volatility are keeping investor demand elevated. With global risk sentiment fluctuating, gold is likely to remain an attractive hedge, sustaining its medium-term bullish outlook despite short-term pullbacks.
Conclusion: Gold is in an expansion cycle, supported by both technical momentum and fundamental demand. Short-term corrections are expected, but the broader trajectory remains upward.

Bullish trend intact, waiting for PMI to spark the next waveCaptain Vincent – Gold Plan XAU/USD
1. Market Waves 🌍
The USD continues to weaken as investors grow more confident that the FED will cut rates in the coming months. With the greenback losing appeal, large flows are leaving cash and moving into safe-haven assets → gold stands out as the number one choice .
👉 This supports gold’s sustainable bullish trend . If USD selling pressure persists, the market could see fresh breakouts into year-end.
2. Technical Outlook ⚙️
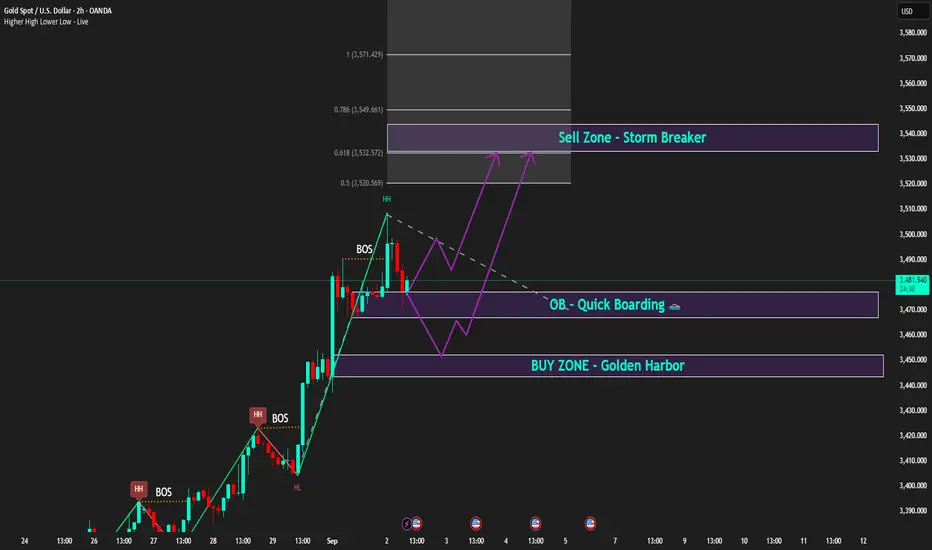
H2 Chart: gold just created a Higher High after BOS , confirming bullish dominance.
Golden Harbor 🏝️ (Buy Zone 3,450 – 3,452): aligned with previous FVG , heavy liquidity zone.
Quick Boarding 🚤 (OB ~3,470): intermediate support, ideal for quick pullback entries.
Storm Breaker 🌊 (Sell Zone 3,538 – 3,540): resistance at Fibo 0.618 – 0.786 , strong chance of profit-taking if tested.
Intraday bias: Wait for pullback to Buy. Short-term Sell only if price hits Storm Breaker.
3. Captain Vincent’s Map – Key Levels 🪙
Golden Harbor 🏝️ (Buy Zone): 3,450 – 3,452
Quick Boarding 🚤 (OB Support): 3,470
Storm Breaker 🌊 (Sell Zone): 3,538 – 3,540
4. Trade Scenarios 📌
🔺 Golden Harbor 🏝️ (BUY – Priority)
Entry: 3,450 – 3,452
SL: 3,444
TP: 3,455 → 3,458 → 3,462 → 3,465 → 34xx
🔻 Storm Breaker 🌊 (SELL Reaction)
Entry: 3,538 – 3,540
SL: 3,548
TP: 3,535 → 3,532 → 3,529 → 35xx
5. Captain’s Note ⚓
“The gold sail is still filled with bullish wind, but Storm Breaker 🌊 above may create counter waves. Stay patient at Golden Harbor 🏝️ for precise entries, and watch the PMI at 21:00 – the catalyst for the next wave.”
GOLD PLAN 21/07 – START OF THE WEEK FACES STRONG RESISTANCE GOLD PLAN 21/07 – START OF THE WEEK FACES STRONG RESISTANCE – WAIT FOR CONFIRMATION!
Market Overview:
Gold rebounded swiftly after a minor correction late last week, mainly fueled by ongoing geopolitical tensions. While there are no major economic events scheduled this week, macro headlines and global conflicts will likely drive volatility and direction for gold prices in the coming sessions.
Technical Outlook:
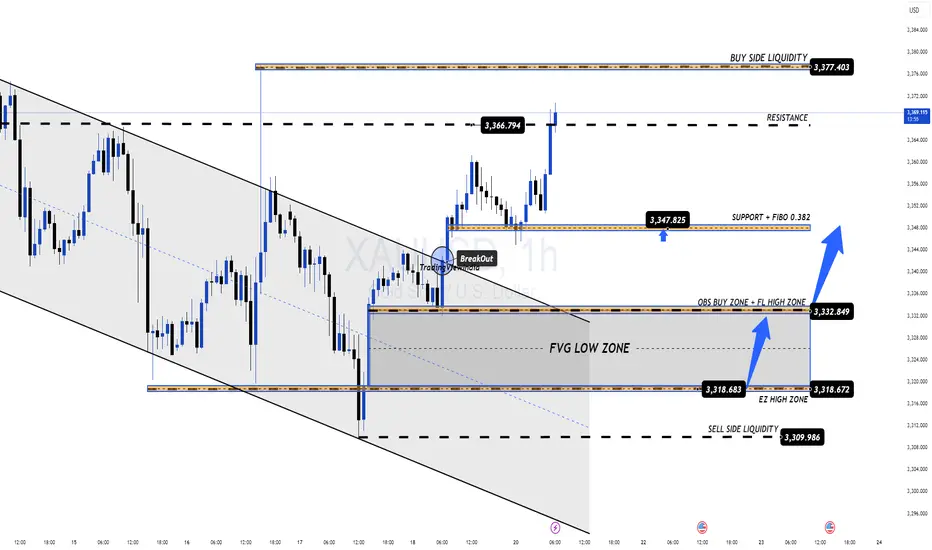
Price is quickly approaching a key resistance zone and may retest the Buy Side Liquidity area around 3377 – 3380.
A short-term reaction from sellers is possible, aiming to fill the Fair Value Gaps (FVG) below.
⚠️ Selling at current levels carries higher risk unless clear reversal signals appear. Patience is key!
Trading Plan for Today:
🔹 BUY ZONE: 3331 – 3329
SL: 3325
TP Targets:
3335 – 3340 – 3344 – 3348 – 3352 – 3358 – 3364 – 3370
🔹 SELL ZONE (risky – confirmation needed): 3377 – 3379
SL: 3383
TP Targets:
3372 – 3368 – 3364 – 3360 – 3350
Key Notes:
The 3347 zone currently acts as short-term support for bulls. If this breaks, gold may slide back to fill lower FVG zones.
Watch closely for volume activity during the London session to confirm intraday bias.
Always respect your SL/TP levels to protect your capital, especially early in the week when volatility can spike unpredictably.
💬 Stay patient, trust the structure, and let price come to your zones. Trading is a game of waiting, not chasing!
Good luck, traders!
18/07 Gold Outlook – Final Friday Liquidity Moves Ahead!🟡 Gold Outlook – Final Friday Liquidity Moves Ahead!
Will Gold maintain its bullish pace or face weekend volatility? Stay ahead of the market!Why Gold is Moving – Key Macro Drivers
Gold bounced back sharply after a dip caused by stronger-than-expected US economic data. Here’s what Indian traders need to keep in mind:
📊 Rate cut hopes remain high as US core inflation remains sticky.
💣 Middle East tensions continue, with Israel launching more airstrikes on Syria.
🌐 Trade war risks increase as EU threatens $84B in tariffs on US goods.
🟡 Gold is acting as a safe haven in times of inflation concerns and global uncertainty.
👉 All of these factors support gold’s upside — especially heading into the weekend when low liquidity can cause price swings.
📉 Technical Picture – Zones in Play
Gold reversed from FLZ H2 (3310) — a key liquidity and demand zone. Sellers took profits, triggering a surge in buy volume. The price has since tested the OBS Sell Zone + Continuation Pattern (CP) around 334x with strong resistance.
Today, we expect price to revisit lower liquidity pools on the M30–H2 timeframe before the next breakout.
🧭 Key Levels for Friday – Watch Closely
✅ Buy Zone: 3318 – 3316
SL: 3312
TP Targets: 3322 – 3326 – 3330 – 3335 – 3340 – 3345 – 3350 – 3360
💼 Scalp Buy Zone: 3326 – 3324
SL: 3320
TP: 3330 – 3335 – 3340 – 3345 – 3350 – 3360
⚠️ Sell Zone: 3363 – 3365
SL: 3370
TP: 3360 – 3355 – 3350 – 3346 – 3342 – 3338 – 3335 – 3330
🔔 Important Notes for Indian Traders
Today is Friday, and even though there’s no major economic news, the risk of liquidity sweeps and volatility is high. Protect your capital with solid risk management and stick to your TP/SL strategy.
📌 Plan your entries from strong technical zones and don’t chase price — let the market come to you.

Buy Opportunity or A Sign of a Bigger Downtrend?Gold Reverses Below 3300 – Buy Opportunity or A Sign of a Bigger Downtrend?
🧭 Market Update: Is the Sell-Off Really That Dangerous?
Gold had a surprising reversal at the end of the US session yesterday, after a sudden sharp drop targeting the 329x liquidity zone, followed by strong buying momentum pushing the price back above this level.
When gold tested the liquidity zone below 3300, large buying volumes appeared and pushed prices above this region. Overall, the market has not yet made a clear decision for either the bulls or the bears. We are still in an accumulation phase, with liquidity sweeps happening around both highs and lows, so it's crucial for traders to stay cautious and focus on finding appropriate scalping points to enter and exit.
Short-Term Outlook: Buy Bias Takes Over Today
For today, the buy bias appears to be stronger than yesterday. Focus on buying early at continuation patterns to catch the market trend. The D1 candle from yesterday formed a wick rejection, showing that the selling pressure was absorbed and the buying momentum has returned in the short term. So, it’s important to be proactive and look for early buy opportunities.
In the M30 timeframe, a solid continuation pattern is forming in the 16-14 zone, which could be an ideal entry point for today. If the price drops further, we’ll watch for a test of the old bottom at 03-00, and we’ll wait for any strong downward momentum to confirm if the bearish trend continues. On the other hand, for those considering sell positions, caution is advised. As mentioned earlier, with yesterday’s D1 wick rejection, the SELL pressure has likely been absorbed, and BUY momentum may overpower in the next few days. Avoid rushing into sell trades prematurely.
Key Support & Resistance Levels:
Important Resistance: 3342 – 3353 – 3362 – 3381
Important Support: 3330 – 3314 – 3303 – 3295
Scalping Opportunities and Buy Zones:
BUY SCALP:
3316 – 3314
Stop Loss: 3310
Take Profit: 3320 → 3325 → 3330 → 3335 → 3340 → 3350
BUY ZONE:
3303 – 3301
Stop Loss: 3297
Take Profit: 3306 → 3310 → 3315 → 3320 → 3330 → 3340 → ????
Sell Opportunities and Caution on Bears:
SELL SCALP:
3362 – 3364
Stop Loss: 3368
Take Profit: 3358 → 3354 → 3350 → 3345 → 3340 → 3330
SELL ZONE:
3380 – 3382
Stop Loss: 3386
Take Profit: 3376 → 3372 → 3368 → 3364 → 3360 → 3350
Key Takeaway:
We are at a crucial juncture where both bulls and bears are battling for control. Will gold bounce from the support and continue its bullish momentum, or will the sellers take charge and drag prices lower? Be patient and wait for clear price action signals before entering trades.
The market is currently in an accumulation phase, so don't rush into trades. Focus on buying when clear confirmations appear at support zones and be aware of sell rejections at key resistance levels.
💬 What’s Your View on Gold Today?
Do you think gold is ready to break 3390 and continue its bullish trend? Or are we looking at a deeper correction to 3270 in the coming days?
👇 Share your analysis and thoughts in the comments below! I’d love to hear your take on where gold is heading next! Let’s discuss and refine our strategies together!

Gold to loose its shine! Let's see how muchAfter a Fantastic Bull run for Gold.
I see it's loosing it shine to some extent.
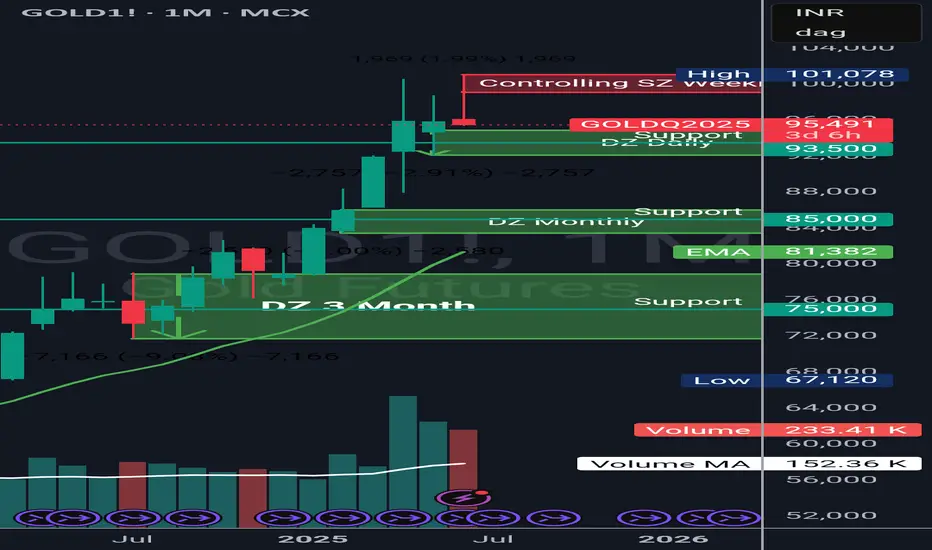
It's time to kiss EMA20 (Monthly) after 2 Year when Gold last touches EMA 20 of Monthly time frame in OCT 2023 @ 62500. About 2 Years back.
Today Gold Future in MCX is 95500 There is a good support @ 93500 but if it breaks this convincingly it should loose its shine till 85000 where it would meet the EMA20 (Monthly).
This should happen in next 1-2 months.
In case it can't hold 85000 then the next level of support it would find @ 75000 to make it fair and lovely again.
GOLD PRICES STEADY AHEAD OF US CPI & TRADE TALKSSymbol - XAUUSD
CMP - 3324
Gold is currently testing the liquidity zone during the Asian trading session, exhibiting signs of a potential false breakout. While the metal is showing signs of recovery, the broader fundamental backdrop remains uncertain.
As of Monday, gold is trading steadily around the 3300 level, supported by a weaker US dollar and cautious sentiment among market participants ahead of upcoming US-China discussions and the release of US Consumer Price Index (CPI) data scheduled for Wednesday. Robust Non-Farm Payroll (NFP) figures for May have strengthened the dollar and diminished expectations for a near term FED rate cut. Nonetheless, ongoing domestic challenges in the US are exerting downward pressure on the currency. Investors are repositioning ahead of the CPI release.
From a technical standpoint, the trend remains bullish. Although the price previously breached structural support, it has rebounded during the Asian session following a false breakdown of both the order block and the 3300 liquidity zone. Price action in the near term will be influenced by the 3300–3335 range.
Resistance levels: 3325, 3343, 3375
Support levels: 3303, 3275
Gold appears to be approaching the 3325–3335 zone for a potential retest. Should the dollar continue to weaken and gold sustain a move above the 3340 level, the bullish momentum may persist. However, caution is warranted-a false breakout within the 3325–3335 area could signal a breakdown of the bullish structure and result in a renewed downward move.

Gold Trading Strategy for 24th Feb 2025📊 GOLD INTRADAY TRADING PLAN 📊
📌 Strategy: This plan is based on the breakout of a significant level after a confirmed 1-hour candle close.
🟢 Buy Setup (Bullish Breakout)
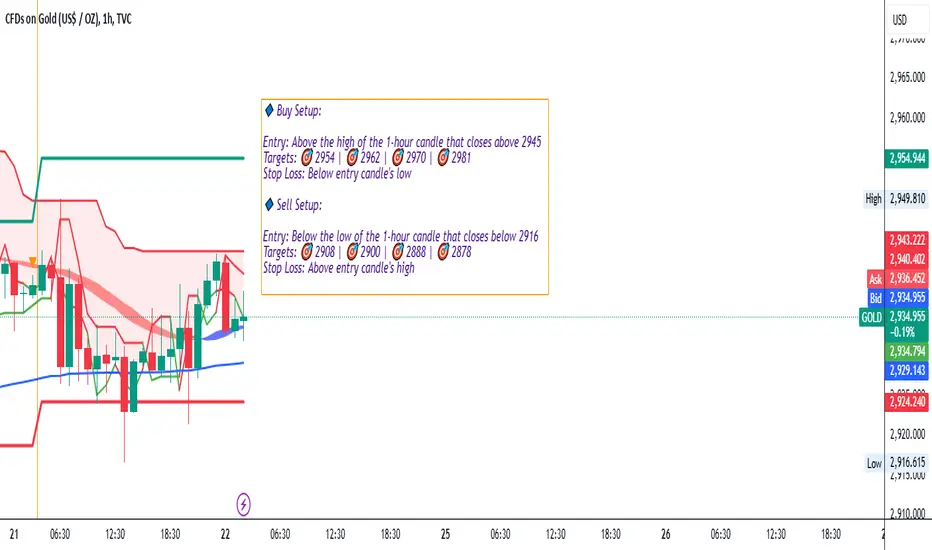
🔹 Entry Condition: Enter a buy position above the high of the 1-hour candle that closes above 2945.
🔹 Targets:
🎯 First Target: 2954
🎯 Second Target: 2962
🎯 Third Target: 2970
🎯 Final Target: 2981
🔹 Stop Loss: Below the low of the entry candle.
🔹 Risk Management: Ensure proper lot sizing based on your risk appetite.
🔴 Sell Setup (Bearish Breakdown)
🔹 Entry Condition: Enter a sell position below the low of the 1-hour candle that closes below 2916.
🔹 Targets:
🎯 First Target: 2908
🎯 Second Target: 2900
🎯 Third Target: 2888
🎯 Final Target: 2878
🔹 Stop Loss: Above the high of the entry candle.
🔹 Risk Management: Follow strict position sizing and risk-reward ratio.
⚠ Important Notes:
📌 Confirmation is key – Wait for a full 1-hour candle close before entering a trade.
📌 Avoid trading during high-impact news events as they may cause sudden volatility.
📌 Use a trailing stop-loss to maximize profits in a strong trend.
🚨 Disclaimer:
This analysis is for educational purposes only and should not be considered as financial advice. Trading in financial markets involves significant risk, and past performance is not indicative of future results. Always trade with proper risk management and consult with a financial expert before making trading decisions. 📉📈
GOLD - TRADING AT CHANNEL RESISTANCE - TIME TO SELL?Symbol - XAUUSD
CMP - 2858
Gold has reached a new all-time high (ATH) of $2861 & trading at rising channel resistance, amidst heightened risks of tariff conflicts and persistent inflation, encountering resistance at the channel trend. However, due to potential political manipulation, the possibility of a market correction exists.
Currently, gold is consolidating above $2840 following its ATH, as it awaits key data such as US employment figures and speeches from Federal Reserve officials. Increased volatility has been observed, driven by conflicting statements regarding former President Trump's tariff policies: tariffs were initially imposed, only to be rescinded a few hours later, highlighting the influence of political decisions. Following a false breakout at the resistance of the ascending channel, gold is now undergoing a correction, partly prompted by news of the temporary suspension of tariff hikes by the United States. Despite these fluctuations, gold remains resilient, supported by the Fed’s cautious stance on rate cuts.
Key Resistance levels: $2860 and $2872
Key Support levels: $2845, $2840, $2818
Should the price fall below the $2840 mark and consolidate beneath this level, a short-term correction towards $2824 - $2815 may occur. However, no significant trend reversal is indicated, and growth may resume from these key support areas.

Gold Trading Strategy for 20th November 2024Gold Trading Signal
Current Price: ₹2632.20
Trading Levels:
Buy Above: ₹2640
Trigger a long position when the price closes above ₹2640 on a 1-hour candle.
Resistance Levels:
₹2665 (Initial Resistance)
₹2693 (Next Resistance)
Sell Below: ₹2620
Trigger a short position when the price closes below ₹2620 on a 1-hour candle.
Support Levels:
₹2598 (Initial Support)
₹2585 (Next Support)
Key Notes:
Monitor price action carefully around the buy and sell levels.
Ensure proper risk management by setting stop-loss orders slightly above or below resistance and support levels, respectively.
Consider additional confirmations such as volume or RSI divergences before entering trades.
Disclaimer:
This analysis is for educational and informational purposes only. It is not financial advice or a recommendation to trade. Trading in the financial markets involves substantial risk and may not be suitable for all investors. Past performance is not indicative of future results. Always consult with a qualified financial advisor before making trading decisions.

Gold weekly outlook Imp area are 2132 to 2324 if break more fallGood Morning Traders,
Gold weekly outlook Imp area are 2132 to 2324 if break more fall
Gold is consolidating in 2350 to 2325 area and
around 100 EMA. IF we see gold is also in falling wedge.
If gold will break 2324 area and sustain we can see deep
correction till 2300 2290 and 2285 and 2275.
If gold sustain above 2350 2354 we can see more
up levels till 2360 2365 and 2370 2375.
Our recommendation is selling from every high.
Geo political can change the game,
else we can see bearishness in gold
Even we have Fed Rates event this week
so check all the things before trading,
Plan accordingly, Happy Trading

Gold next move above 2330 bulls are in actionAs we are able to see gold is moving in bullish channel. till the time gold is moving above
2330 we can see 2355 2364 2374.
Below 2330 again we can see 2310 2300 2290 2285.
Plan accordingly, Happy Trading. 😉😉😉

XAUUSD GOLD today 26-04 2024 forecast. Good morning Traders,
Today's Gold main level is 2315. above 2315 we can expect 2344 and 2355.
below 2315 we can see more down levels 2305 and 2295.
Most chance gold will break its recent resistance area of 2332 2335 and sustain, try to reset upcoming levels 2344 and 2355.
Plan accordingly, Happy Trading 😉😉

Gold XAUUSD forecast today is bullish above 2310Good Morning traders,
Gold is moving in range.
Above 2310 Gold buy zones are 2314 2316 with the targest of
2320 2330 and 2340
Below 2310 Gold sell zones are 2305 2300 and 2990
Trade accordingly, Happy Trading 😉😉

Gold XAUUSD forecast today is bullish above 2310Good Morning traders,
Gold is moving in range.
Above 2310 Gold buy zones are 2314 2316 with the targest of
2320 2330 and 2340
Below 2310 Gold sell zones are 2305 2300 and 2990
Trade accordingly, Happy Trading 😉😉

Gold forecast area to watch 2335 above this bullish.Gold forecast area to watch 2335 above this bullish if reject from this area we can see more low area
Gold area to watch 2335. if gold break this area and sustain above we can see 2345 2356 and above,
If gold decline from this area then we can see 2310 2300 and 2290 area.
so plan accordingly, Happy trading.

Today Gold Main area or bias is 2330.Good Evening Traders,
Today Gold Main area or bias is 2330.
till the time gold is moving below 2330 we can see more low levels till
2295 and 2272
If gold will breakout 2330 level and sustain we can see more up levels 2350 and 2358
Plan accordingly, Happy Trading 😉😉

Gold Next week Forecasting, Ready to FLY....Good Evening Traders,
I am sharing Gold possible moves for the upcoming week.
Gold is moving ATH (All time high),
Levels due to the rising geo-political risk in the Middle East after the alleged reports of Israel's drone airstrike in Iran and still, there is no such possibilites where we can see further cool down the geo-political risk.
Gold levels to understand both possible scenarios.
Gold is bullish in all Time frames. selling gold this time is not a good Idea. we can see only retracements in the way of selling. Gold major and recent support is 2362 - 2352, if any case gold will break this level, only then we can anticipate Sell on retracement of same level till next support 2322.
Or-else we can try to find Buy from every dip.In buy side if any candle close above 2400 then
we can see buy from retracement of 2400 till 2431. 2431 is the hurdle for gold to reach 2468 to 2510 levels
FOLLOW US

Turned down right from the opening of the new weekGold prices edged lower at the start of the week after posting solid gains from haven flows that were seen outperforming higher government bond yields across most of the globe. The price of precious metals decreased not because gold's upward momentum was over, but because the market needed to consolidate with resistance at 1,985 USD/ounce.
The geopolitical situation and macroeconomic factors of the Middle East may have contributed to the increase in gold prices. The decline in the iShares iBoxx High Yield Corporate Bond Fund ETF reflects the worsening outlook for corporate bonds. This credit squeeze also affected Wall Street stock indexes and increased risks to other assets.
The Middle East situation is unlikely to find a peaceful solution soon, which could maintain demand for gold despite higher Treasury yields. The 2-year Treasury note reached 5.25% last Thursday but fell to 5.10% over the weekend. The 10-year note also hit its highest level since 2007, briefly surpassing 5.0% before settling at 4.95%.
The chart shows that the rise in the 10-year Treasury yield and the USD index has not yet affected the price of gold, but it is worth keeping an eye on in case of sudden movements in those markets.
The sell-off of the iShares high-yield ETF could have broader consequences for stocks as companies face higher borrowing costs.
SELL zone 1982$ - 1980$ - stoploss: 1986$
Buy zone1945$ - 1947$ - stoploss: 1940$

Long term gold. 2050 COMINGCurrently gold is trading around 1980 USD and has increased a total of 7 USD today. It can be seen that after the Fed chairman's speech yesterday, gold's reaction was not too strong but still developed with the highest impressive number in the past two weeks since October 6.
The reason gold prices increased cannot help but mention the fact that the gold market continues to benefit as the Israel-Hamas conflict continues to intensify. Besides, the cooling of the USD also partly supported gold's return.
With gold retesting the level of 1,964 USD/ounce, this precious metal will easily surpass levels in the range of 1,985 - 1,995 USD/ounce.
All resistance zones are not enough to slow down the rise of gold.
Let me know your mind!
