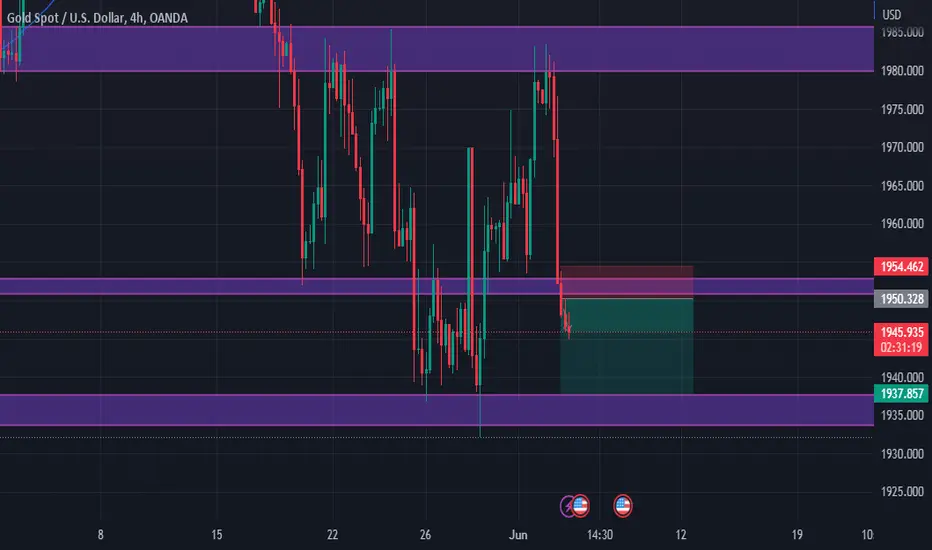
XAUUSD OANDA:XAUUSD
XAUUSD in 4Hr Time Frame has created a falling wedge and it already given a breakout, wait for the retest and take entry buy side. plan your trade accordingly...( Its for monday 03-07-2023)
Goldforecast

GOLD 1:3 TradeGold Powerful 1:3 Trade
= Down Trend
= breaking their Support
= Price below the 200 EMA
= Positibe news For USD Coming soon (Bad for Gold)
= Proper Price action
GOLD Possible Elliott wave countsHere we had shared possible Elliot wave counts of GOLD chart in which weekly, daily, 4 hourly and hourly all these time frames counts are aligned with each others.
Most investors treat trading as a hobby because they have a full-time job doing something else.
However, If you treat trading like a business, it will pay you like a business. If you treat like a hobby, hobbies don't pay, they cost you...!
Disclaimer.
I am not sebi registered analyst.
My studies are for educational purpose only.
Please Consult your financial advisor before trading or investing.
I am not responsible for any kinds of your profits and your losses.

GOLD with current S/R levels predictionMCX:GOLD1! gold is in parallel channel at the top level support area which was previously a resistance zone, this support zone+ parallel channel breakout can send gold on new all time high or retest the new high level once again.

XAUUSD GoldOANDA:XAUUSD
XAUUSD gold is at good resistance and it is in up trend, if it is breaks the level and sustains or retest we can go for buy side.

up side resistens rejecton and sell Confirmetion sell Oder oky up side resistens rejecton and sell confirmetion sell oder oky

XAUUSD Analysis until NOV 2nd, Interest rate announcement! 📉 Gold - Bearish - We look to Sell at 1615.08
▪ The medium-term bias remains bearish.
▪ Following last week's retracement candle, the overall trend is set to continue downside.
▪ A firmer opening is expected to challenge bearish resolve.
▪ Prices are expected to stall near trend line resistance at 1675-1680.50 levels.
▪ We look to sell rallies in the coming weeks or so.
-Heavy volatility is expected after the Interest rate announcement on the 2nd of Nov.
Confidence: ⭐⭐⭐⭐⭐
⛔ Stop 1615.08
🎯 Target 1: 1601.70
🎯 Target 2: 1575.30

Weekly Outlook : Gold Heading for 1550 levels📉 Gold - Bearish - We look to Sell at 1613.90
▪ The medium-term bias remains bearish.
▪ Broken out of the triangle formation to the downside.
▪ A mild correction has been posted from yesterday's low, this is seen as a retest of the breakout level.
▪ Support at the levels of 1615 weekly low can be broken.
▪ We prefer to fade into the rally with a tight stop in anticipation of a move back lower.
Confidence: ⭐⭐⭐⭐⭐
⛔ Stop: 1628.57
🎯 Target 1: 1604.22
🎯 Target 2: 1550
Let me know what you think in the comment section:

XAU/USD- Heading to 1500 levels zones.📉 Gold - Bearish - We look to Sell at 1638.90
▪ The medium-term bias remains bearish.
▪ Broken out of the triangle formation to the downside.
▪ A mild correction has been posted from yesterday's low, this is seen as a retest of the breakout level.
▪ Resistance could prove difficult to break down.
▪ We, therefore, prefer to fade into the rally with a tight stop in anticipation of a move back lower.
Confidence: ⭐⭐⭐⭐⭐
⛔ Stop: 1648.57
🎯 Target 1: 1617.22
🎯 Target 2: 1590

XAUUSD Heading for 1600 levels at 2 years low
📉 Sell Gold - Bearish - We look to Sell at 1646.51
▪ The medium-term bias remains bearish.
▪ There is scope for mild buying at the open but gains should be limited.
▪ Prices are expected to stall near trend line resistance.
▪ We look to sell rallies.
Confidence: ⭐⭐⭐⭐⭐
⛔ Stop: 1655.37
🎯 Target 1: 1627.32
🎯 Target 2: 1610
Happy Trading!

Double Top breakout or False breakout #xauusd #gold #gc #xauDouble top breakout in #xauusd. I think will get confirmed after this weeks #FOMC whether is a false one or not.
If confirmed, minimum target = 1450/1400$
Technically, dollar index #dxy looking bullish in longer time frame so quite possible of the #gold targets given above. Only time will tell.
#fingerscrossed.
Happy Trading.

GOLD - XAUUSD for 19th SEPTEMBER 2022Gold analysis for the week starting from 19th September 2022.
Use my levels and zones in either on Hourly or 15 Minutes or 5 Minutes for best Risk Reward trades.
Never trade with out a stop loss.

GOLD trend now sell then buy as per Elliott wave counts Gold is near to complete correction very soon but only after making new lows as per Elliott wave counts which are suggesting to go short now, on completion of wave 4 it can be an opportunity to buy at lower prices to ride possible start of wave 5 can make fresh impulsive moves of some lower degrees. Right now it is in sell mode only, and can slide south towards $ 1650 and below.
possible wave counts on weekly time frame
macd in weekly is negative
possible wave counts on daily time frame
macd in daily is negative
possible wave counts on 4 hourly time frame
MACD in 4 hourly is positive but till below zero line
possible wave counts on hourly time frame
MACD in hourly down tick and can cross negative soon
Most investors treat trading as a hobby because they have a full-time job doing something else.
However, If you treat trading like a business, it will pay you like a business.
If you treat like a hobby, hobbies don't pay, they cost you...!
Disclaimer.
I am not sebi registered analyst.
My studies are for educational purpose only.
Please Consult your financial advisor before trading or investing.
I am not responsible for any kinds of your profits and your losses.

XAUUSD SELL KISS 1680 AGAIN XAUUUSD SELL OPPORTUNITY
SELL @ 1730-1745
Target Price 1680
Stoploss Price 1770
Reason For GOLD XAUUSD SELL
1. Obay DAY candle support and bring rejection and tends to sell
2. Clearly formed BEARISH ENGULFING and make possible t fall again
3. Fundamentally the intrest rate may hike for short while

What 1 hr chart says ?Fundamental Descriptions: A strengthening dollar and rising U.S. Treasury yields impacted demand for the U.S. currency-priced yellow metal, which is set for a second consecutive monthly loss for the first time since March 2021. Gold prices will be influenced by the direction of U.S. Treasury yields and the U.S. Dollar. Higher yields lower the appeal of zero-yielding gold, while a stronger U.S. Dollar makes the greenback more expensive for the holders of foreign currencies. Although last week’s economic data for April signaled the economy is still strong, traders are still not sure if this trend will continue after the 50 basis point rate hike in May, and expectations of similar moves in June and July. This suggests heightened volatility could be the norm over the near-term.
Technical View: Gold Price tested the bearish Moving Average , now at $1,849, with bears eyeing a decisive break below the latter to extend the ongoing downbeat momentum. The 14-day Relative Strength Index (RSI) is inching below the midline, allowing room for more declines.
Alternate View: Recapturing the daily highs of $1,857 is critical to take on the upside towards the previous day’s high of $1,864.

What 1 hr chart says ?Fundamental Description: Gold was up on Monday morning in Asia. A weaker dollar gave the yellow metal a boost, but a move towards riskier assets in Asia capped gains. Gold Price ended Friday with mild gains above $1,850 while having booked the second straight weekly gains, as the US dollar correction extended alongside the US Treasury yields’ amid subsiding aggressive Fed tightening expectations.
Technical View: Having found strong buyers once again at the bearish 200-Simple Moving Average, now at $1,849, gold price is looking for a retest of the previous week’s high of $1,870.
Alternate View: Failure to resist the latter will reinforce the selling interest, opening floors for a fresh downswing towards the May 18 low of $1,807.

What 1 hr chart says ?Fundamental Descriptions: Gold was up on Friday morning in Asia and was set for a second weekly gain after the dollar retreated from 20-year highs. Gold has benefited from a strong bearish reversal in the dollar. On May 13 the dollar index hit an apex trading to a high just above 105. In the last nine trading days, the dollar has declined to its current value of 101.775, or a 3.23% decline in value when compared to the basket of currencies that are compared against the dollar.
Technical View: The next critical target is at $1,861, which bulls will have scale on a convincing basis to validate an upside break .
Alternate View: If bears yield a sustained break below the 100-SMA, it will automatically invade the support as well, confirming a downside break.

What 1 hr chart says ?Fundamental Description: Gold was up on Thursday morning in Asia, while U.S. Treasury yields gained. Gold’s response has been quite disappointing, with the FOMC minutes also boosting risk sentiment. Gold cut some dollar strength-driven losses after Wednesday’s Fed minutes suggested the central bank would raise interest rates by 50 basis points in June and July 2022.
Technical view: According to the daily chart, Gold is poised to extend its decline. Gold has retreated below a mildly bearish 20 SMA while it approaches a directionless 200 SMA, offering dynamic support around 1,838.00. Technical indicators, in the meantime, retreat from their midlines, gaining bearish traction within negative levels.
Alternate View: Strong resistance is placed at $1,856, which is the horizontal 21-SMA, above which the hurdle at $1,863 will get tested.

What 1 hr chart says ?Fundamental Descriptions: Gold was down on Wednesday morning , with inflation's uncertain path giving the yellow metal a uncertainity. The buying momentum around Gold Price extended on Tuesday, as bulls cinched fresh two-week highs at $1870. The US dollar tumbled alongside the yields, extending its downward correction despite a cautious market mood, led by a tech sell-off on the global markets. Weak US Manufacturing PMI for May also added to the dollar’s misery, benefiting XAUUSD.
Technical View: In doing so, the bright metal gained for the fifth straight trading day, continuing its recovery from four-month troughs of $1787. After the relentless surge, gold bulls could see a minor pullback from two-week highs, with the immediate support of the 21-DMA likely to be tested.
Alternate View: A break below the last could expose the next downside target of $1,850, below which the mildly bullish 200-DMA at $1,839 will challenge the bullish traders.

What 1 hr chart says ?Fundamental Descriptions: Gold was up on Tuesday morning in Asia. The dollar was up, stabilizing after its fall during the previous session that helped boost the yellow metal to its highest point in two weeks. The bright metal took advantage of the dollar sell-off and built on the previous week’s recovery rally from four-month lows of $1787. However, the risk-on flows-driven rebound in the Wall Street indices, as well as, the US Treasury yields recalled gold sellers, which dragged the rates from multi-day highs.
Technical View: The near-term technical outlook for the metal remains more or less the same. Gold bulls are challenging the 21-Daily Moving Average (DMA) hurdle at $1,857, having failed to hold ground above the latter. Daily closing above the latter is needed to confirm a bullish reversal, exposing the additional upside towards the mildly bullish 100-DMA at $1,885. Ahead of that the $1,870 round figure could challenge the bearish commitments. The 14-day Relative Strength Index (RSI) is testing the midline, currently standing at 46.25, justifying the bullish bias in the price.
Alternate view: The immediate support is seen at the $1,850 psychological level. Sellers will then look out for the horizontal flattish 200-DMA at $1,839.

What 1 hr chart says ?Fundamental Descriptions: Gold was up on Tuesday morning in Asia, even as the dollar slowly resumed an upward trend. A sustained move under 1830 will signal the return of sellers. If this creates enough downside momentum then look for a retest of the intraday low at 1785, followed by 1783.80 mark.
Technical View: Attempted recovery move stalled just ahead of the 1830 level. This is closely followed by the very important 200-day SMA, around the 1836 region, which should act as a pivotal point for short-term traders. Sustained strength beyond might trigger a fresh bout of a short-covering move and lift spot prices back towards the 1859-1860 supply zone.
Alternate Scenario: The 1811-1808 region now seems to protect the immediate downside ahead of the 1800 round-figure mark and the overnight swing low, around the 1786 area.

What 1 hr chart says ?Fundamental Descriptions: Gold was down on Thursday morning. Investors are digesting the U.S. consumer price index (CPI), which suggested inflation remains high but has peaked in April, easing some concerns about more aggressive interest rate hikes from the Federal Reserve. Looking ahead, Gold Price will continue to remain at the mercy of the US dollar price action and broader risk tone, as the Fed expectations and growth concerns keep leading the way.
Technical view: Gold Price tested offers below the critical 200-Daily Moving Average (DMA) at $1,836 on Wednesday, although bulls defended the latter allowing an impressive recovery. The renewed upside in XAU/USD seems to be fading this Thursday, as the price is looking to surrender the previous week’s low and the psychological level at $1,850.
Alternate Scenario: Acceptance above Tuesday’s high of $1,865 is needed for Gold bulls to cement a meaningful recovery towards $1,884. Further, the $1,900 mark will challenge the bearish commitments.

Gold Reversal Possibilities | Gold Long Position IdeaGold Reversal Possibilities | Gold Long Position Idea
in the marked are one can buy gold..
for Daytraders
