GOLD "BOTTOMED OUT" - JACKPOT TRADEGold took support from Daily 200 Day Moving Average
BUY GOLD ABOVE 48700, Day Closing Above This Level Will Make View Solid, Strict SL - 47500 (DCB), Target - 50300/51000
Goldforecast

GOLD "BIG GAINS"I dont know what to say, please see my all posts of gold, Gold sell call given at 52320 with sl of 52550 which was ascending channels high when i posted the chart previously, it made high of 52520 and touched the lower level of channel, infact it tried to make low around the level where the channel actually started, which was the final target of ascending channels breakdown. BOOM..

Gold Touching Ascending Channel TopGold is about to touch ascending channels high, This is the place to lookout for sell for a fall or to buy again above breaking of ascending channel. Stay Alert. Will Update. All The Targets To The Previous Call In Gold Has Achieved.

Gold Spot vs MCX Gold - Weekly Reports & TipsHere I have compared Gold Spot (CFD) with Indian MCX Gold to identify this week's trend.
In the chart, there are two different support levels. Wherein support level 1860 is for gold spot, and 49260 for the MCX gold.
I have used moving average and volume on Indian gold. At present, 50 MA is turning downside. If it breaks the parallel channel (PC), gold will fall for 50000 - 49860 - 49500 levels.
According to this chart, gold is trying to climb upward after hitting the PC. And if it remains into the PC, we may see 51000 - 51500+ levels before the weekend.


Gold Respect to its Support Level Chances to go more High Gold Respect to its Support Level Chances to go more High Ever.

Accumulation Zone - GOLD BULLISH - REJECTION LINE FORMEDTo update from the last week's rejection line, it broke upside and returned back to the accumulation zone.
This week could very well see a uptrend with global markets taking a hit on thursday and friday.

XAUUSD . Weekly Technical Analysis Update for GOLDMidterm forecast:
While the price is below the resistance 2075.05, beginning of downtrend is expected.
We make sure when the support at 1818.00 breaks.
If the resistance at 2075.05 is broken, the short-term forecast -beginning of downtrend- will be invalid.
Technical analysis:
While the RSI support #1 at 45 is not broken, the probability of price decrease would be too low.
A peak is formed in daily chart at 1991.10 on 09/01/2020, so more losses to support(s) 1916.20, 1862.45 and minimum to Major Support (1818.00) is expected.
Price is below WEMA21, if price rises more, this line can act as dynamic resistance against more gains.
Relative strength index (RSI) is 49.
❤️ If you find this helpful and want more FREE forecasts in TradingView
. . . . . Please show your support back,
. . . . . . . . Hit the 👍 LIKE button,
. . . . . . . . . . Drop some feedback below in the comment!
❤️ Your Support is very much 🙏 appreciated! ❤️
💎 Want us to help you become a better Forex trader ?
Now, It's your turn !
Be sure to leave a comment let us know how do you see this opportunity and forecast.
Trade well, ❤️
ForecastCity English Support Team ❤️

GOLD MCX ANALYSISGold MCX has strong Channel Line Support As marked on the above chart and we can see buying resuming in the GOLD MCX, With the Stoploss of 50400 one should Go Long for the Targets of 52000 and 54000 on the upside. Once GOLD MCX Closes above 52500 it May Again Resume its bullish momentum.

Is a correction in Gold imminent?Looks like we are in the 5th wave according to the Elliot wave theory and moreover there is a negative RSI divergence as well. Indicating weakness in the momentum!

XAUUSD TRADE SETUP The 4-hour right side is up against 8/16/2018 low (1159). 1 hour is turning up against 1669 low. Near-term, while dips remain above 1669 low expect Gold to extend higher.

GOLD SHORT TRADE SETUPThe 4 hour right side is up against 8/16/2018 low (1159). 1 hour is turning down against 1739 high. Near-term, while bounces fail below 1739 high expect Gold to extend lower to correct the cycle from 8/16/2018 low in 3, 7 or 11 swings before upside resume.
SHORT TERM SELL

GOLD 4H. Looking bullish 1825-1850 easily possible.
Reasons:
1. Rsi at oversold condition.
2. There's a abcd triangle pattern.
3. Gold is always precious.

GOLD Trading IdeaOne could argue is that the period could be of distribution, but I think that gold is Bullish in the long term. As I have shared in previous chart, so this looks like another accumulation to me.

GOLD Triangle formationGOLD
Gold has crossed the major psychological level which is 1600.00
And currently trading at 1620.00 level
It has broke the triangle formation and reached the top side level of 1620.00
We can expect short term fall back towards 1606.00 level
From this level suitable long position may open at 1606.00
Take profit will be 1628.00
Stop lose may placed below 1597.00
Leave your valuable comments below

$Gold forming a cup movement.“The potential industrial fallout from coronavirus is already leading a number of governments to cut interest rates or add to easing activity, while the U.S. 10-year bond has been dipping in and out of negative territory. This is all positive for gold in a risk-averse environment, although by definition we cannot know for how long it will be before this outbreak is controlled,” O’Connell wrote on Wednesday.

XAUUSD Short Trade SetupGold is favored to remain in the cycle up from 8/16/2018 lows where the daily right side is up. A pullback to correct the cycle from the 8/16/2018 wave ((2)) lows ended wave ((4)) at 1447 on 11/12/19 where the 4 hour is turning up. The metal is favored ended ended a wave B at 1593 where the hourly is turning down to correct the cycle from the 1611 highs. While below 1593 it can see another swing lower in wave (2) to correct the cycle from the 1447 lows. While above the 11/12/19 lows the metal can continue higher in wave I toward the 1700-1750 area before it corrects the cycle from the 12/12/17 lows.

GOLD TRADE SETUP Gold is favored to remain in the cycle up from 8/16/2018 lows where the daily right side is up. A pullback to correct the cycle from the 8/16/2018 wave ((2)) lows ended wave ((4)) at 1447 on 11/12/19 where the 4 hour is turning up. The metal is favored ended correcting the cycle lower from the 1/7/20 highs at 1611 with the bounce to the 1588 highs where the hourly is turning down. While below there it can see another swing lower in wave (2) to correct the cycle from the 1447 lows. While above the 11/12/19 lows the metal can continue higher in wave I toward the 1700-1750 area before it corrects the cycle from the 12/12/17 lows.

GOLD SHORT TRADE SETUPGold is favored ended the cycle from 8/16/2018 lows where the daily right side is up in wave ((3)) at the 9/4/2019 highs at 1557 and a pullback to correct the cycle from the 8/16/2018 wave ((2)) lows ended wave ((4)) at 1446 on 11/12/19 where the 4 hour is turning up. While above there the metal can continue higher in wave I toward the 1700-1750 area before it corrects the cycle from the 12/12/17 lows.

Next $1600 Target could beWhen you see the 5 year moving average , this month will be a positive one .


Gold | Triangle pattern Triangle pattern observed in Gold. Pattern looks to be valid and the target comes at 1477.
1438 and 1382 are the trend defining levels and so conservatively, longs can be initiate beyond 1438.
(Disclaimer: Our charts and contents are just for the purpose of analysis, learning and general discussion. Do not consider these as trading tips or investment ideas. Trading in Stocks, Futures and Options carry risk and is not suitable for every investor. Hence it is important to do your own analysis before making any investment or trading decisions based on you personal circumstances and it is always better to take advice from professionals)

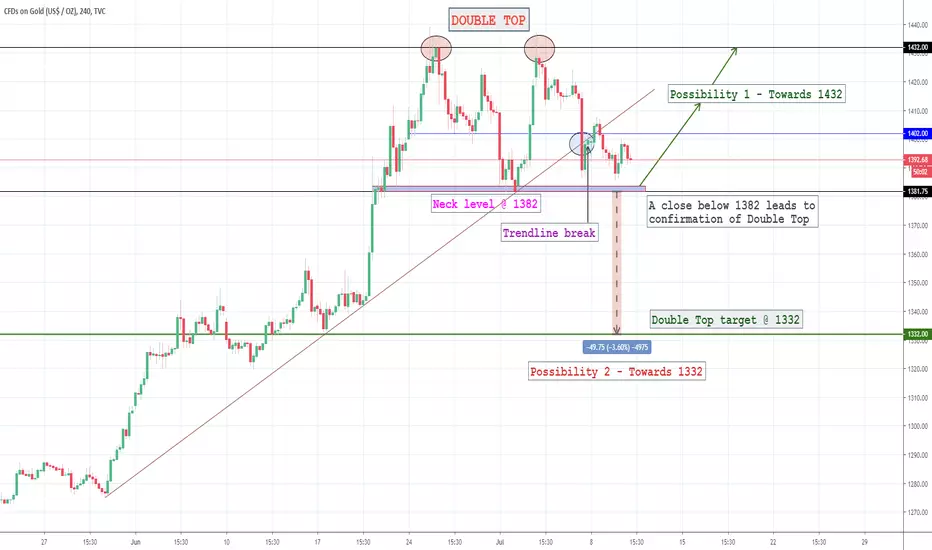
GOLD | Build Trade plan around 1382 - Short termDouble Top pattern spotted in Gold. Pattern will be confirmed IF PRICE CLOSES BELOW 1381.75. So shorts need to wait. Price would fall to 1332 as indicated by the pattern. 1382 acting as a support cannot be ruled out. Hence trades can be planned as below,
1. Long when price hit 1382 with stop below 1380 (or)
2. Short if price closes below 1381.75 with stop above 1385.
(Disclaimer: Our charts and contents are just for the purpose of analysis, learning and general discussion. Do not consider these as trading tips or investment ideas. Trading in Stocks, Futures and Options carry risk and is not suitable for every investor. Hence it is important to do your own analysis before making any investment or trading decisions based on you personal circumstances and it is always better to take advice from professionals)