Brian – Gold game plan for the US sessionBrian – Gold game plan for the US session
Gold’s rally yesterday shook a lot of traders out of position – the move was slow, steady and unforgiving, making it hard both to get in and to get out. For now, the short-term trend is clearer on H1, while H4 is still in transition.
Fundamental view – the Fed is confusing everyone
Fed expectations for December have been on a roller-coaster:
The market went from pricing a 25 bp cut in December at over 90%,
Then collapsed those odds to below 30%,
And has now swung sharply back again – all within about a month.
That kind of violent repricing in rate expectations usually creates two things for gold:
underlying support as soon as the market believes in easier policy again, and
choppy two-way volatility around each new data print or Fed comment.
So the macro backdrop still leans supportive for gold, but you do not want to ignore intraday whipsaws.
Technical view – H1 bullish, H4 testing the top of structure
On the H4 chart:Price is trading above the rising medium-term trendline from late October, keeping the broader structure constructive as long as 4,000 holds.
We are now pushing up towards the descending trendline and a H4 supply/FVG band between roughly 4,160 and 4,200.
Higher up sits a larger FVG / resistance block around 4,280–4,330 – if price ever accepts above the current downtrend line, that zone becomes a realistic upside magnet.
On H1:Structure is clearly bullish with higher highs and higher lows after yesterday’s impulsive move.
The current leg is extended, so I prefer to buy dips into support or a clean retest, rather than chase at the top of the candle.
Core bias: still prefer buys with the trend. Shorts are tactical, only at clear reaction zones.
Key levels
Resistance / sell zones
4,167–4,169: short-term reaction zone at the descending trendline and FVG
4,200–4,220: upper part of the same supply area
4,280–4,330: major H4 FVG / supply above
Support / buy zones
4,110–4,113: intraday support and potential retest area
4,080–4,070: minor support from recent consolidation
4,040–4,020: deeper pullback zone
4,000: key structural support; a break here would damage the bullish case
3,884: level that would confirm a medium-term bearish shift if price breaks and holds below
Trade scenarios (reference only, not financial advice)
Scenario 1 – Primary long: buy the dip into 4,110
Idea: stay with the bullish H1 structure, use the first decent pullback to get a better entry.
Entry: 4,110–4,113
Stop: 4,105
Targets: 4,125 → 4,140 → 4,180 → 4,200
I want to see price pull back into this zone after a push higher, ideally with a rejection wick or bullish candle confirming buyers are still in control.
Scenario 2 – Tactical short: fade the trendline at 4,167–4,169
Idea: counter-trend scalp from a clean confluence of resistance and FVG.
Entry: 4,167–4,169
Stop: 4,175
Targets: 4,155 → 4,140 → 4,120 → 4,105
This is not a swing short – it is a tactical trade against the intraday trend. Size should be smaller, and I would look to lock in profit or move to breakeven quickly if price reacts in our favour.
Scenario 3 – Breakout long if the trendline gives way
If gold pushes through the descending trendline and holds above the 4,170–4,180 zone:
I will shift back to a breakout-continuation mindset, looking to buy pullbacks above the broken trendline.
The next upside magnets then become 4,220 first and eventually the 4,280–4,330 FVG.
As long as 4,000 holds, I respect the upside and prefer to position with the trend, not against it. If we ever see a daily close below 4,000 and then 3,884, the whole story flips and I’ll start treating rallies as selling opportunities.
Trade the structure in front of you, not the headline noise. Manage risk around the shifting Fed expectations, and let the levels do the heavy lifting.
If this breakdown helps with your game plan, follow Brian for more gold updates during the US session and drop your own view in the comments so we can compare scenarios.
Goldlong

Gold H1 – Will Economic Slowdown Trigger a Liquidity Sweep?🟡 XAUUSD – Intraday Smart Money Plan | by Ryan_TitanTrader (24/11)
📈 Market Context
Gold continues to move inside a tight compression range while markets react to new economic concerns raised by U.S. analysts.
According to today’s report, economists are increasingly worried about an unusual slowdown pattern in consumer behavior — spending remains high, but confidence and savings are weakening.
This mixed macro picture creates uncertainty:
🔹 Key takeaways from today’s news:
• U.S. consumers are still spending but confidence is deteriorating, a red flag for future growth.
• Economists warn this divergence could lead to slower economic momentum over the next quarters.
• Weakening sentiment → higher recession fears → typically supportive for gold after liquidity sweeps.
• However, short-term volatility remains high as markets reassess the sustainability of U.S. demand.
With uncertainty rising, institutions are likely engineering both-side liquidity grabs before committing to a directional move.
Gold is currently rotating between 4015–4100, respecting a clean SMC range structure.
🔎 Technical Analysis (1H / SMC Structure)
• Market Structure
Price is forming a descending compression pattern with repeated CHoCH signals, indicating engineered liquidity on both sides.
• Premium Sell Zone (1H Supply)
4100 – 4102
→ Overhead resting buy-side liquidity
→ Aligns with unmitigated internal supply + trendline liquidity
• Discount Buy Zone (1H Demand)
4015 – 4013
→ Inside the prior sweep zone
→ Confluence with ascending structure + BOS origin
• Liquidity Map
• Buy-side liquidity: above 4102 – 4110
• Sell-side liquidity: below 4013 – 4008
A sweep of either pocket is likely before real displacement.
🔴 Sell Setup (Premium Reaction Zone)
Entry: 4100 – 4102
Stop-Loss: 4110
Take-Profit Targets:
→ 4065 (imbalance fill)
→ 4040 (range midpoint)
→ 4018–4015 (discount retest)
📌 Execution Rule: Wait for liquidity sweep into the zone + bearish CHoCH on M5–M15.
🟢 Buy Setup (Discount Reaction Zone)
Entry: 4015 – 4013
Stop-Loss: 4008
Take-Profit Targets:
→ 4055 (short-term reaction)
→ 4080 (premium edge)
→ 4100 (sweep target)
📌 Valid only if price takes sell-side liquidity first and shows bullish displacement from discount.
⚠️ Risk Management Notes
• Market may react unpredictably to weakening U.S. consumer sentiment — reduce risk during spikes.
• Avoid trading inside the 4040–4070 chop zone unless a clean break or CHoCH forms.
• Treat both setups as liquidity–based plays, not trend continuation trades.
• Expect engineered manipulation during Asian session before London expansion.
📝 Summary
Gold remains trapped in a controlled SMC range as economic signals turn mixed.
With economists raising concerns about consumer–confidence divergence, gold may experience pre-breakout liquidity sweeps today.
Key Zones:
🔴 Sell Zone: 4100–4102
🟢 Buy Zone: 4015–4013
Expect the classic SMC sequence:
Accumulation → Sweep → Displacement → Retest → Target.
📍 Follow @Ryan_TitanTrader for more Smart Money updates.

HOW FAR WILL GOLD RISE?
1. MARKET CONTEXT
Yesterday, during the Asian and European sessions, gold prices mainly moved sideways – accumulating within a narrow range.
In the U.S. session, gold prices broke strongly through the 413X region and formed:
Inverse Head and Shoulders pattern (iH&S)
The upward structure returns → buyers dominate
This indicates that the upward momentum has returned, and the market leans towards continuing to rise if it does not break the important support area.
Fundamental factors supporting buyers
The market is expecting the Fed to cut interest rates in December.
Tonight there is PPI news — an important indicator directly affecting inflation expectations and Fed expectations.
→ This could be a catalyst for strong volatility in the U.S. session.
2. MAIN TRADING DIRECTION FOR THE DAY
➡️ Prioritize BUY (look to buy) according to the main trend.
➡️ SELL is only reactive – for retracement, not the main trend.
3. POTENTIAL BUY ZONES
Beautiful support areas to look for buying opportunities today:
📍 BUY zone 1 – Nearest
413X (early day resistance and yesterday's breakout area)
→ Beautiful entry area for scalping or buy follow trend.
📍 BUY zone 2
4100 – 4103
→ Psychological support & structural confluence area.
📍 BUY zone 3
4088 – 4090
📍 BUY zone 4
4060 – 4065
→ Strong support area, look to catch the bottom in case of deep price correction.
4. REACTIVE SELL ZONES (ONLY SELL FOR RETRACEMENT)
Only sell when price hits the area — clear rejection signals appear:
📍 SELL zone 1 (nearest)
4180 – 4186
📍 SELL zone 2
4190 – 4195
📍 SELL zone 3
4202 – 4205
Safe SELL conditions:
Only sell counter-trend, prioritize scalping.
If these areas are strongly broken + H1/H4 candle closes, consider buyers winning, then do not sell anymore.
5. CAPITAL MANAGEMENT – RISK MANAGEMENT
SL = 10 points
TP = 10 points
RR ratio = 1:1.2
Do not hold positions through PPI news if not really sure about the pattern.
6. NOTES ON METHOD
Buy orders will dominate the day.
Sell only when there is a strong reaction at resistance.
Scalping: open orders on smaller timeframes (M1–M5–M15) to optimize Entry.
Always wait for price action confirmation (pinbar, engulfing, retest…) before entering orders.
7. SUMMARY
Today's tendency is mainly BUY, based on:
The return of the upward trend
Inverse Head and Shoulders pattern
Expectations of a dovish Fed
PPI news triggering volatility
Wishing everyone an effective trading day — total victory! 🔥💹

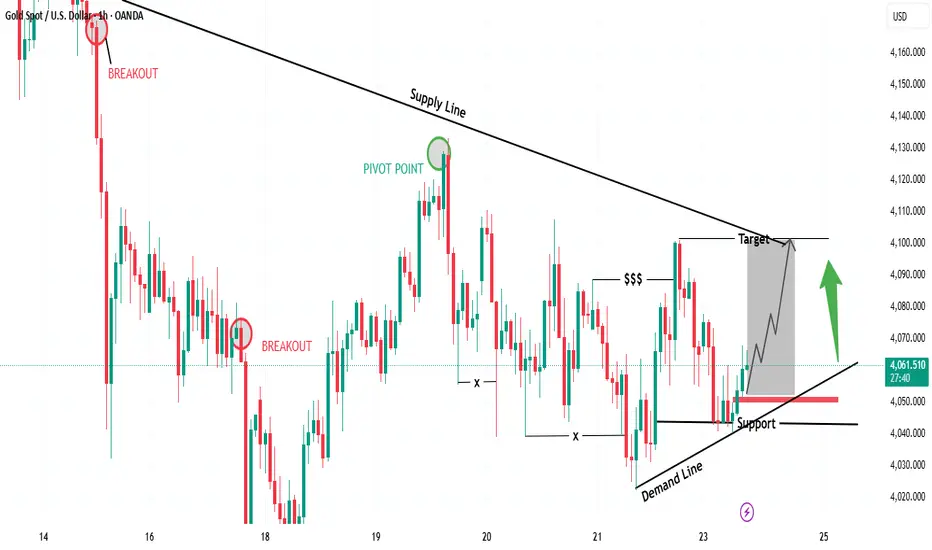
“Gold Rebounding from Demand – Targeting Supply Line Retest🔍 Key Observations
📉 Supply Line (Downtrend Resistance)
Each rally is being capped by the descending supply line
📈 Demand Line (Ascending Support)
Buyers defending higher lows
Strong bullish reaction off support
💰 Liquidity Grab ($$$)
Liquidity was taken below swing lows — bullish signal
Smart money likely securing positions before pushing up
🟢 Bullish Confirmation
If price holds above demand line + support zone
Expect bullish continuation toward supply line retest
🎯 Suitable Target Levels
Target Level (Approx) Status
🥇 First Target 4,095 – 4,105 At supply line retest
🥈 Extended Target 4,120 – 4,130 Breakout continuation
📌 Trade Idea (Bullish Scenario)
Entry Zone: 4,055 – 4,065 🟩
Stop Loss: Below 4,025 ❌
Take Profit 1: 4,100 🎯
Take Profit 2: 4,125 🚀
RR Ratio: 1:2.5 – 1:3 📈
🧭 Market Sentiment
📍 Bias → Short-term Bullish
🛑 But… sellers may reappear at supply line
⚠️ Watch for fakeouts near the target
XAUUSD – Reading the Market’s Secret IntentionsH1 Outlook – 24 November 2025
🌐 MARKET CONTEXT
Gold enters the new week with a controlled, slow-paced volatility environment, as the market continues to balance between inflation expectations, shifting USD flows, and cautious positioning ahead of major U.S. data.
Recently, price has shown repeated rejection from premium zones, forming a mild bearish intraday bias across the H1 structure. The market is still operating inside a liquidity-rich environment where institutions are engineering both upside and downside sweeps before choosing a clear direction.
Recent Drivers
USD holds moderate strength after last week’s hawkish Fed commentary
Market remains in “wait-and-watch” mode ahead of mid-week data
No strong risk-off sentiment → gold lacks solid fundamental support
Session Expectations
London: Early liquidity sweeps above premium levels expected
New York: Higher probability of real trend expansion
Bias: Mild bearish unless deep discount zones trigger CHoCH on H1
Price is currently mid-range → only extreme liquidity areas provide safe, high-probability setups.
📉 TECHNICAL ANALYSIS (SMC + LIQUIDITY)
Market Structure
H1 structure forming: Lower Highs → Lower Lows
Equilibrium zone: 4070–4090
Strong inducement layers above 4146 and 4071
Liquidity Map
Buy-side Liquidity (BSL): Above 4146, 4071
Sell-side Liquidity (SSL): Below 4030 and 3994
Market forming engineered wicks at both ends → ideal for SMC traders
Imbalance Zones
Bearish FVG: 4146–4148 → prime area for premium sells
Minor Imbalance: 4068–4071 → intraday scalp reversal potential
Discount Imbalances: 4032 and 3996 → clean reaction zones for buys
🔑 KEY PRICE ZONES
(Clear explanations linked directly to your entries)
4148–4146 ▶️ Premium Sell Zone – High Manipulation Area
Unmitigated supply zone + major BSL buildup.
Smart money usually induces breakout buyers here before reversing sharply.
4068–4071 ▶️ Secondary Premium Pool – Scalp Rejection
A mini-liquidity pocket above equilibrium.
Perfect for quick stop-hunt sweeps during London session.
4032–4030 ▶️ Discount Reaction Zone – Strong Scalping Demand
A small OB + SSL cluster.
Expect fast, technical bounces with low drawdown.
3996–3994 ▶️ Deep Discount Zone – High-Value Reversal
Highly reactive zone where institutions accumulate long positions.
A strong candidate for structural shifts if tapped.
⚙️ TRADE SETUPS (SMC-Driven Execution)
✔️ SELL SETUP 1 – Premium Rejection
Entry: 4148–4146
Stoploss: 4154
TP1: 4135
TP2: 4120
TP3: 4090
Logic: Sweep of BSL + FVG fill → high confidence bearish rejection.
✔️ SELL SETUP 2 – Intraday Scalp Sell
Entry: 4068–4071
Stoploss: 4077
TP1: 4055
TP2: 4043
TP3: 4032
Logic: Engineered liquidity sweep above mid-range → fast downside move.
✔️ BUY SETUP 1 – Scalping Rebound
Entry: 4032–4030
Stoploss: 4024
TP1: 4048
TP2: 4068
Logic: SSL sweep → immediate bounce expected from discount zone.
✔️ BUY SETUP 2 – Deep Discount Buy
Entry: 3996–3994
Stoploss: 3988
TP1: 4010
TP2: 4035
TP3: 4068
Logic: A strong institutional accumulation area → ideal for reversal setups.
🧠 SESSION PLAN & NOTES
Do not trade inside the mid-range
Stick strictly to liquidity extremes for precision entries
Expect London fake-outs → wait for confirmation
NY session more likely to deliver the real move
Use M5/M15 CHoCH + displacement for entry confirmation
🏁 CONCLUSION
XAUUSD is currently holding a mild bearish structure on H1, with premium zones at 4146 and 4071 offering the best sell opportunities.
Discount areas at 4030 and 3994 remain the highest-probability zones for intraday reversals or continuation buys.
Trade with patience. Let the liquidity traps form—then strike with precision.

Strong news chain could push gold to retest 4300🟡 XAU/USD – Weekly Trading Plan (Nov 23–29)
SMC – FVG – Supply/Demand – High-Impact News Week
1. Market Context
Gold is sideways in the H4 accumulation structure, forming higher lows along the trendline.
Above are 3 important supply layers:
OLD FVG 1
OLD FVG 2
Large FVG 4220–4300
the price needs to sweep liquidity & hit the supply zone before creating a new direction.
2. Strong News Schedule for the Week
This week has a lot of USD news directly affecting gold:
Tuesday (Nov 25)
Core PPI – Retail Sales – PPI (4 consecutive red news) → strong volatility.
Wednesday (Nov 26)
Unemployment Claims
Durable Goods → Core Durable Goods
GDP q/q – GDP Price Index
Core PCE (most important inflation news of the week)
➡️ This is the decisive day for the trend for the rest of the week.
Friday (Nov 28)
German CPI (affects EUR → USD indirectly)
🎯 News Conclusion:
→ Gold likely to fake move – sweep liquidity before running correctly.
→ Thin SL zones will be continuously hunted.
3. Key Levels (from the chart you sent)
🔻 SELL Zone (Supply – FVG)
4189 – 4191 (Main Sell)
SL: 4195
This is a strong reaction zone for the week.
4132 – 4134 (Sell scalp)
SL: 4138
🔵 BUY Zone (Demand – Trendline – SMC)
4906 – 4904 (main BUY scalp zone in the chart)
SL: 3999
→ This is the only zone clearly marked as BUY in the chart.
Psychological level: 4000 – 3985
If the price falls → strong reaction to form the weekly low.
4. Weekly Trading Scenarios
🅰️ Scenario 1 – Price retraces to supply zone before dropping (most likely)
Price is forecasted to retest 4132–4134 → 4189–4191
After hitting 4190 ± → potential appearance of:
Bearish BOS H1/H4
Strong reversal to 4050 – 4000
🔻 SELL Plan
Sell 4132–4134 (scalp) SL 4138
Main Sell 4189–4191 SL 4195
TP targets:
TP1: 4090
TP2: 4050
TP3: 4000
🅱️ Scenario 2 – Price dips before news then surges (kill liquidity)
If gold is pushed down before PPI/GDP news:
Best BUY zone: 4000 – 3985
Form a low → surge back up to test supply.
🔵 BUY Plan
BUY 4000–3985
SL: 3975
TP:
4050
4100
4130
🅾️ Scenario 3 – If 4200 breaks
If 4200 is broken by a large-bodied H4 candle:
➡️ High probability gold will move up to test large FVG 4250–4300
→ At that point, only look for BUY pullbacks, no more SELL.

Gold Nonfarm: Buy OB 4030, Target Break 4111🔍 Market Context – November 20, 2025
Gold initially dropped nearly 70 pips at the start of the day but quickly rebounded sharply from the 4030–4032 zone, demonstrating strong buying pressure and a refusal to decline further.
The market structure on the H1–H2 timeframe is forming a classic, well-defined Inverse Head & Shoulders pattern—a quintessential bullish reversal pattern—signaling a potential upward expansion if the neckline is successfully broken.
📅 Key News Events Today:
🇺🇸 Non-Farm Payrolls (NFP)
📉 US Unemployment Rate
🏛 FOMC Meeting Minutes
🗣 Speeches by Trump, Barkin, Williams
🧾 Initial Jobless Claims
⚠️ These events could trigger sharp volatility and will determine the confirmation or rejection of the reversal pattern.
📊 Technical Analysis
🛒 BUY SETUP – Primary Priority
✅ Entry: 4030 – 4032
🛡 Stop Loss (SL): 4027
🎯 Take Profit (TP):
TP1: 4039
TP2: 4047
TP3: 4059
💡 Rationale: Price bounced strongly at the OB + SSS zone. This is a crucial technical support area and the base of the Inverse H&S pattern. The objective is to break the neckline to trigger the uptrend.
🔻 SELL SETUP – Short-Term Strategy
📍 Entry: 4093 – 4095
🛡 SL: 4098
🎯 TP:
TP1: 4088
TP2: 4077
TP3: 4060
TP4: 4033
💡 Rationale: This strategy is only applicable if the price forms a false breakout of the BSL zone and reverses. This is an ideal entry point for quick scalping if the market reacts negatively to the news.
🔑 Key Price Zones
Buy Zone (OB + SSS): 4030 – 4032
→ Strong demand zone, the base of the Inverse Head & Shoulders pattern, confirming the reversal signal if held.
Breakout Neckline Zone: 4101 – 4111
→ The neckline of the Inverse H&S pattern. Breaking this zone will open up opportunities for a sharp rise.
Final Resistance Zone: 4133 – 4140
→ The final target if the breakout is successful and the bullish pattern is confirmed.
✅ Strategy Conclusion
🎯 Main Strategy: Priority is to BUY in the OB zone 4030–4032.
🩸 SELL is only for short-term scalping if there is a signal of rejection at the BSL zone.
🕓 Caution: Be careful entering trades near the Nonfarm news release time—wait for price action to confirm the direction.

LiamTrading – XAUUSD H4 | Gold accumulates on the trendlineLiamTrading – XAUUSD H4 | Gold accumulates on the trendline, waiting to break the structure for a breakout
After testing the upward trendline twice, gold bounced up and then moved sideways around the 4065 area. On H4, this price zone has accumulated for almost a week – indicating that the selling force is not liquid enough to push the price down deeply, while there is still plenty of price gap above according to Fibonacci. My preferred scenario: gold continues to "compress" within the triangle, then breaks out to create a new wave.
Macro – Fed context
Fed member Collins emphasized that there is still reason to be cautious about cutting rates in the December meeting. She stated:
This is a complex phase, and it's not unusual for internal disagreements within the Fed.
The Fed must balance between the two goals of employment and inflation, which are moving in opposite directions.
This makes it difficult for the market to clearly price the interest rate scenario, so gold continues to choose to accumulate around important technical zones instead of breaking out in one direction.
Technical Analysis – Trendline, Fibonacci, Volume Profile
The current H4 structure is a triangle model with:
A downward sloping trendline from the old peak 42xx.
An upward sloping trendline from the late October low, acting as dynamic support.
Zone 4060–4070: the "balance" price zone last week – where the price moved sideways the longest, serving as a reference point for the short-term trend.
Key levels: 4132: near resistance, coinciding with the VAH area of the current Volume Profile.
4171: higher resistance, near the Fibonacci 1.0 area of the recovery wave.
4242: Fibonacci extension confluence zone (1.618) + historical resistance – where strong profit-taking is likely.
4347: 2.618 expansion zone – reference target if the peak is successfully broken.
4022 and 3997: important support close to the lower trendline – main buy zone if there is a liquidity sweep.
When the price decisively breaks out of one of the trendlines, the new trend on H4 will be clearer; the trading plan will follow this breakout direction.
Risk management and invalidation
H4 closes below 3997: the triangle structure is broken downward, fully prioritizing sell orders to lower zones – at that point, medium-term buy orders should not be held.
H4 closes above 4245 with good volume: considered a successful triangle peak breakout, discard all sell orders in this area and focus on buying according to the new trend.
Which scenario are you leaning towards for next week: breaking up to test 4242–4347 or sweeping down to 4022–3997 before bouncing back? Leave a comment and follow the LiamTrading channel on TradingView for daily XAUUSD updates.

XAUUSD – ACCUMULATION TRIANGLE ON D1💛 XAUUSD – ACCUMULATION TRIANGLE ON D1, AWAITING A NEW BREAKOUT THIS WEEK 🎯
🌤 Overview of the New Week
Hello everyone, Lana here 💬
Gold, after a very strong rise from the 3,500 region to above 4,400, is entering a "resting" phase on the D1 frame: the price continuously tests the upward trendline but has not yet broken it to confirm a downtrend.
The market is clearly waiting for a real breakout before forming a new medium-term wave.
Next week, we have CPI and PPI – important inflation data that could act as a catalyst to push gold out of the current accumulation zone.
💹 Technical Analysis (Daily Triangle)
On the D1 frame, when connecting the descending peaks and ascending bottoms, gold is in a narrowing triangle pattern.
The upward trendline below is still maintained, indicating that the medium-term trend has not reversed.
Below are important zones:
≈ 3,890: if the price closes below this area, it could confirm medium-term weakening.
Fibonacci & psychological resistance zone 3,800–3,900: strong support, confluence with old price structure.
POC Volume Profile around 3,650: if a deep decline scenario occurs, this will be the next price attraction zone.
Above, the old peak zone around 4,300–4,400 remains a large liquidity zone, a natural target if gold breaks the upper edge of the triangle.
In summary: the more compressed the triangle, the stronger the breakout – the direction will depend heavily on CPI/PPI data & Fed expectations.
🎯 Reference Trading Plan (Medium-Term)
💖 Scenario 1 – Maintain Uptrend (priority when the trendline is not broken)
Observe the reaction at the D1 upward trendline (area around 4,000).
If the price continuously bounces from the trendline and stays above the 3,890 area, you can:
Prioritize buying according to the trend at support retests on H4–H1.
Medium-term targets: 4,150 → 4,250 → 4,300–4,400 if the triangle breaks upwards.
💢 Scenario 2 – Triangle Breaks, Shifts to Medium-Term Decline
If D1 closes below 3,890:
Consider this a signal confirming medium-term weakening.
Prioritize selling at newly formed resistance zones.
Step-by-step targets: 3,800 → 3,700 (POC) → 3,500 (strong previous support).
In both scenarios, specific entry points should be refined on smaller frames (H4, H1) based on price action/OB/FVG.
⚠️ Note News & Risk Management
Next week's CPI & PPI could be the "final blow," pushing gold out of the triangle – volatility can be wide and fast, spreads may widen.
Last week's NFP news hardly created big waves for gold after the US government shutdown, indicating the market is holding strength waiting for more important data.
🌷 Conclusion & Interaction with LanaM2
Gold on D1 is in the final stage of the accumulation triangle – this is a time where patient observation is as important as a beautiful entry point 💛
Next week, I will continue to update daily details on smaller frames so everyone can have more specific entry points.

XAUUSD – Where Smart Money Strikes Today🌐 MARKET CONTEXT
Gold enters today’s session after a period of controlled volatility, with price repeatedly reacting around key liquidity pockets but failing to produce a clean breakout. The M30 structure remains bearish, with price rejecting premium levels and forming consistent lower highs.
Recent Drivers
USD stays firm as markets maintain expectations of a slightly hawkish Federal Reserve
Traders await upcoming mid-week data → low conviction, cautious positioning
Overall sentiment remains neutral — no strong safe-haven pressures
Session Outlook
London Session: Likely to engineer early sweeps into premium supply zones
New York Session: Higher chance of real directional expansion
Bias: Bearish intraday until discount zones trigger a CHoCH (shift of character)
Price is currently inside mid-range, so the safest setups remain at extremes where liquidity is concentrated.
📉 TECHNICAL ANALYSIS (SMC + LIQUIDITY)
Market Structure
M30 Trend: Lower High → Lower Low sequence
Equilibrium zone: 4068–4085
Inducement layers resting above 4147 and 4081
Liquidity Levels
BSL: Above 4147 & 4081
SSL: Below 4033 & deep liquidity at 3993
Market continues printing engineered wicks, trapping impulsive traders
Imbalances
Bearish FVG: 4147–4148 → perfect for premium scalp sells
Minor imbalance: 4081
Discount inefficiencies near 4033 and 3993 → ideal buy setups
🔑 KEY PRICE ZONES (Strong Logic + Clear Explanation)
4148–4147 ▶️ Premium Liquidity Trap – High-Quality Sell Zone
This area holds an unmitigated bearish order block combined with buy-side liquidity.
Smart Money typically uses this zone to trap breakout buyers before reversing sharply.
4079–4081 ▶️ Secondary Premium Sweep Zone – Fast Rejection Expected
A mini liquidity pool just above equilibrium, designed for early-session stop hunts.
Often triggers sharp intraday reversals.
4035–4033 ▶️ Discount Reaction Zone – Clean Scalping Demand
This zone holds micro-demand + SSL resting below.
Expect low-drawdown reactions ideal for quick intraday buys.
3995–3993 ▶️ Deep Discount Liquidity Pool – High-Probability Reversal Base
A rich accumulation of Sell-Side Liquidity combined with HTF discount structure.
Strong reversal potential if price reaches this level.
⚙️ TRADE SETUPS (High-Precision SMC Execution)
✔️ SELL SETUP 1 – Premium Rejection Sell
Entry: 4148–4147
Stoploss: 4126
TP1: 4135
TP2: 4120
TP3: 4085
Logic: BSL sweep + bearish imbalance fill → sharp sell-off expected.
✔️ SELL SETUP 2 – Mid-Range Liquidity Sweep
Entry: 4079–4081
Stoploss: 4087
TP1: 4065
TP2: 4048
TP3: 4033
Logic: Quick liquidity hunt above equilibrium followed by displacement.
✔️ BUY SETUP 1 – Intraday Scalping Rebound
Entry: 4035–4033
Stoploss: 4027
TP1: 4048
TP2: 4070
Logic: SSL sweep → micro CHoCH → ideal for fast bullish reaction.
✔️ BUY SETUP 2 – Deep Discount Reversal
Entry: 3995–3993
Stoploss: 3987
TP1: 4010
TP2: 4040
TP3: 4070
Logic: Major discount zone + liquidity buildup → strong reversal potential.
🧠 NOTES / SESSION PLAN
Avoid mid-range trading — only trade at liquidity extremities
Expect London fake-outs; real movement likely in NY
Always wait for M5/M15 confirmation (CHoCH + BOS)
Avoid buying in premium areas; avoid selling in deep discount zones
Follow strict risk management — volatility may spike unexpectedly
🏁 CONCLUSION
Gold continues to hold a bearish intraday structure, favouring premium sell setups at 4147 and 4081.
Discount zones at 4033 and 3993 offer high-probability buy reactions and possible deeper reversals.
Trade with patience. Execute only at liquidity extremes.
Let Smart Money show its trap — then strike with precision.

XAUUSD–FRIDAY BEFORE PMI: MAINTAINING HEAD AND SHOULDERS PATTERN💛 XAUUSD – FRIDAY BEFORE PMI: MAINTAINING HEAD AND SHOULDERS PATTERN, WAITING TO BREAK RANGE 4132–3998 🎯
🌤 1. Overview
Hello everyone, it's Lana here again 💬
Today is the last Friday of the week, the market is waiting for PMI and preparing to enter a phase with a lot of important data in December.
Meanwhile, BTC has been rising faster than XAU in recent weeks, indicating that speculative money is leaning towards crypto, while gold is temporarily moving sideways accumulating.
The US Department of Labor will release the November employment report on December 16, which is 6 days after the December Fed meeting. In other words, the Fed is in a "blackout" state regarding labor data for nearly another month – this forces the market to price in advance, making gold's volatility range wide but lacking a clear trend.
💹 2. Technical Analysis – Range & Head and Shoulders Pattern
On the H3/H4 frame, gold is fluctuating within the large range of 4132 – 3998.
The price wave is gradually narrowing towards the end of the triangle, represented by:
Lower highs,
Higher lows,
→ When one of the two boundaries is broken, a new trend is likely to explode in the direction of the breakout.
The inverse Head – Shoulders – Head pattern has not been broken:
Left shoulder – Head – Right shoulder are all above the rising trendline.
For the final wave of the pattern to follow the rhythm, the price needs to confirm surpassing 4109:
When closing a candle above 4109, the short-term uptrend is confirmed,
At that point, gold can aim for higher liquidity areas such as 4132 → 4145 → 4200.
Conversely, if gold breaks 3998, this will be both:
breaking the range bottom,
and negating the Head and Shoulders pattern,
→ opening the possibility of a deeper decline to the 3960–3920 area.
🎯 3. Reference Trading Scenarios
💖 BUY Scenario – following the pattern & range bottom support
1️⃣ Buy at support 3998–4000
Entry: 3998–4000
SL: below 3990 (depending on risk management)
TP: 4025 → 4040 → 4078
2️⃣ Buy when confirmed above 4109
Condition: Price closes a candle above 4109, confirming the Head and Shoulders pattern is maintained.
Entry: around 4100–4105
SL: 4090
TP: 4132 → 4145 → 4200
💢 SELL Scenario – trading the upper boundary of the range
Sell: 4130–4132
SL: 4138
TP: 4110 → 4095 → 4070 → 4045
Selling should only be considered as scalping against resistance within the range, not the main trend if the Head and Shoulders pattern is still valid.
⚠️ 4. Notes & Risk Management
Range 4132–3998 is still controlling the market:
Above 4109 → prioritize Buy according to the short-term uptrend.
Below 3998 → consider shifting bias to Sell following the breakout.
PMI, Fed expectations, and upcoming employment data may trigger unexpected volatility, therefore:
🌷Gold is at the intersection of technical patterns and macro stories 💛
Be patient and wait for reactions at 3998 and 4109, as these are the two key points that determine whether we enter a new upward wave or a deeper decline.
💛 Like – 💬 Comment – 🔔 Follow LanaM2 to follow gold with me every day ✨

XAUUSD – Battle Zones of the Day🌐 MARKET CONTEXT
Gold enters today’s session after a period of compressed volatility, where price tapped both buy-side and sell-side liquidity several times without forming a decisive trend. On the M30 chart, the intraday structure remains bearish, with price consistently rejecting premium levels and forming lower highs.
Recent Catalysts:
USD holds mild strength following a slightly hawkish tone from the Federal Reserve
Market is awaiting mid-week economic releases → leading to a cautious sentiment
Risk appetite remains neutral with no strong safe-haven flows
Session Expectations:
London Session: Likely to generate early liquidity sweeps towards premium zones
New York Session: Higher probability of seeing genuine directional expansion
Bias: Bearish intraday unless price reaches discount zones and forms a CHoCH
Price is currently trading within mid-range levels, making the extreme liquidity zones the safest points for execution.
📉 TECHNICAL ANALYSIS (SMC + LIQUIDITY STRUCTURE)
Market Structure
M30 structure: Lower Highs → Lower Lows
Equilibrium zone: 4075–4085
Inducement layers accumulating above 4147 and 4070
Liquidity
BSL: Above 4147 & 4070
SSL: Below 4033 and the deeper pocket at 3993
Market forming engineered liquidity wicks on both sides
Imbalance Zones
Bearish FVG: 4147–4148 → strong scalp sell zone
Minor imbalance: 4070–4071
Discount imbalances: 4033 and 3993 support buy setups
🔑 KEY PRICE ZONES (Clear & Attractive Explanations)
4148–4147 → Premium Liquidity Trap – Ideal Scalp Sell
A premium zone combining an unmitigated bearish order block and BSL inducement.
This area often triggers breakout buyers before institutions reverse the move.
4071–4070 → Secondary Premium Liquidity – Fast Rejection Zone
A small liquidity pool above equilibrium designed to sweep early highs before price turns bearish again.
4035–4033 → Discount Reaction Zone – Scalping Demand
A micro order block aligned with a cluster of sell-side liquidity.
Provides clean, low-drawdown intraday rebounds.
3995–3993 → Deep Discount Liquidity Pool – High-Value Reversal Zone
A major liquidity pocket aligned with higher-timeframe discounts.
If price reaches here, a strong reversal is highly probable.
⚙️ TRADE SETUPS (SMC-Driven, High Precision)
✔️ SELL SETUP 1 – Premium Scalp
Entry: 4148–4147
Stop-loss: 4126
Targets: 4135 → 4120 → 4085
Logic: BSL sweep + FVG fill leading to strong bearish rejection.
✔️ SELL SETUP 2 – Mid-Range Liquidity Sweep
Entry: 4071–4070
Stop-loss: 4077
Targets: 4058 → 4043 → 4033
Logic: Sweep of mini BSL followed by downward displacement.
✔️ BUY SETUP 1 – Intraday Rebound
Entry: 4035–4033
Stop-loss: 4027
Targets: 4048 → 4070
Logic: SSL sweep with potential for a micro CHoCH → clean bounce setup.
✔️ BUY SETUP 2 – Deep Discount Reversal
Entry: 3995–3993
Stop-loss: 3987
Targets: 4010 → 4040 → 4070
Logic: Strong higher-timeframe discount zone → excellent reversal potential.
🧠 NOTES / SESSION PLAN
Avoid trading in mid-range areas — only execute at the extreme liquidity zones
Expect fake movements during London open
New York session likely provides the main trend direction
Wait for M5/M15 confirmation signals (CHoCH + BOS)
Avoid buying around premium levels to stay clear of liquidity traps
🏁 CONCLUSION
XAUUSD continues to hold a bearish intraday structure, favouring premium-zone sell opportunities at 4147 and 4070.
Discount-zone levels at 4033 and 3993 remain high-probability areas for intraday bounces or deeper reversals.
Trade only at liquidity extremes.
Be patient.
Let the market form the trap — and then strike with precision.

Brian here with the gold outlook for November 20thGood morning everyone, Brian here with the gold outlook for November 20th. The ABC correction phase of gold is nearly complete, and the market is preparing to enter a new wave phase amidst a flurry of USD data today.
Fundamental Analysis
Today's focus remains on the US labor data: NFP (or revisions), Unemployment Rate, and Initial Jobless Claims.
If the data shows a cooling labor market, expectations for the Fed to soon pivot to a rate-cutting cycle will rise, weakening real yields, putting pressure on the USD, and supporting gold prices.
Conversely, "too good" data will strengthen the dollar, allowing for a short-term repricing move, potentially dragging gold down to lower liquidity zones before recovering.
US session liquidity may be thin before the news release, making it prone to spikes due to algorithms and large flows simultaneously adjusting positions.
Overall, the macro backdrop still favors "buying the dip" for gold, but you must accept strong volatility around news time.
Technical Analysis
On the chart, gold has completed an ABC corrective wave within a descending channel, part of a larger uptrend.
The current descending channel only serves as a corrective leg after the previous upward wave; prices are trading above the "mean" area of the bullish structure, indicating the larger market structure remains bullish.
Below is the liquidity zone / demand zone 4013–4015, coinciding with the previous low and the lower channel boundary – if there's another stop-hunt to this area, it is still considered an opportunity to join the upward move, as long as 4008 is not breached.
Above, the 4086–4100 cluster is the decision zone: breaking and holding above here will confirm exiting the corrective channel, triggering an impulsive leg towards resistances 4132–4146 and further to 4187.
In summary, the main bias remains bullish, prioritizing buy strategies at support zones or after breakout confirmation.
Key Price Levels
Resistance: 4086 – 4100 – 4110 – 4132 – 4146
Support: 4040 – 4030 – 4015
Trading Scenarios
Buy Scenario 1 – Continuation Breakout
Entry: 4086
SL: 4078
TP: 4100 – 4120 – 4140
Prioritize when price breaks up and retests 4086–4100 as a new support zone, confirming exit from the descending channel.
Buy Scenario 2 – Deep Liquidity Sweep
Entry: 4015–4013
SL: 4008
TP: 4030 – 4045 – 4070
Watch for strong price reactions at the demand zone, with pin bars or engulfing candles signaling order flow returning to buyers.
Sell Scenario – Sell Reaction at Strong Resistance
Entry: 4144–4146
SL: 4151
TP: 4132 – 4120 – 4100
Short-term sell strategy, leveraging the high supply zone if price rises straight up without sufficient accumulation.
The medium-term upside target if the bullish wave develops as expected remains the 4187 area.
What do you think of this scenario? Remember to follow Brian for daily gold insights and comment your views below to join the discussion.

Gold Strategy 11/18: Break this Points gold will more FALL📝 GOLD TRADING PLAN – Nov 18
1. Market Context
Price is moving around 4030–4040 after a bearish BMS break.
Main structure: corrective bounce within a broader liquidity-seeking environment.
Expectation: liquidity sweep → reaction → directional move.
2. Key Trading Zones (from chart)
🔽 BUY ZONES
Primary Buy Zone
3982 – 3980
→ SL: 3977
Strong confluence (trendline + OB + support).
Deep Buy Zone
3927 – 3920 (OB zone)
→ SL below 3920
Only active if price sweeps below 3980 and continues lower.
🔼 SELL ZONE
Primary Sell Zone
4056 – 4058
→ SL: 4061
Strong confluence: FVG + resistance + liquidity sweep zone.
Sell Targets
TP1: 4000
TP2: 3980
TP3: 3930 (only if heavy news-driven volatility)
3. Expected Price Scenarios
Scenario 1 – Most Probable
🔹 Price retests trendline → minor bounce → pushes into 4056–4058
🔹 Sell from that zone → target 4000 → 3980
Scenario 2 – Secondary
🔹 Price drops first → reaches 3982–3980
🔹 Look for bullish reaction → Buy → retest 4040–4050
Scenario 3 – High-volatility Move (News Impact)
🔹 If price breaks below 3980 decisively → drops toward 3927–3920
🔹 Strong Buy zone → expect reversal back into 4000–4030
4. News Impact – Nov 18
High-impact events today:
FED speakers: Waller, Barr, Barkin (10:00pm–11:00pm)
→ Strong volatility expected on gold.
President Trump Speaks – 6:00am
USD Housing Starts – 8:15pm
🔔 Notes:
Avoid large positions before major speeches.
Keep SL tight; gold reacts aggressively to USD news.

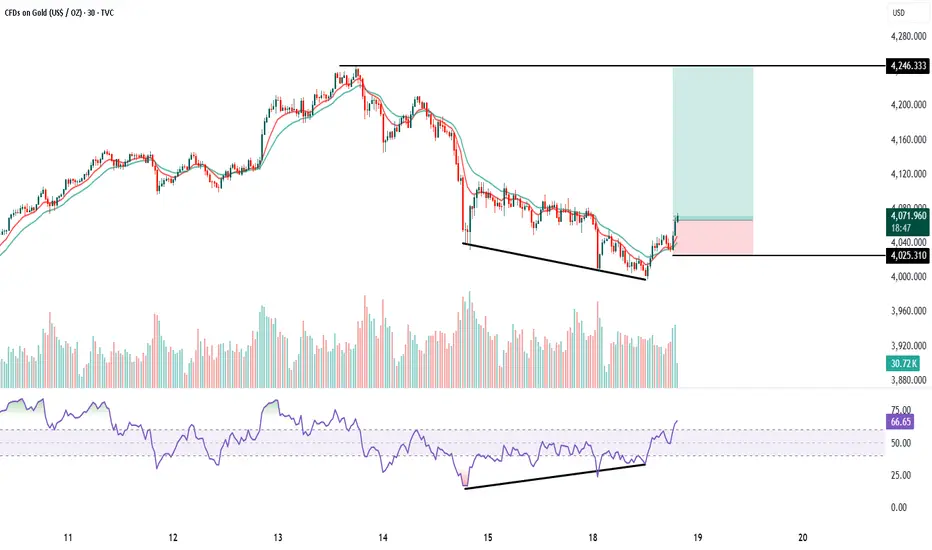
GOLD 30 Min chart analysis1. Trend : Price was in a downtrend with continuous lower highs and lower lows. Now the chart is showing a falling wedge pattern, which is a bullish reversal pattern. Breakout candle is visible with strength, indicating trend reversal from bearish to bullish on the 30-minute timeframe.
2. Volumes: Volumes remained average during the fall.
At the breakout zone, you can see volume expansion, which confirms buyers are stepping in.
This supports a valid bullish breakout.
3. Momentum (Price Action + EMAs): Price is crossing above the 10 EMA and 20 EMA, and both EMAs are starting to turn upward. This shows momentum shift from sellers to buyers. Momentum candles at breakout confirm the start of an upward move.
4. RSI Divergence: Price made lower lows, but RSI made higher lows.
This is a classic bullish divergence, indicating selling pressure is weakening. RSI has now moved above 60, confirming momentum is picking up strongly.
Buy above 4075 after the breakout candle closes above falling wedge.
This ensures confirmation and avoids a false breakout.
Keep SL just below wedge support: SL = 4025
Target : The major horizontal resistance shown on the chart is:
Target = 4246 This is also the measured move of the wedge, matching the resistance zone.
Risk–Reward: RR is approximately 1:3 to 1:3.5, which is ideal for breakout trades. This is a high-probability trend-reversal breakout setup with a clear target and safe stop loss.
GOLD DAILY TRADING 17/11: BUY TODAY🦁 THE GOLDEN ARENA – 17 NOV, 2025
“Rebound or Trap? Let the Orderflow Decide.”
A visually striking TradingView plan – part narrative, part tactical map. This is not just a bias, it’s a battlefield strategy.
🧭 MARKET CONTEXT SNAPSHOT
Price currently consolidating around 4076 – 4084, after clean breaks of structure (BOS) and a deep retracement.
Significant supply zones confirmed at 4157 – 4180, where POC clusters, FVG imbalances, and volume absorptions align.
Orderflow on M5–M30 shows fading buy pressure and aggressive sells into lower highs.
🎯 CORE STRATEGIES FOR TODAY
🔺 Scenario 1: Breakout Trap SELL (High Conviction)
Target Zone 4178 – 4180 (Main Supply)
Stop Loss (SL) 4185
Take Profit 1 (TP1) 4155 (Low volume node)
Take Profit 2 (TP2) 4100 (Local support)
Take Profit 3 (TP3) 4040 (Structural SSL level)
🔍 Why this setup?
Clear liquidity pool above 4178 being targeted.
Volume tapering off into the move → classic reversal signal.
Footprint shows absorption candles at key supply.
🪙 Scenario 2: FVG Scalping SELL (Secondary)
Entry Zone 4157 – 4158
SL 4163
TP 4100 – 4105
✅ Perfect for short-term scalpers looking to ride the intraday rejection from the imbalance zone.
🟢 Bullish Reversal INVALIDATION (Failsafe Plan)
Trigger Break and hold above 4185
Entry Breakout Buy above 4190
SL 4175
TP 4220
Only flip bullish if aggressive buyers step in + strong delta + profile breakout.
🧱 KEY PRICE ZONES TO MONITOR
Level Description
4185 Stopline – invalidates Sell
4178 – 4180 Main SELL Zone (POC + FVG)
4157 – 4158 Minor FVG Scalping Area
4100 Micro support + Bull trap
4040 SSL – liquidity target
📊 VOLUME & ORDERFLOW INSIGHT
M5–M30 Footprints:
Massive seller imbalances from 4175+
Footprint at 4084 shows buyer exhaustion
Volume Profile:
High-volume node at 4178 acting as strong resistance
Low-volume gap below 4155 → fast price travel zone
Delta:
Negative delta buildup confirming sell bias
💡 EXECUTION CHECKLIST
✅ Wait for entry trigger at marked zones – don’t pre-empt.
🚫 Avoid FOMO buy into supply unless 4185 is cleanly broken.
🔔 Set alerts at 4157 and 4180 for rejection signs.
🧠 TRADING MANTRA OF THE DAY
"The chart speaks in structure,
The volume whispers the truth,
But the orderflow shouts the conviction."
📌 Bias: SELL on retracements toward supply → hold for 4100–4040
📌 Watchlist: Footprint aggression, absorption blocks, spoof traps

GOLD H1 – Gold Reacts to Mixed U.S. Inflation Data🟡 XAUUSD – Intraday Smart Money Plan | by Ryan_TitanTrader (14/11)
📈 Market Context
Gold continues to trade within a balanced range as investors digest the latest U.S. inflation data. The CPI report showed cooling price pressures, while producer prices (PPI) are due soon — both shaping market sentiment toward the Fed’s December rate outlook.
• Softer inflation supports a bullish bias if gold holds the discount zone.
• Renewed USD strength could trigger short setups from premium liquidity zones.
Institutional flows suggest engineered liquidity hunts before a decisive move resumes.
🔎 Technical Analysis (1H / SMC Structure)
• Structure: Gold remains in a short-term bullish correction after a strong sell-off, with recent ChoCH signaling a possible re-accumulation phase.
• Premium Zone: 4300–4298 aligns with a previous unmitigated supply and internal liquidity — ideal for sell-side reactions.
• Discount Zone: 4144–4142 overlaps with the last bullish OB and EMA100 area — a potential demand zone for continuation.
• Liquidity: Resting buy-side liquidity sits above 4300, while inducement below 4140 could lure early longs before true accumulation.
🔴 Sell Setup (Premium Reaction Zone)
• Entry: 4,300 – 4,298
• Stop-Loss: 4,310
• Take-Profit Targets:
→ 4,178 (previous BOS zone)
→ 4,144 (discount retest)
→ 4,110 (deep liquidity pocket)
📌 Valid only after a liquidity sweep and bearish BOS confirmation on M5–M15.
🟢 Buy Setup (Discount Reaction Zone)
• Entry: 4,144 – 4,142
• Stop-Loss: 4,135
• Take-Profit Targets:
→ 4,185 (minor structure high)
→ 4,210 (liquidity void fill)
→ 4,300 (final premium reaction zone)
📌 Valid if price reclaims structure with bullish BOS confirmation.
⚠️ Risk Management Notes
• Stay patient until U.S. PPI data confirms direction.
• Avoid trades between 4175–4250 (low R/R consolidation area).
• Scale out partials near liquidity pools and trail stops after confirmation.
• Maintain disciplined risk exposure under 2%.
Summary
Gold is in an engineered equilibrium phase — liquidity pools are forming at both extremes.
• Sell zone: 4300–4298 (premium reaction zone)
• Buy zone: 4144–4142 (discount accumulation zone)
Expect manipulation around mid-range levels before a clean directional move unfolds.
📍Follow @Ryan_TitanTrader for more Smart Money updates ⚡

Gold H1 – Gold Awaits U.S. PPI Data After 5-Wave Completion🟡 XAUUSD – Elliott Wave Intraday Outlook | 14/11
📈 Elliott Wave Context
Gold has completed a textbook 5-wave impulsive rally, peaking near 4250 before entering a corrective phase. The current retracement appears to be forming an ABC correction, with price now approaching the C-wave completion zone around 4145–4147.
Today’s focus shifts to the upcoming U.S. Producer Price Index (PPI) report — a crucial inflation indicator that may influence Fed policy expectations and short-term dollar momentum.
• A hotter PPI print could strengthen USD and trigger a brief sell-off from premium zones.
• A softer reading could weaken USD and fuel a renewed push from discount levels.
🔎 Wave Structure Breakdown (H1)
• Wave 1 → Initial breakout from liquidity trap (~4070).
• Wave 2 → Shallow retracement, respecting prior OB.
• Wave 3 → Strong extension into new highs (~4220+).
• Wave 4 → Sideways correction with internal liquidity grab.
• Wave 5 → Final push to ~4250 — marking potential top.
Now the market is tracing an A–B–C corrective structure, with wave C expected to finalize near the BUY ZONE 4145–4147 (SL 4138) before the next bullish leg resumes.
Intraday Trade Zones (Elliott-Based)
🟩 BUY ZONE: 4145 – 4147 | SL 4138
Looking for completion of wave C and bullish reversal confirmation (BOS or mitigation from demand block).
Targets: 4205 → 4230 → 4250
🟥 SELL ZONE: 4245 – 4243 | SL 4252
Scalp opportunity aligning with potential wave B retest or short-term overextension before larger correction.
Targets: 4180 → 4150
📌 Summary
Gold remains technically bullish after completing a 5-wave structure but is currently digesting gains through a corrective ABC phase. The 4145–4147 discount zone serves as a high-probability wave C completion area, especially if PPI data softens USD momentum.
Wait for structure confirmation before entering, and monitor the PPI release as it may dictate whether gold extends higher or deepens its correction.

HOW MANY BUYER TRAPS BEFORE NEW ATH GOLD ?📈 Analysis of Gold Trading Plan (SMC/Order Flow)
🔍 Current Market Context
Structure: The market has shown a strong bullish trend, marked by a Break of Structure (BOS) and a Liquidity Done Sweep around the ₹4,145 price level.
Liquidity:
The market performed a "First Sweep Here" (initial liquidity grab) after the rally, signaling a readiness for a correction.
The main liquidity target for the upward move (Big Boy Liquidity) is set above the ₹4,240 level.
Recent Price Action: After hitting the peak and the initial sweep, the price experienced a sharp decline, creating a correction zone.
🎯 Proposed Trading Plan
The plan focuses on two main scenarios: a Short-term Sell (SELL SCALP) and a Primary Buy (BUY GOLD).
1. Primary Buy Scenario (BUY GOLD)
This is the main scenario to continue the bullish trend (Long).
Entry Zone: BUY GOLD 4126 - 4124.
This zone is likely a critical Order Block or an unmitigated Demand Zone, positioned just below the previous liquidity sweep and acting as a strong support/Displaced/Fair Value Gap (FVG) area.
Stop Loss (SL): SL 4120.
This stop-loss level protects the long position, placed just below the key entry zone to avoid being shaken out by minor liquidity grabs.
The indicated Stoploss Buyer area (around ₹4,145 - ₹4,150) suggests the price drop might aim to sweep prior buyers' liquidity before bouncing from the ₹4,124 - ₹4,126 zone.
Take Profit (TP): The ultimate target is the Liquidity Limit Big Boy (above ₹4,240).
2. Short-term Sell Scenario (SELL SCALP)
This is a short-term trading opportunity (Scalping) during the corrective move.
Entry Zone: SELL SCALP 4208 - 4210.
This area likely represents a Supply Zone or a bearish Order Block following the sharp drop, where hidden selling pressure resides.
Stop Loss (SL): SL 4212.
This is a very tight stop loss, placed just above the entry zone.
Take Profit (TP): The target is the BUY GOLD 4126 - 4124 area (the primary buy entry zone).
⚠️ Key Considerations
Timeline: This plan requires the price to move according to the predicted scenario (drop to the buy zone before rallying).
Confirmation: Traders should wait for structural confirmation on a lower timeframe (e.g., a Change of Character - CHoCH or a bullish BOS) at the 4126 - 4124 buy zone before entering the trade to improve the probability of success.
Risk Management: Using the suggested Stop Loss (SL) is mandatory for capital protection.

GOLD H1 – Gold Awaits U.S. PPI Data for Directional Clarity🟡 XAUUSD – Intraday Smart Money Plan | by Ryan_TitanTrader (13/11)
📈 Market Context
Gold is consolidating after a strong impulsive leg, with intraday traders now focused on the upcoming U.S. Producer Price Index (PPI) release — a key inflation metric that often shapes Fed expectations.
• A hot PPI reading could strengthen the USD and trigger a sell-off from premium levels.
• A softer print may weaken the dollar, encouraging another liquidity grab above 4250.
Institutional order flow shows potential for engineered liquidity sweeps around both extremes before the next directional push.
🔎 Technical Analysis (1H / SMC Structure)
• Structure: Still bullish overall, but showing early distribution near the 4250 handle.
• Premium Zone: 4255–4253 aligns with an unmitigated supply and prior buy-side liquidity pool — a prime short setup if price reacts after a liquidity sweep.
• Discount Zone: 4168–4166 sits within the recent FVG and above EMA100 — a valid area for re-accumulation and continuation if price corrects deeper.
• Liquidity: Equal highs at 4255 and lows near 4156 signal potential stop-hunt traps before a decisive move.
🔴 Sell Setup (Premium Reaction Zone)
• Entry: 4,255 – 4,253
• Stop-Loss: 4,265
• Take-Profit Targets:
→ 4,182 (previous BOS zone)
→ 4,148 (mid-range equilibrium)
→ 4,110 (discount reaction zone)
📌 Valid only if price sweeps buy-side liquidity and confirms bearish BOS on M5–M15.
🟢 Buy Setup (Discount Reaction Zone)
• Entry: 4,166 – 4,168
• Stop-Loss: 4,156
• Take-Profit Targets:
→ 4,210 (short-term liquidity pocket)
→ 4,248 (imbalance fill zone)
→ 4,255 (final liquidity target)
📌 Valid only if price mitigates the FVG and reclaims structure with bullish BOS confirmation.
⚠️ Risk Management Notes
• Wait for PPI volatility before entering trades.
• Avoid trading mid-range (4180–4210) – low R/R zone.
• Scale out partials near liquidity points and trail stops post-confirmation.
• Maintain disciplined risk: 1–2% max per setup.
Summary
Gold is in pre-news equilibrium, with both buy- and sell-side liquidity pools clearly defined:
• Sell zone: 4255–4253 (premium reaction area)
• Buy zone: 4168–4166 (discount re-entry area)
Expect engineered liquidity grabs before a decisive move — patience and structure confirmation remain key.
📍Follow @Ryan_TitanTrader for real-time Smart Money updates ⚡

GOLD: Big Pullback Loading Before a 4400 Rally?Bias: Bullish – Buy-the-Dip Strategy
Approach: Smart Money Concepts (SMC)
🌐 Market Context
Gold continues to show a strong recovery, maintaining a clear bullish structure across the H1, H4, and Daily timeframes.
Institutional order flow remains firmly on the buy-side as:
Liquidity on H1/H4 highs is being swept consistently
Pullbacks are respecting Demand Order Blocks (OBs)
Multiple Breaks of Structure (BOS) confirm bullish continuation
However, the region 4280 – 4330 (FVG + major trap zone) has historically triggered strong distribution – making it a likely area for liquidity hunts and fake breakouts before any corrective move.
🎯 Key Price Levels
🔴 Resistance Zones (Potential Distribution Areas)
4274 – 4295
4330 – 4345 (FVG + Biggest Trap Zone)
Expect volatility and sharp reactions here – suitable for partial profit-taking, not for chasing buy entries.
🟢 Support / Buy Zones (Institutional Demand Areas)
1️⃣ BUY Opportunity – Shallow Pullback (High Probability)
Entry: 4170 – 4190 (H4 OB + BOS retest)
SL: Below 4170
TP1: 4275
TP2: 4360 – 4400
➡️ This is today’s primary setup. Requires clear bullish confirmation on entry.
2️⃣ BUY Opportunity – Deep Pullback (High R:R Setup)
Entry: 4100 – 4120 (Deep OB + liquidity sweep level)
SL: Below 4100
TP1: 4275
TP2: 4360 – 4400
➡️ Best scenario if the market retraces deeply — exceptional Risk:Reward.
📉 Why Selling Is Not a Priority
Despite resistance overhead, the market remains:
Bullish in structure
Supported by demand zones
Without a confirmed Market Structure Shift (MSS) → Bearish BOS
Therefore, selling remains counter-trend and not part of the main trading plan today.
📈 Institutional Technical Outlook (H1/H4)
1. Price approaching 4280 – 4330 trap zone
Expect:
Liquidity sweeps
Wick-driven false breakouts
Short-term corrections back into OB before continuing upwards
2. Liquidity Map
4170 liquidity pool below current price → likely target for engineered pullback
4300 – 4350 equal highs → attractive upside draw for smart money
🧠 Professional Trade Plan Summary
✔️ Do not chase breakouts near resistance
✔️ Wait for price to retrace into:
4170 – 4190
4100 – 4120
✔️ Main targets:
TP1: 4275
TP2: 4360 – 4400
✔️ At TP1:
Secure 50%
Move SL to Break-Even
✔️ Plan invalidation if price closes below 4100
📌 Notes for Large-Capital Traders (UK/EU)
Today’s environment is ideal for high-quality, low-frequency entries at institutional demand zones.
Avoid buying at highs; patience will deliver the best setups.
This plan follows a clean institutional trend-following methodology — suitable for accounts prioritising consistency and low drawdown.
📊 Daily Bias: Strong BUY
⏳ Waiting for pullback towards 4170 – 4190 or 4100 – 4120
🚀 Targeting 4360 – 4400 over the next sessions

GOLD H1 – Awaiting CPI Data for Next Big Move🟡 XAUUSD – Intraday Smart Money Plan | by Ryan_TitanTrader (12/11)
📈 Market Context
Gold remains in a controlled retracement phase after a strong impulsive leg last week. The market is now consolidating within a defined 1H range, showing clear reactions near short-term EMAs as traders await today’s U.S. CPI release, a key driver of intraday volatility.
• A higher-than-expected CPI could reignite USD strength and push gold toward the discount zone.
• A softer CPI print may trigger a renewed push into the premium zone, inviting liquidity grabs above 4200.
Institutional flows remain balanced between short-term profit-taking and position building ahead of the inflation print, suggesting engineered liquidity sweeps before the real move unfolds.
🔎 Technical Analysis (1H / SMC Style)
• Structure: Market structure is still bullish but showing distribution signs at the top of the range.
• Premium Zone: 4201–4199 aligns with unmitigated supply — a prime area for potential sell-side reaction if CPI sparks a bullish liquidity sweep.
• Discount Zone: 4083–4081 overlaps with the 0.618 Fibonacci retracement and sits just above EMA100 — an ideal re-accumulation area for institutional buys.
• Liquidity: Equal lows near 4080 and equal highs near 4200 make both sides vulnerable to engineered stop-hunts before direction is confirmed.
🔴 Sell Setup (Premium Reaction Zone)
• Entry: 4,201 – 4,199
• Stop-Loss: 4,210
• Take-Profit Targets:
→ 4,140 (first liquidity pocket)
→ 4,102 (mid-range equilibrium)
→ 4,083 (discount zone confluence)
📌 Only valid if CPI causes a liquidity sweep into premium, followed by M5–M15 bearish BOS confirmation.
🟢 Buy Setup (Discount Reaction Zone)
• Entry: 4,081 – 4,083
• Stop-Loss: 4,074
• Take-Profit Targets:
→ 4,102
→ 4,140
→ 4,199
📌 Only valid if price sweeps 4080 liquidity and reclaims structure with bullish BOS on M15 timeframe.
⚠️ Risk Management Notes
• Wait for CPI-induced volatility before executing any setup.
• Avoid mid-range trades between 4100–4140 — this is equilibrium noise.
• Reduce size pre-news; volatility spikes can trigger premature stops.
• Scale partials at each liquidity pocket and trail stop-losses accordingly.
✅ Summary
Gold is consolidating ahead of CPI, with dual liquidity zones clearly defined:
• Sell zone: 4201–4199 (premium reaction area)
• Buy zone: 4083–4081 (discount re-entry area)
The market is likely to hunt one side of liquidity before revealing true intent. Traders should remain patient, trade from extremes, and align entries with confirmed structure shifts.
FOLLOW @Ryan_TitanTrader for real-time SMC updates ⚡

Gold H1 – 5-Wave Complete Amid Fed Rate Hopes & Dollar Rebound🟡 XAUUSD – Elliott Wave Intraday Outlook | 12/11 | by Ryan_TitanTrader
📈 Elliott Wave Context
Gold appears to have completed a clear 5-wave impulsive advance on the H1 chart, with wave 5 reaching into the premium zone around 4,149–4,151. Concurrently, macro news is supporting bullion: weaker US labour data and rising expectations of a Federal Reserve rate cut have bolstered safe-haven flows.
Now price is retracing from the highs, suggesting that a classic corrective ABC sequence may be forming.
🔎 Technical Breakdown (Wave Structure)
• Wave 1: Initiation rally from ~3,965
• Wave 2: Shallow pull-back to near ~4,000
• Wave 3: Strong impulse past ~4,080 → extended
• Wave 4: Controlled correction holding trend-line support
• Wave 5: Final push topping near ~4,149–4,151 (SELL ZONE)
With the 5-wave impulse complete, the market is likely shifting into:
Wave A → bear leg
Wave B → corrective rebound
Wave C → deeper decline
📉 Expected Elliott Wave Path (ABC)
Wave A projection:
• Likely break below the 2-4 trend-line
• First reaction zone: ~4,081 (Fibonacci 0.382)
• Main downside target: ~4,059 (BUY ZONE)
Wave B projection:
• Corrective rebound toward either ~4,108 or ~4,149 (upper premium)
Wave C projection:
• Key downside targets:
o ~4,037 (Fibo 0.618)
o ~4,025–4,010 (trend-line support)
Wave C often equals Wave A in length → aligns with ~4,059 zone for potential cycle end.
Intraday Trade Plan (Elliott-based)
Scenario 1 – SELL the corrective wave (A–B–C)
Preferred strategy given completed impulse.
Entry: After H1 candle breaks below 2-4 trend-line, or on Wave B retest into ~4,149–4,151 (SELL ZONE)
Stop Loss: Above wave-5 high: ~4,155
Take Profit zones:
• TP1: ~4,081
• TP2: ~4,059
• TP3: ~4,037
Scenario 2 – BUY only if correction invalidates
If gold refuses to break the 2-4 trend-line and pushes above ~4,155 → wave 5 may extend.
Entry: Above ~4,155
SL: ~4,149
TP: ~4,175–4,200
📌 Summary
For 12/11, gold has completed a textbook 5-wave impulse and is now ripe for a corrective ABC pattern. With macro forces (Fed rate-cut expectations, weaker dollar) providing backdrop, the highest-probability trade is to sell the Wave B retest and ride Wave C toward deeper support near ~4,059. Stay patient, let the structure confirm the impulse → correction transition before committing.
