A strong ~1:10 RnR XAUUSD/Gold trade idea.Gold has created a good price action which may lead to a very high RnR price movement.
Here are signals identified for the trade.
1. It is breaking trend inline after and earlier fake out. Which is a strong signal for upside move.
2. Taking reversal at golden zone of 4H last swing.
3. Rejection candle at 1H.
4. Bullish diversanse is already observed in RSI
5. Taking support from bullish trend line.
6. 5m W pattern is created and breakout done.
7. Price is taking pull back to broken resistance.
8. It may 1:10 trade if everything goes as plan.
9. Price rejection should be observed at the pullback level before taking further upside movement.
P.S.- This is jut an idea not trade recommendations.
Goldlong

GOLD(XAUUSD) Forming a pennant / ascending triangle 📌 Gold (XAUUSD)
Forming a pennant / ascending triangle with strong resistance near $3,390 – 3,400.
Volume is declining, suggesting indecision.
RSI holding above 50 but not powering higher → momentum is slowing.
MACD flatlining, no fresh bullish impulse yet.
👉 Breakout above $3,400 needed for continuation. Breakdown below $3,340 risks correction.
Gold (XAU/USD) Targets $3,397 – $3,406 Amid Bullish MomentumAnalysis:
The 4H chart of Gold (XAU/USD) shows strong bullish momentum after a corrective phase. Price has broken above consolidation and is currently trading around $3,382, with upside targets at $3,397 and $3,406 (highlighted resistance zone).
The supply zone on the higher timeframe remains intact below $3,280, acting as a long-term support.
Immediate support levels lie at $3,371, $3,356, and $3,348. A break below these could shift momentum bearish.
Current bullish structure suggests that as long as price holds above $3,371, buyers may drive the price higher toward the resistance levels.
A rejection from $3,406 may lead to a pullback toward the mid-support zone before another attempt higher.

XAUUSD – Medium-Term Trading ScenarioXAUUSD – Medium-Term Trading Scenario
Hello traders,
Gold is moving into the final stage of its flag pattern. Medium-term traders are now waiting for a clear breakout confirmation, as that will set the direction for the next medium- to long-term opportunities. Once price confirms the break, the strategy is to enter immediately in the direction of the move.
Meanwhile, short-term and day traders continue to trade within the flag, looking for scalping opportunities.
From my perspective, the probability of gold breaking to the upside and continuing the main bullish trend is fairly high after such a long consolidation. To optimise entries, buying near the lower boundary of the trendline makes sense, with stop-losses placed immediately if the pattern breaks down. The key area to watch is Fibonacci retracement 0.5 at 3354, which acts as both dynamic and static support, as well as a strong Fibonacci level. This zone offers a reliable long-term buy opportunity.
Another potential early buy entry sits around 3372, where the previous candle showed strong bullish momentum. Positions here can be taken with tighter stops placed just below the nearest support.
This bullish scenario would only fail if price breaks below the lower trendline and closes firmly underneath it, which would confirm a reversal.
Wishing you success with this setup. If you share the same outlook, leave your thoughts in the comments so we can exchange ideas.

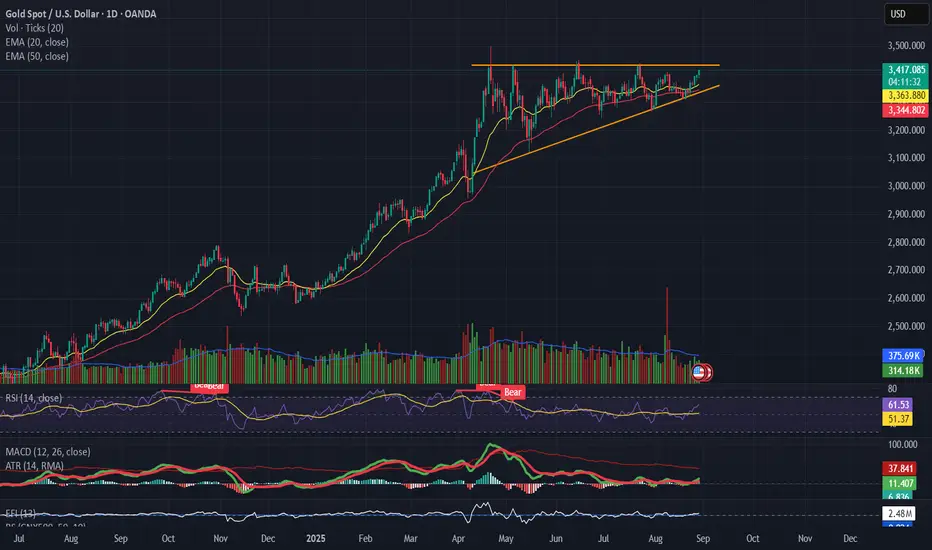
Gold about To Fly! ATH soon!Gold has been In Consolidation for past 5 Months.
4 occasions when it had settled near 3300.
It's about time for Gold to take Shorts For Cleaners?
This time around it's about to Settle near 3400.
3420 3440 will be Crucial for Bears to Defend if they wish to hold grip over this Consolidation.
Longs will get aggressive above 3440 3450 Targeting 3550 3750
😲
A prolonged consolidation could continue in case 3420 shows Profit Booking
For time Being 3375 3350 looks like providing support.
If it continues to Hold then it may build the Bull Case

buy idea Concept
Buying opportunities are most effective when price aligns with key trend, structure, and confirmation signals. A universal buy idea is not tied to a single indicator but built on core principles that apply across markets.

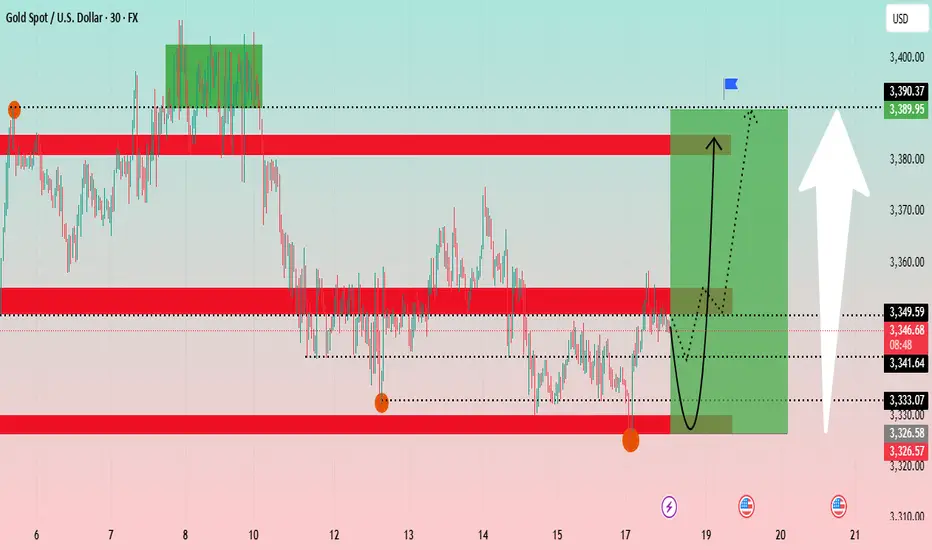
Gold Technical Analysis: Navigating Key Support ?The Gold chart shows a 30-minute timeframe analysis, highlighting recent price consolidation and potential future trends. The analysis suggests a potential V-shape recovery for gold.
Key Levels: The price is currently at a critical juncture, having tested a support zone around 3,326 - 3,333 USD. This zone has proven to be a strong base. Above it, a significant resistance zone is identified between 3,349 - 3,353 USD. Further up, another major resistance is at approximately 3,389 USD.
Price Action: The price has recently experienced a sharp decline and is now in a consolidation phase. The chart projects a potential bounce from the current levels, indicated by the black curved arrow, with the target being the upper resistance zone around 3,389 USD. The green shaded box illustrates the potential upward movement from the current position.
Conclusion: Gold appears to be at a key support level and could be poised for a rally if it successfully breaks above the immediate resistance zone.
Bitcoin (BTC/USDT) 4-Hour Chart Analysis
The Bitcoin chart shows a 4-hour timeframe analysis, focusing on a short-term uptrend channel.
Key Levels: The price is trading within an ascending channel. A significant support zone is identified between 112,000 - 114,000 USDT. A "weak supply zone" is marked around 118,000 USDT, which is currently acting as support. A major resistance is at approximately 124,564 USDT.
Price Action: After a strong push towards the channel's upper boundary, the price has pulled back and is now retesting the "weak supply zone." The blue and red arrows project two possible scenarios: a bounce back up towards the channel's high, or a deeper retracement towards the channel's lower trendline. The price movement appears to be following the blue projected path.
Indicators: The Ichimoku cloud and RSI strategy are used to confirm the trend and identify entry/exit points. The price is above the Ichimoku cloud, indicating a bullish trend.
Conclusion: Bitcoin is at a pivotal point within its uptrend channel. Its ability to hold the 118,000 USDT level will be crucial for a potential re-test of the 124,564 USDT resistance.
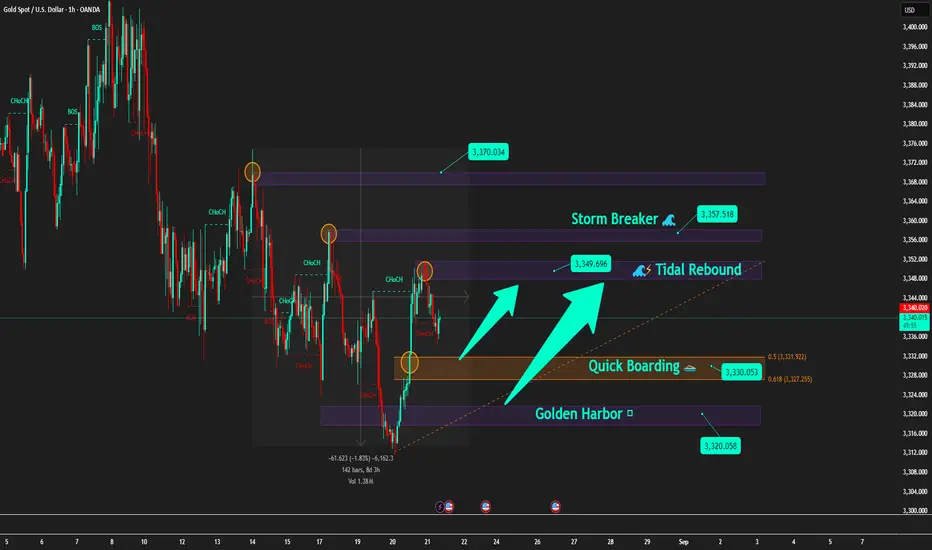
Gold after FOMC: Just a pullback or the start of a new wave?[Background
After the early morning FOMC session , Gold is showing signs of a sell-side pullback to gain momentum.
On higher timeframes (H4–D1), the structure remains bearish with lower highs .
However, consistent buying pressure around 3320 – 3330 keeps this zone as the key battlefield .
🪙 Key Levels Today
🔹 Storm Breaker 🌊 (Sell Zone 3357 – 3355)
SL: 3362
TP: 3350 → 3345 → 3340 → 33xx
🔹 Tidal Rebound 🌊⚡ (Sell Scalp 3349 – 3347)
SL: 3353
TP: 3345 → 3340 → 3335 → 33xx
🔹 Quick Boarding 🚤 (Buy Scalp 3330 – 3328)
SL: 3322
TP: 3335 → 3337 → 3339 → 3341
🔹 Golden Harbor 🏝️ (Buy Zone 3320)
SL: 3313
TP: 3325 → 3330 → extend further
📌 Trading Scenarios
After FOMC, the market may show rebound waves .
During Asia–Europe, price may consolidate between 3345 – 3357 .
If price tests Storm Breaker 🌊 → Prioritise Sell setups in line with the main bearish trend.
If price drops to Quick Boarding 🚤 or Golden Harbor 🏝️ → Short-term Buy scalps on pullback moves.
📰 Market Context
FED remains dovish leaning , with high probability of a rate cut in September (~82%, CME FedWatch) .
Geopolitical variables (Trump–Putin, Ukraine) remain unpredictable and may spark sudden volatility.
⚓ Captain’s Note
"Let Storm Breaker 🌊 test the buyers’ strength. Those who board at Golden Harbor 🏝️ will be lifted by the waves, but those who drift into the storm will soon feel the sea’s fury."
XAUUSD Bullish Breakout! Ready to Ride Gold’s Pre-FOMC Pump? XAUUSD Bullish Breakout! Ready to Ride Gold’s Pre-FOMC Pump? 🇮🇳
Subheader:
Gold surged past short-term resistances overnight – here’s a clear plan for Indian traders to scalp, swing, and ride the bullish momentum safely.
📊 Market Outlook – MMFLOW India Edition
Primary Bias: Bullish – Buy the dips
Key Observations:
Gold broke through the descending trendline and short-term resistance in a single session.
Early pre-FOMC breakout confirms strong bullish momentum.
Market cleared liquidity below and reclaimed higher zones – bullish case remains strong.
Scenarios:
🔹 Buy near strong support zones (dip-buying opportunities)
🔹 Tactical sells only at confirmed resistance with clear rejection
Technical Insight (Daily Chart):
Strong bullish confirmation candle – pullbacks are ideal reload points for long positions.
🔥 Trading Plan – Buy/Sell Zones & Scalp Strategy
✅ BUY SCALP
Entry: 3333 – 3331
Stop Loss: 3327
Take Profit: 3338 – 3343 – 3348 – 3352 – 3356 – 3360
✅ BUY ZONE (Swing / Positional Trades)
Entry: 3316 – 3314
Stop Loss: 3310
Take Profit: 3320 – 3325 – 3330 – 3335 – 3340 – 3350 – 3360
🔻 SELL ZONE (Tactical)
Entry: 3368 – 3370
Stop Loss: 3375
Take Profit: 3364 – 3360 – 3355 – 3350 – 3345 – 3340 – 3330
📌 Key Levels to Watch
Support Levels: 3332 – 3323 – 3315
Resistance Levels: 3348 – 3362 – 3370 – 3383
🚨 Risk Note for Indian Traders
If price dips deep into 331x, watch out for liquidity traps.
Always stick to TP/SL rules – volatility is high around FOMC events.
✨ MMFLOW Reminder
Key Levels = Profits
Buy the dips, ride the bullish momentum
💡 Pro Tips for TradingView India Users
Bookmark support & resistance zones
Observe liquidity sweeps before major news
Use scalp or swing strategies depending on your timeframe

XAUUSD | 21/08/2025 Technical AnalysisHello,
Gold is create Same HH and moving HL pattern on daily timeframe. Soon we can see it moving towards ATH. One retracement is pending then we can see start of new uptrend move.
Disclaimer: This is only for educational purpose.
Thanks

Gold Update – Asian Session Ahead of FOMCGold Update – Asian Session Ahead of FOMC
After yesterday’s sharp decline below 3312, gold found strong support and is now consolidating sideways, building liquidity for the next move. From the current outlook, a short-term rebound is likely before the broader downtrend continues.
Looking at structure, the descending channel remains intact with price respecting the trendline, and yesterday’s break out of the triangle formation reinforced the bearish bias.
From an Elliott Wave perspective, the market may now be forming wave 4. If this rebound carries price back towards the 3325–3330 zone, it will retest a strong resistance area that has repeatedly capped price before. Should that happen, wave 5 could begin — and by theory, it is often the strongest leg.
Fibonacci projections highlight the next support near 3295. If tonight’s FOMC meeting delivers a hawkish outcome in favour of the US dollar, gold could even extend lower towards 3280.
For short-term trading, buyers may consider positions near 3316 with a tight stop just below the recent low, aiming to capture the corrective move of wave 4. On the flip side, if price reacts around 3325–3330, this may provide an opportunity to sell into the expected wave 5, with potential targets extending 40–50 dollars lower if momentum strengthens.
A sustainable trend always alternates between retracements and impulses. Patience in waiting for the right wave often leads to more effective trades than rushing to pick tops or bottoms.
Do you think the FOMC this month will announce a positive interest rate outlook? Share your thoughts in the comments.
#XAUUSD #Gold #TechnicalAnalysis #PriceAction #Fibonacci #ElliottWave #MACD #ForexIndia #CommodityTrading #FOMC

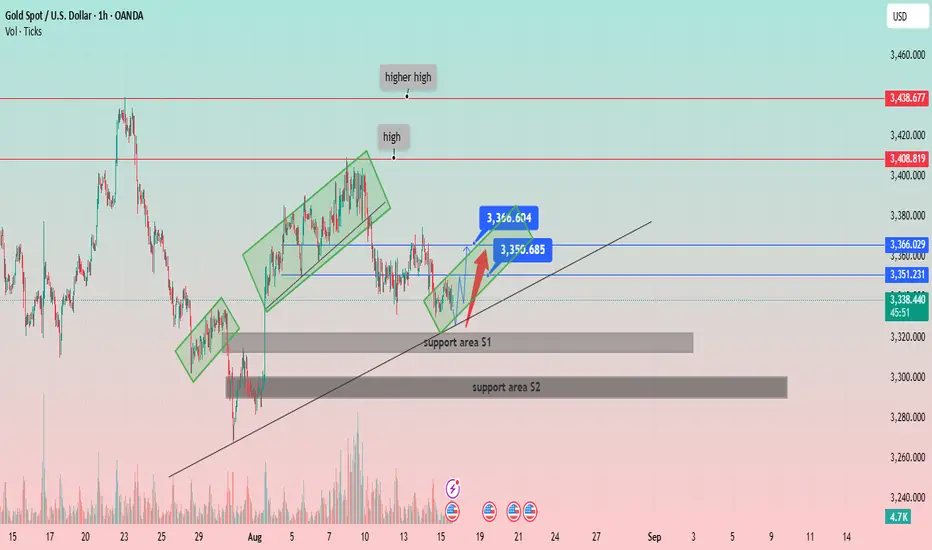
XAU/USD: Navigating the Uptrend and Key Support LevelsPrice Structure: Gold has been forming a series of higher highs and higher lows, indicative of a general uptrend. The chart labels a "high" and a "higher high," confirming this bullish structure.
Support and Resistance:
Two key support areas are identified:
Support area S1: A narrow zone around 3,320 USD. The price recently bounced off this area.
Support area S2: A broader, more significant zone around 3,290 USD, which appears to have been a strong support level in the past.
Several horizontal resistance levels are marked:
Immediate resistance: Around 3,351.231 USD and 3,366.029 USD.
Higher resistance: At 3,408.819 USD and 3,438.677 USD.
Channels and Trendlines:
The price has been moving within a series of ascending channels (highlighted in green rectangles), suggesting a stair-step upward movement.
A primary ascending trendline (black line) serves as a long-term support, with the price currently hovering just above it.
Recent Price Action and Projections:
The price recently broke out of a small downtrend and is showing signs of recovery from the "support area S1."
A potential price path is drawn with a red arrow, indicating a possible move towards the immediate resistance levels around 3,351 USD and 3,366 USD.
The chart highlights two specific price points, 3,360.604 USD and 3,350.685 USD, which likely represent a short-term trading range or target.
Volume: The volume spikes visible at key price points (e.g., at the low on July 30 and during the recent drop) indicate strong market activity.
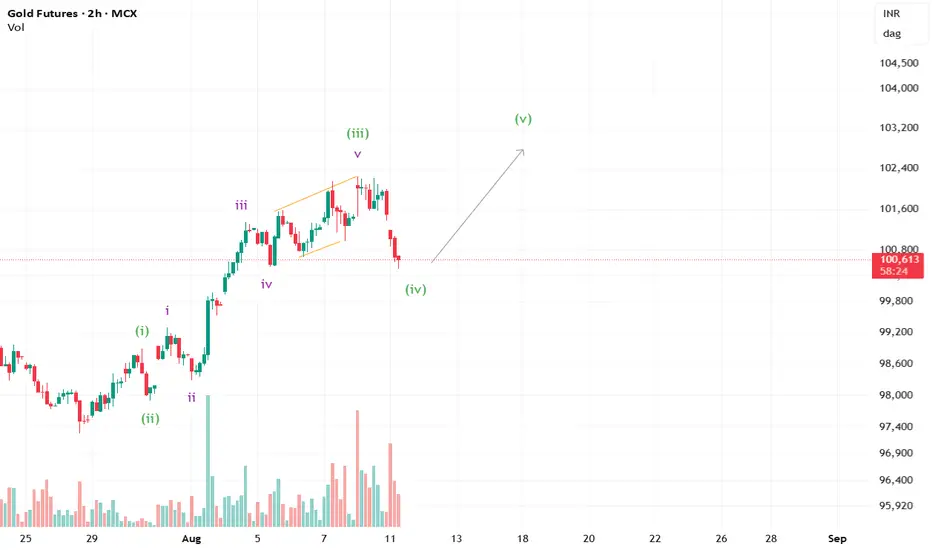
Bullish signs for Gold?Gold seems to have made a good corrective move for wave iv. We may see a new high in the coming sessions.
XAU/USD Bullish Bounce from Demand Zone !Gold (XAU/USD) on the 4H chart is showing a potential bullish reversal setup. Price has pulled back into a Fair Value Gap (FVG) and high supply/demand zone near 3,329–3,315, aligning with the 0.382–0.5 Fibonacci retracement.
Key Points:
Support Zone: 3,329–3,315 (demand + FVG).
Bullish Rejection Expected: Price may bounce from this zone, targeting upper resistance levels.
Upside Targets:
TP1: 3,356
TP2: 3,375
TP3: 3,440–3,459 (major resistance)
Invalidation: A daily close below 3,315 could open room for deeper downside toward 3,278–3,245.
Indicators: EMA(9) and Ichimoku showing potential for trend resumption if price closes above 3,362.
Overall, the chart suggests a buy setup on bullish confirmation, aiming for the 3,375–3,459 zone.

"Gold at the Tipping Point: Will $3,350 Spark the Next Rally?""Gold at the Tipping Point: Will $3,350 Spark the Next Rally?"
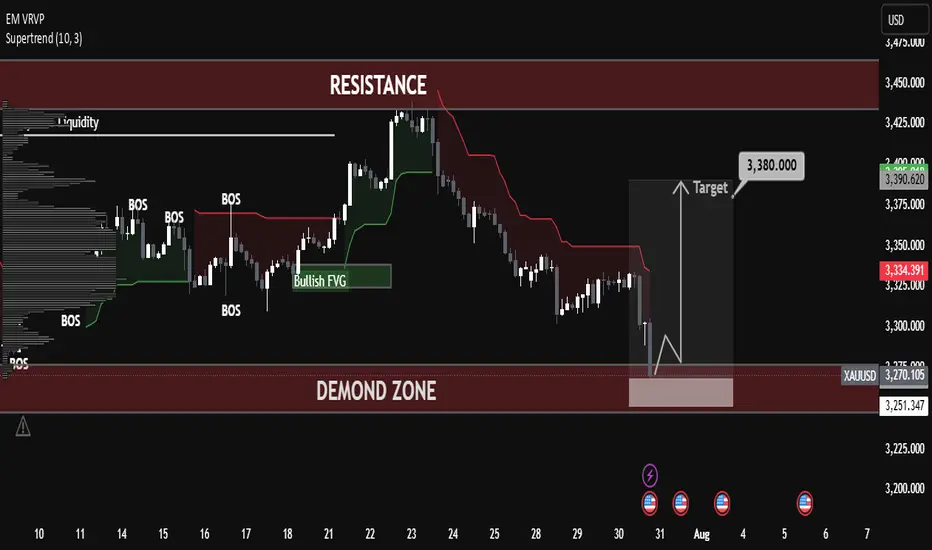
Gold (XAUUSD) is currently consolidating after a series of higher lows, signaling sustained bullish momentum from the strong support region around $3,280–$3,300. Price has respected key structural points, forming a clean market structure with:
BOS (Break of Structure) confirming bullish intent after reclaiming prior resistance.
Bullish FVG (Fair Value Gap) acting as a liquidity zone for potential re-entries.
Multiple Higher Lows, highlighting strong buyer defense levels.
The chart indicates a possible short-term retracement into the $3,350–$3,357 entry zone, which aligns with demand structure. From this zone, buyers are expected to push toward the $3,400–$3,415 resistance target.
Key technical levels:
Entry Zone: $3,350–$3,357 (demand area)
Stop Loss: Below $3,340 to protect against deeper pullbacks
Take Profit: $3,400 psychological level and $3,414 structural resistance
Market Sentiment:
The combination of a strong support base, sustained higher lows, and bullish imbalance zones suggests a favorable risk–reward setup for long positions. A clean breakout above $3,415 could trigger a larger bullish leg toward the $3,440 resistance zone.
📈 Bias: Bullish above $3,350
💡 Watch for a reaction at the entry zone before committing to positions.

Part9 Trading MasterclassRisk Management in Strategies
Never sell naked calls unless fully hedged.
Position size to avoid overexposure.
Use stop-loss or delta hedging.
Monitor implied volatility — don’t sell cheap, don’t buy expensive.
Strategy Selection Framework
Market View: Bullish, Bearish, Neutral, Volatile?
Volatility Level: High IV (sell premium), Low IV (buy premium).
Capital & Risk Tolerance: Large capital allows complex spreads.
Time Frame: Short-term events vs. long-term trends.
Common Mistakes to Avoid
Trading without an exit plan.
Ignoring liquidity (wide bid-ask spreads hurt).
Selling options without understanding margin.
Overtrading during high emotions.
Not adjusting when market changes.

XAUUSD | Technical Analysis for 06/08/2025Hi,
A short upside move is expected till 3380. It is taking rejection from 0.75 level of last swing.
Disclaimer: This is only for educational purpose.
Thanks

XAUUSD | Technical Analysis for 08/05/2025Hi,
I am seeing a bounce up side in gold till 3365 to 3372. Corrective wave can start from here.
Disclaimer: This is only for educational purpose.
Thanks

Gold Took Support – Now Bulls Are in Control! Gold Took Support – Now Bulls Are in Control!
Gold (XAUUSD) price has taken a strong bounce from the support zone, and now it’s looking bullish. Market reacted nicely from the demand zone, which means buyers are stepping in again.
📊 Technical Analysis:
✅ Strong Support Zone (3260–3280):
This area is acting like a strong base. Price touched here and immediately bounced — showing buying pressure.
🔄 Break of Structure (BOS):
Market broke the previous structure and gave signs of trend reversal. It also grabbed liquidity from the lows.
🟩 Bullish Fair Value Gap (FVG):
A clean FVG was formed and respected, which shows institutional activity and buying interest.
🎯 Target Level – 3366.984 USD:
If bullish momentum continues, gold can easily move towards this level. It’s also near a previous resistance.
📚 Educational Points:
Market took liquidity from the lows and reversed
Fair Value Gap is respected, adding confirmation
Structure break confirms buyers are in control
Price is heading towards the next resistance zone
📌 Conclusion:
Gold is now in a bullish phase. As long as the support zone is holding, buyers can stay confident. Target remains near 3366–3380 USD. Any pullback can give a good buy opportunity.
XAU/USD 1H – Range Consolidation Below Ichimoku Cloud. Chart Review & Technical Insight
1. Ichimoku Cloud & Overall Structure
Price is below the Ichimoku Cloud, with the cloud ahead sloping downward—indicative of bearish short‑term momentum and resistance overhead as long as the cloud holds above price.
The Kijun-sen (blue) line is above the Tenkan-sen (red), reinforcing the bearish bias on this timeframe.
2. Price Action & Key Zones
A support zone around 3,327–3,330 USD/oz is visible, underpinned by multiple rejection taps and price consolidation (“$$$” zone). A clean break below could open the path toward the 3,320’s or lower imbalance region.
On the upside, resistance lies near 3,339–3,340, backed by the cloud’s lower boundary and the Kijun-sen level.
The highlighted green rectangle appears to signal a potential bullish breakout target zone toward 3,365–3,392, contingent on recovery above the cloud.
3. Momentum & Trade Considerations
Momentum is weak, with price moving sideways inside a low‑volatility rectangle on diminishing volume and few directional impulses.
Possible ABC corrective structure is forming as marked, suggesting price may oscillate sideways or continue correcting within established bounds.
A bullish scenario would require clearing the Ichimoku Cloud and resistance at 3,340–3,360 USD.
Conversely, a bearish breakdown below ~3,327 could confirm continuation deeper into the 3,320s or toward the next significant demand zone near 3,300 USD.
✅ Summary
Bias: Slightly bearish to neutral until price can clear the Ichimoku Cloud.
Key Levels to Watch:
Support: 3,327–3,330 (immediate), then 3,320–3,300.
Resistance: 3,339–3,365, cloud top near 3,365, further target zone 3,392.
Scenarios:
Bullish breakout: Close above cloud → potential rally toward 3,365–3,392.
Bearish breakdown: Close below 3,327 → deeper correction toward 3,320 and lower imbalance areas.

POSITIVE Vision!IF Prices stands over 3406! We can expect a bullish months ahead.
Else in a big TF we are in super over bought conditions. We can see a big free fall at any times. Happy Monday folks!

Critical Breakdown: BTC/USD Poised to Fall — Waiting on H4 CloseAnalysis of the BTC/USD 4‑Hour Chart
From the chart you provided, here's how the technical situation looks:
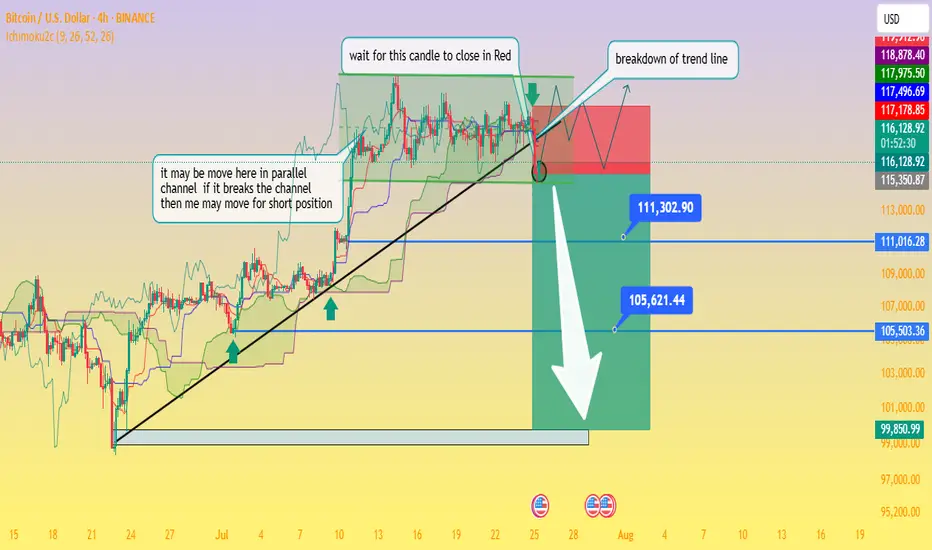
Ascending trendline support has been tested multiple times and was recently breached this afternoon, signaling a possible shift from the bullish setup to a bearish continuation.
The price is now trapped within a descending triangle formation beneath a well‑defined swing high resistance zone. This reflects indecision in the market, with neither buyers nor sellers in clear control
Business Insider
+15
Fxglory Ltd
+15
Bitcoin News
+15
.
Key levels to monitor:
Support zone: ~$115,500, extending down to ~$111,300 and ~$105,600 as deeper targets if bearish momentum strengthens.
Resistance zone: ~$119,000–120,000 area, forming strong overhead supply
Economies.com
DailyForex
Bitcoin News
.
The chart’s annotations align with a classic breakout strategy—with the caveat: wait for a confirmed close below the trendline before considering short positions (as noted in your “wait for this candle to close in red” comment).
Breakout confirmation would likely pave the way toward your indicated profit zones near ~$111k and ~$105k, with a larger potential down to ~$99.8k if further downside pressure builds.
🔍 What the Broader Market Signals
Technical sentiment from sources covering today’s analysis shows BTC/USD hovering just under $120,000, stuck within the defined range of $115.5k support to $120k resistance
Economies.com
.
While there’s still neutral momentum in indicators like RSI and MACD, the short-term direction leans bearish if the breakdown is confirmed on the H4 timeframe
Fxglory Ltd
.
Analysts emphasize that sustained movement above $116.5k could retarget resistance near $119–120k. A failure there and a move below $115.5k may thrust price deeper toward your downside zones
DailyForex
.
✅ Trading Strategy Overview
Scenario Trigger Target Levels
Bearish Breakdown H4 candle closes below trendline ~$115.5k $111.3k → $105.6k → possible $99.8k zone
Bullish Rejection Bounce back above ~$116.5k and trending above resistance $119k–120k retest, potential breakout if sustained
Neutral / Wait-and-see No decisive candle close yet Hold for confirmation
⛳ Final Thoughts
chart highlights a critical point: don’t act prematurely. Wait for a decisive H4 candle close below the trendline before committing to shorts. Confirmed bearish action around the breakout could open the path to the lower targets you identified. However, if price rebounds above support and climbs above $116.5k, a short-term retest of $119k–120k is still in range.
Traders should maintain prudent risk management—watching the unfolding price action around these pivot points without overreaching. Let me know if you'd like help crafting entry/exit zones or risk profiles for this setup!
GOLD - PULLBACKS LIKELY BEFORE CONTINUED UPSIDE - UPTREND INTACTSymbol - XAUUSD
CMP - 3369.50
Gold has been advancing steadily since the start of the trading session, moving toward the 3374 area of interest. Following a breakout above prior consolidation resistance, the metal may now be poised to retest this breakout level before continuing its upward trajectory.
The current rally is supported by heightened trade related risks and a softening US dollar. After briefly declining to 3310, gold resumed its upward momentum, with a key objective at the 3368 resistance level. The recovery is underpinned by ongoing uncertainty surrounding Trump’s trade policy, market anticipation ahead of Powell’s upcoming speech, and broader geopolitical tensions - including trade disputes with the EU, political instability in Japan, and recent criticism of the Federal Reserve from the White House. These factors have prompted a temporary flight to safety, benefiting gold.
From a technical perspective, gold is in a post-breakout realization phase following the consolidation breakout. However, resistance at 3368 has capped further gains for now, and a near-term pullback remains possible. The 3350–3355 support zone is currently in focus. Sustained bullish control above this level could reignite upward momentum and reestablish the breakout continuation.
Key Resistance Levels: 3368, 3374
Key Support Levels: 3345, 3332
The broader market bias remains bullish, bolstered by dollar weakness and persistent risk aversion. Market participants are closely monitoring developments involving Trump and remarks from Powell. Should Powell signal a dovish shift - such as a potential rate cut announcement (e.g. during tomorrow’s 12:30 GMT statement) - gold may extend its gains.
