XAUUSD (Gold) TECHNICAL OUTLOOK | 6th Jan'2026Gold is trading near 4,450, consolidating after a strong bullish rally. Price remains well above key moving averages, keeping the overall trend firmly bullish across intraday to higher timeframes.
Bullish View:
As long as gold holds above 4,445–4,450, upside momentum remains intact. A move above 4,470 can push prices toward 4,490 and 4,505–4,515, with 4,550 as a major resistance zone.
Bearish View:
A break below 4,445 may trigger a short-term pullback toward 4,430 and 4,410–4,395. Unless these levels break decisively, dips are likely corrective.
Intraday Focus:
Prefer buy-on-dips near support, while watching 4,500–4,515 for possible rejection.
Conclusion:
Trend remains strongly bullish. Expect volatility, but bias favors buyers unless key supports fail.
Goldlongsetup

XAUUSD – Clean Rejection from LTF Demand With Potential Upside EGold tapped into a refined LTF demand pocket and instantly showed rejection, indicating buyers are stepping in exactly where they should. This aligns well with the ongoing HTF bullish bias and maintains the broader structure intact.
The strong wick + immediate reclaim of the micro-range suggests absorption and willingness to push higher if structure follows through.
Bullish Path:
• Tap into LTF demand
• Rejection + recovery inside the zone
• Micro structure shift
• Expansion toward the next HTF imbalance

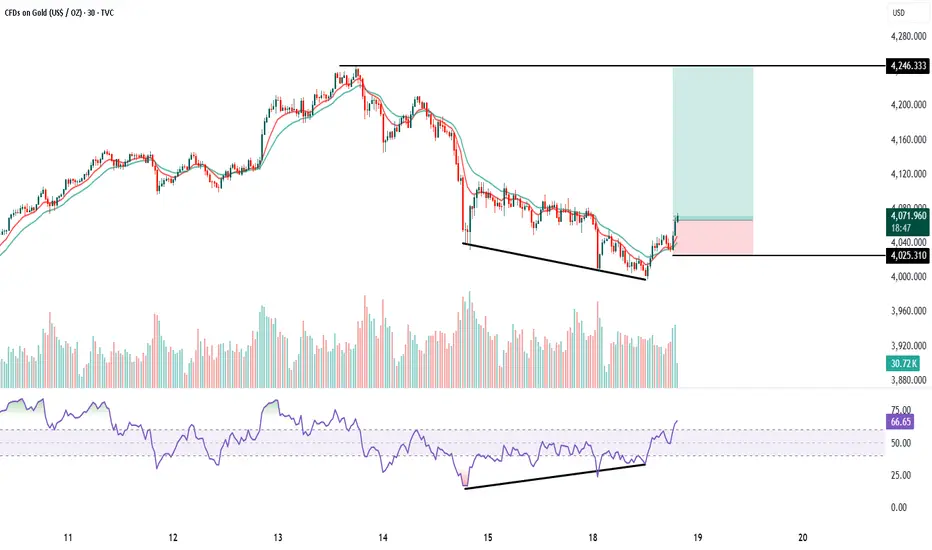
GOLD 30 Min chart analysis1. Trend : Price was in a downtrend with continuous lower highs and lower lows. Now the chart is showing a falling wedge pattern, which is a bullish reversal pattern. Breakout candle is visible with strength, indicating trend reversal from bearish to bullish on the 30-minute timeframe.
2. Volumes: Volumes remained average during the fall.
At the breakout zone, you can see volume expansion, which confirms buyers are stepping in.
This supports a valid bullish breakout.
3. Momentum (Price Action + EMAs): Price is crossing above the 10 EMA and 20 EMA, and both EMAs are starting to turn upward. This shows momentum shift from sellers to buyers. Momentum candles at breakout confirm the start of an upward move.
4. RSI Divergence: Price made lower lows, but RSI made higher lows.
This is a classic bullish divergence, indicating selling pressure is weakening. RSI has now moved above 60, confirming momentum is picking up strongly.
Buy above 4075 after the breakout candle closes above falling wedge.
This ensures confirmation and avoids a false breakout.
Keep SL just below wedge support: SL = 4025
Target : The major horizontal resistance shown on the chart is:
Target = 4246 This is also the measured move of the wedge, matching the resistance zone.
Risk–Reward: RR is approximately 1:3 to 1:3.5, which is ideal for breakout trades. This is a high-probability trend-reversal breakout setup with a clear target and safe stop loss.
GOLD SHOWING A GOOD UP MOVE WITH 1:10 RISK REWARD GOLD SHOWING A GOOD UP MOVE WITH 1:10 RISK REWARD
DUE TO THESE REASON
A. its following a rectangle pattern that stocked the market
which preventing the market to move any one direction now it trying to break the strong resistant lable
B. after the break of this rectangle it will boost the market potential for break
C. also its resisting from a strong neckline the neckline also got weeker ald the price is ready to break in the outer region
all of these reason are indicating the same thing its ready for breakout BREAKOUT trading are follws good risk reward
please dont use more than one percentage of your capitalfollow risk reward and tradeing rules
that will help you to to become a bettertrader
thank you

Gold (XAU/USD) Breakout Rally Toward New HighsAnalysis:
Gold (XAU/USD) continues its strong bullish momentum on the 4-hour chart, forming a series of higher highs and higher lows, confirming a sustained uptrend. The recent breakout above the resistance zone near $4,150–$4,170 indicates renewed buying interest and momentum buildup.
After a brief retest of the breakout area, price has started climbing again — a sign of trend continuation supported by bullish candle formations and strong market sentiment.
Technical Outlook:
Support Zone: $4,140 – $4,170 (previous resistance turned support)
Bullish Confirmation: Continuation pattern with clean structure and volume support
Momentum Bias: Strongly bullish while above $4,150
🎯 Target: $4,300 – $4,320 zone
🛑 Stop Loss: Below $4,140 to limit downside risk
📈 Summary:
As long as gold stays above the breakout level of $4,170, the market remains bullish, with upside potential toward $4,300–$4,320, aligning with the next major resistance area.

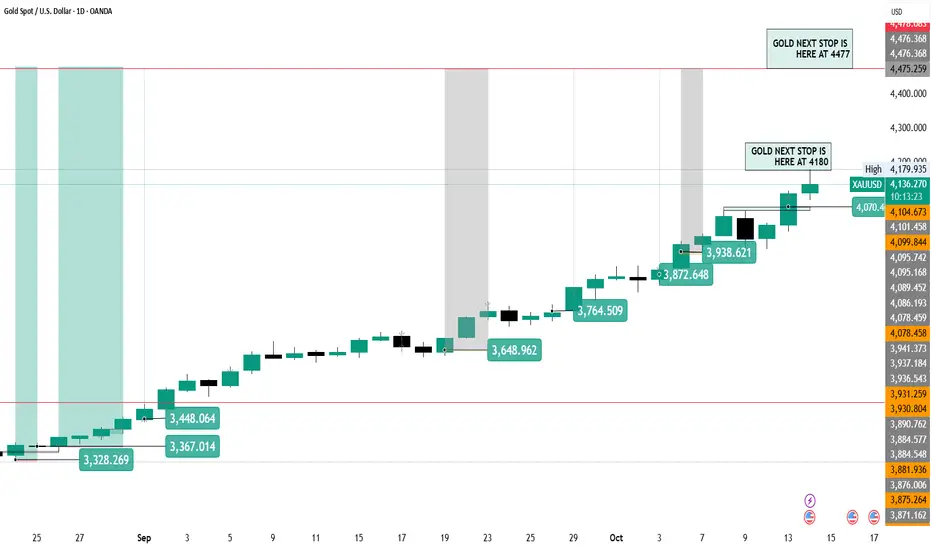
This is my next #gold tp in next 2-3 week and hight will be 4477This is my next #gold tp in next 2-3 week and hight will be 4477This is my next #gold tp in next 2-3 week and hight will be 4477This is my next #gold tp in next 2-3 week and hight will be 4477This is my next #gold tp in next 2-3 week and hight will be 4477This is my next #gold tp in next 2-3 week and hight will be 4477This is my next #gold tp in next 2-3 week and hight will be 4477This is my next #gold tp in next 2-3 week and hight will be 4477
GOLD (XAUUSD) 1H CHART ANALYSIS – BEARISH SETUP AHEADGOLD (XAUUSD) 1H CHART ANALYSIS – BEARISH SETUP AHEAD
🔍 Technical Overview
Current Price: Around $4,036 – $4,040
Trendline: A key uptrend line (blue) has been broken, signaling weakening bullish momentum.
Resistance Zone: Between $4,058 – $4,062, marked by red arrows 🚫
Support Zone: Near $3,930 – $3,940, highlighted by the purple box 🟪
📊 Market Structure
The market recently made a lower high formation after failing to break above $4,062, indicating bearish divergence.
Multiple rejection candles at the resistance zone confirm selling pressure 💣.
The blue projection lines suggest a potential bearish retracement back toward the support zone around $3,930.
🧭 Key Levels
Type Price Level Notes
🔺 Resistance 4,058 – 4,062 Double top zone, strong sellers present
⚖️ Mid-Level 4,000 Psychological round number, interim support
🟣 Support 3,930 – 3,940 Major buying interest, possible reversal zone
📉 Expected Price Action
🔻 Scenario 1 (Primary):
Price may retest $4,050 – $4,060 resistance area, form another rejection, and drop toward $3,940 support.
Potential short entry near $4,050 – $4,060
Target $3,940
Stop loss above $4,070
🔄 Scenario 2 (Alternative):
If the price holds above $4,060, a breakout could trigger a bullish continuation toward $4,100+.
🧠 Trader’s Insight
⚠️ Bearish bias remains valid while below $4,060.
🕒 Watch for price reaction around the trendline retest and confirmation candles (bearish engulfing or pin bars).
📈 Smart traders might wait for confirmation below $4,000 before adding short positions.
💬 Summary
➡️ Bias: Bearish below $4,060
➡️ Target: $3,940
➡️ Invalidation: Break and close above $4,070
📍 “Trendlines break fast, but support zones hold stronger — trade smart, not fast.”

Gold Trade Plan - Nov ExpirtyMCX:GOLDM1! Might give entry once again. Booked more than 10R in last trade. Let's see how it goes.

Trading Analysis for Gold Spot / U.S. Dollar (15-Minute Chart)Buy XAU/USD now at 3644.00 level and hold at 3631.00 and target will be specific.
Entry Range 3642.00 to 3644.00
Take Profit 1 = 3646.00
Take Profit 2 = 3650.00
Take Profit 3 = 3654.00
Take Profit 4 = 3658.00
Stock Loss 3631.00
Key News Timings Chart Per.
i will try to update continue.

GOLD SHOWING A GOOD UP MOVE WITH 1:10 RISK REWARD GOLD SHOWING A GOOD UP MOVE WITH 1:10 RISK REWARD
DUE TO THESE REASON
A. its following a rectangle pattern that stocked the market
which preventing the market to move any one direction now it trying to break the strong resistant lable
B. after the break of this rectangle it will boost the market potential for break
C. also its resisting from a strong neckline the neckline also got weeker ald the price is ready to break in the outer region
all of these reason are indicating the same thing its ready for breakout BREAKOUT trading are follws good risk reward
please dont use more than one percentage of your capitalfollow risk reward and tradeing rules
that will help you to to become a bettertrader
thank you

Trading Analysis for Gold Spot / U.S. Dollar (15-Minute Chart)Sorry I am late in giving the signal but I will say that manipulation in XAU/USD is at extreme level. Keep portfolio at least $1000.
Take buy position in XAU/USD as much as possible.
Not more than $3630.00.
Target 1 3353.00
Target 2 3358.00
Target 3 3365.00
Target 4 3372.00
SL 3630.00
Based on the provided 15-minute chart for Gold Spot / U.S. Dollar (XAU/USD), published by NaviPips on TradingView.com on June 30, 2025, at 17:53 UTC, here’s a suggested trading setup for a buy position:
Current Price and Trend: The current price is 3,241.875, with a slight increase of +0.250 (+0.01%). The chart shows a recent downtrend that appears to be stabilizing near the current level, suggesting a potential reversal point.
Buy Entry: Enter a buy position at 3,312.875 (current price), as it aligns with a support zone where the price has found a base, indicated by the horizontal dashed line and recent consolidation.
Stop Loss: Place a stop loss at 3,295.250, below the recent low, to protect against further downside. This level is approximately 10.625 points below the entry, defining the risk.
Take Profit Levels:
Take Profit 1: 3,317.875, a conservative target about 20.000 points above the entry, aligning with a minor resistance zone.
Take Profit 2: 3,324.750, a mid-range target approximately 31.875 points above the entry.
Take Profit 3: 3,332.500, a deeper target about 45.625 points above the entry, indicating a potential trend reversal.
Price Action: The chart indicates a downtrend with a possible bottoming pattern near the current level. The support zone and upward candlestick suggest a buy opportunity if the price holds.
Risk-Reward Ratio: The distance to the stop loss (10.625 points) compared to the take profit levels (20.000 to 45.625 points) offers a favorable risk-reward ratio, ranging from approximately 1:1.9 to 1:4.3.
Conclusion
Enter a buy at 3,241.875, with a stop loss at 3,295.250 and take profit levels at 3,317.875, 3,324.750, and 3,332.500. Monitor the price action for confirmation of an upward move, and be cautious of a potential continued downtrend if the price breaks below the stop loss level. (Note: I assume "take profot" was a typo for "take profit" and have corrected it accordingly.)

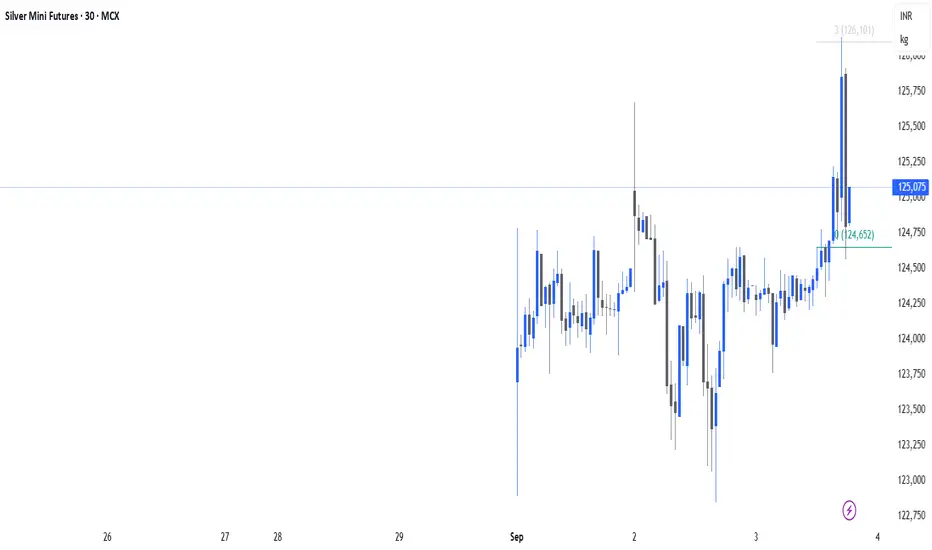
$MCX:GOLDTENU2025 – Back in the GamePrevious trade closed at a stellar 29R.
Now re-entered MCX:GOLDTENU2025 with fresh momentum.
Risk controlled, structure intact.
No predictions, just rule following.
Stops in place, trend will decide.
Let’s see how this one unfolds.
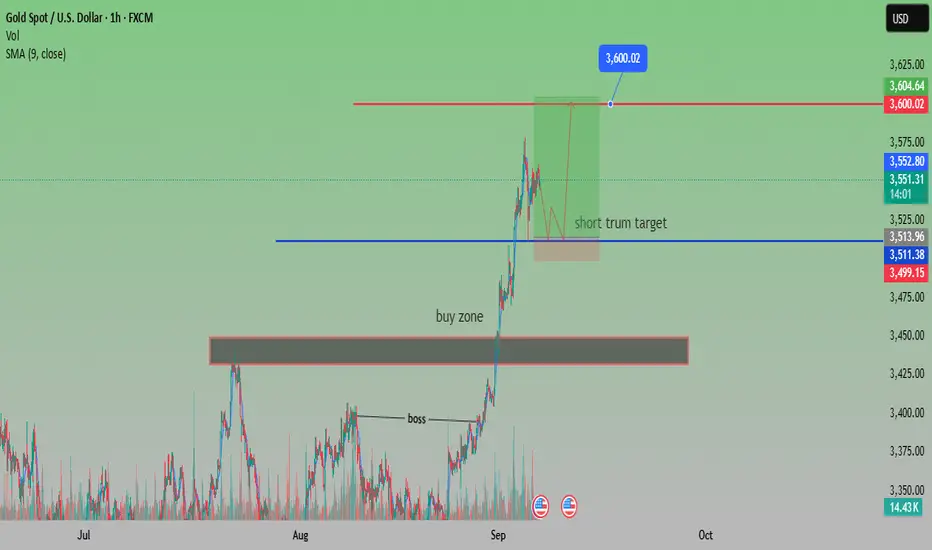
Gold Targets $3,600 After Strong BreakoutAnalysis:
Gold (XAU/USD) continues its bullish rally after breaking above the buy zone near $3,440 and holding strong momentum. The market has recently made higher highs, with price consolidating slightly below the resistance zone.
Currently, gold is trading at $3,548, with the short-term target identified at $3,600. The chart suggests potential consolidation in the highlighted area before another upward push. The SMA (9) at $3,552 is acting as dynamic support, keeping the bullish bias intact.
If buyers maintain control, a clear breakout above $3,552 – $3,560 could confirm a move toward $3,600 – $3,604. However, if momentum weakens, support lies at $3,511 and $3,499, with a deeper pullback possible toward the $3,440 buy zone.
Overall, the sentiment remains bullish, and gold looks positioned to test the $3,600 psychological resistance in the near term.
Gold on Fire – Will XAUUSD Keep Breaking Higher?Gold (XAUUSD) is showing unstoppable momentum this month. With the US Dollar Index (DXY) weakening and markets expecting the Federal Reserve to cut interest rates, investor sentiment is shifting away from holding cash. For Indian traders, this means one thing: Gold is the ultimate safe-haven play right now.
🔎 Macro View
FED rate cut expectations → Pressure on USD → Bullish for Gold.
Risk sentiment: Investors worldwide are running to gold for safety.
With strong global inflows, gold could continue to make new all-time highs (ATHs) in the coming months.
📊 Technical Outlook (H1/H4)
Gold has been forming sideway accumulation zones followed by strong breakouts. This shows volume and market flow still favor bulls.
BUY ZONE:
3482 – 3480
SL: 3474
TP: 3486 – 3490 – 3495 – 3500 – 3505 – 3510 – 3520 – 3530 – 3540 – ???
SELL ZONE (only for short-term counter-trade):
3540 – 3542
SL: 3548
TP: 3530 – 3520 – 3510 – 3500 – ???
At the moment, there are no strong signals for selling. Trend bias = BUY on dips until we see sentiment reversal.
⚠️ Risk Note
The market is highly volatile right now with sudden liquidity sweeps. Always stick to TP/SL discipline to protect your account.
💡 Conclusion:
Gold remains in a powerful bullish trend, supported by both macro and technical factors. For Indian traders, the best strategy is to stay aligned with the bulls — buy dips and ride the wave.
✅ Follow MMFLOW TRADING for daily market plans and gold insights. Let’s capture this historic rally together!

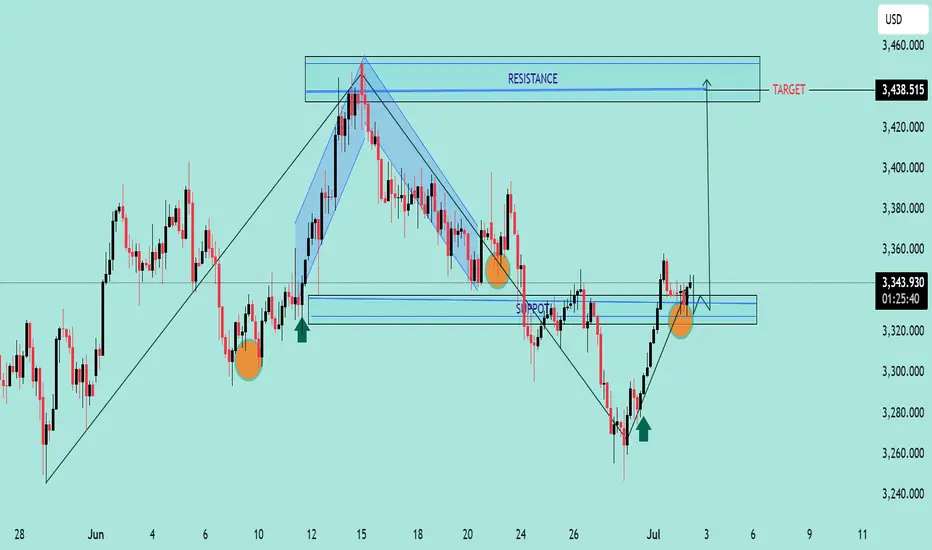
GOLD/USD Bullish Reversal and Breakout Target GOLD/USD Bullish Reversal and Breakout Target 🎯 ✨📈
🔍 Technical Analysis Overview:
The chart illustrates a clear bullish reversal pattern following a strong downtrend, with price reacting from a key support zone (highlighted in blue).
Multiple bullish rejection wicks and confirmation candles (green arrows) indicate buying interest at this support.
The recent higher low formation confirms shift in market structure towards bullish bias.
📌 Key Zones:
🟦 Support Zone: Around 3,280 – 3,320 USD
Price respected this zone multiple times (marked with orange circles), confirming its strength.
🟥 Resistance Zone / Target: 3,430 – 3,460 USD
This area aligns with previous swing highs and is the projected target for this bullish move.
📈 Chart Structure:
Break of descending trendline and bullish momentum above support suggests potential continuation towards the marked target.
Falling wedge breakout also aligns with reversal logic.
🎯 Price Target:
3,438.515 USD (resistance area), as labeled on chart with arrow and breakout projection.
🛑 Invalidation Level:
A sustained break below the support zone (3,280 USD) would invalidate this bullish outlook.
📌 Conclusion:
Gold is exhibiting strong bullish behavior with confirmation from price action and structure break. As long as price sustains above support, the path toward 3,438 remains
Trading Analysis for Gold Spot / U.S. Dollar (15-Minute Chart)Based on the provided 15-minute chart for Gold Spot / U.S. Dollar (XAU/USD), published by NaviPips on TradingView.com on June 25, 2025, at 12:28 UTC, here’s a suggested trading setup for a sell position:
Current Price and Trend: The current price is 3,331.315, with a slight decline of -1.390 (-0.04%). The chart shows a recent downtrend with a potential resistance zone near the current price.
Sell Entry Options:
1st Entry: Enter a sell position at 3,355.490, aligning with the upper resistance level marked, where the price may face rejection.
2nd Entry: Enter a sell position at 3,344.221, a secondary resistance level if the price retraces slightly.
Stop Loss: Place a stop loss at 3,357.831, above the recent high, to protect against an upward breakout. This level is approximately 2.341 points above the 1st entry and 13.610 points above the 2nd entry, defining the risk.
Take Profit Levels:
Take Profit 1: 3,325.242, a conservative target about 30.248 points below the 1st entry and 18.979 points below the 2nd entry.
Take Profit 2: 3,316.079, a mid-range target approximately 39.411 points below the 1st entry and 28.142 points below the 2nd entry.
Take Profit 3: 3,304.625, a deeper target about 50.865 points below the 1st entry and 39.596 points below the 2nd entry.
Take Profit 4: 3,286.474, the furthest target, approximately 69.016 points below the 1st entry and 57.747 points below the 2nd entry.
Price Action: The chart indicates a downtrend with a recent bounce that may be exhausting near the 1st and 2nd entry levels. The 1:2 risk-reward ratio zone suggests a potential reversal point.
Risk-Reward Ratio: .
For the 1st entry (3,355.490), the stop loss to Take Profit 4 distance (69.016 points) offers a 1:2 risk-reward ratio with Take Profit 2 (39.411 points).
For the 2nd entry (3,344.221), the stop loss to Take Profit 4 distance (57.747 points) also aligns with a favorable risk-reward profile.
Conclusion
Option 1: Sell at 3,355.490 with a stop loss at 3,357.831 and take profit levels at 3,325.242, 3,316.079, 3,304.625, and 3,286.474.
Option 2: Sell at 3,344.221 with a stop loss at 3,357.831 and the same take profit levels. Monitor the price action for confirmation of a reversal at the entry levels, and be cautious of potential bullish momentum if the price breaks above the stop loss.

Trading Analysis for Gold Spot / U.S. Dollar (15-Minute Chart)Based on the provided 15-minute chart for Gold Spot / U.S. Dollar (XAU/USD), published by NaviPips on TradingView.com on June 25, 2025, at 03:52 UTC, here’s a suggested trading setup for a sell position:
Current Price and Trend: The current price is 3,322.840, with a slight decline of -0.190 (-0.01%). The chart shows a recent downtrend with a potential resistance level near the current price.
Sell Entry: Enter a sell position at 3,323.400 (near the current price and entry level marked), as it aligns with a resistance zone where the price has struggled to break higher.
Stop Loss: Place a stop loss at 3,357.864, above the recent high, to protect against an upward breakout. This level is approximately 34.464 points above the entry, defining the risk.
Take Profit Levels:
Take Profit: 3,286.372, a target about 37.028 points below the entry, aligning with a support zone and offering a 1:1 risk-reward ratio as indicated on the chart.
Price Action: The chart indicates a downtrend with a recent bounce that may be exhausting near the current level. The horizontal dashed line suggests a resistance area, supporting a sell setup.
Risk-Reward Ratio: The distance to the stop loss (34.464 points) compared to the take profit (37.028 points) provides a balanced 1:1 risk-reward ratio, making this a reasonable short-term trade.
Conclusion
Enter a sell at 3,323.400, with a stop loss at 3,357.864 and a take profit at 3,286.372. Monitor the price action for confirmation of a continued downtrend, and be cautious of potential reversals if the price breaks above the stop loss level.

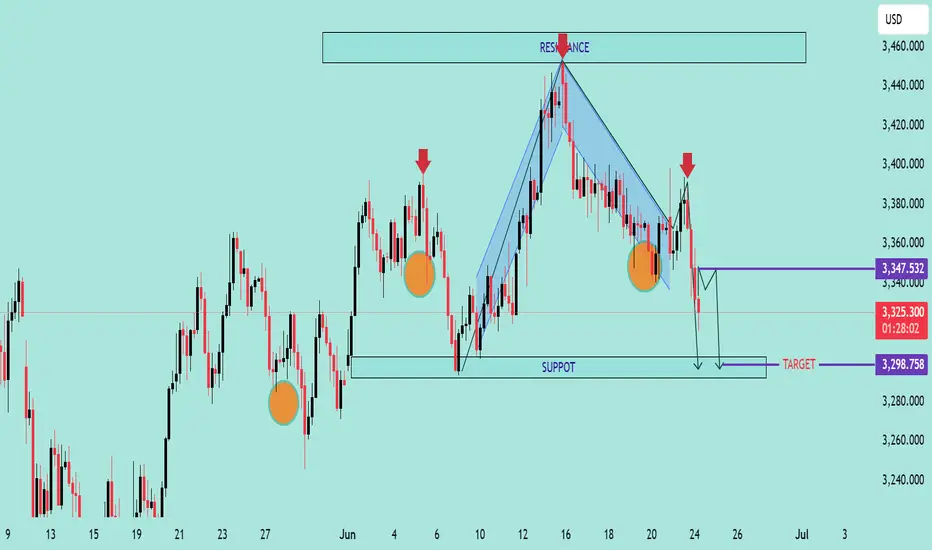
Bearish Continuation Pattern Detected on GOLD/USD Bearish Continuation Pattern Detected on GOLD/USD 📉
📊 Chart Analysis Summary:
The GOLD/USD chart shows a clear bearish continuation pattern, following a rejection from a major resistance zone.
🔍 Key Technical Highlights:
🔺 Resistance Zone:
Strong resistance at 3,420 – 3,440 USD, marked by multiple rejections (🔴 red arrows).
Price formed a Bearish Harmonic Pattern (likely a Gartley or Bat), suggesting reversal from this resistance.
🔻 Bearish Momentum:
After the pattern completed, price broke below the minor support structure and is currently forming lower highs and lower lows, indicating bearish structure.
📉 Support Level:
Strong horizontal support zone around 3,298 – 3,300 USD, marked as “TARGET.”
This area was previously tested (🟠 orange circles) and now projected to act as a target level again.
🔄 Minor Retracement Zone:
Expecting a minor pullback to 3,347 USD (purple line) before potential continuation downward.
This zone aligns with the previous support turned resistance (classic SR flip).
🎯 Target Projection:
Based on the bearish impulse and measured move, the projected target is around 3,298.758 USD, which coincides with the previous support zone.
📌 Conclusion:
The price action suggests a high-probability bearish continuation, targeting the 3,298 USD zone unless the price breaks and holds above 3,347 USD. Traders may consider selling on rallies with a confirmation of rejection at resistance.
📉 Bias: Bearish
📍 Invalidation: Break and daily close above 3,347 USD
Analysis of Gold Spot / U.S. Dollar (15-Minute Chart)The provided chart for Gold Spot / U.S. Dollar (XAU/USD) on a 15-minute timeframe, published by NaviPips on TradingView.com on June 24, 2025, at 09:19 UTC, outlines a trading setup with the following insights:
Current Price and Trend: The current price is 3,353.510, with a slight decline of -0.425 (-0.01%). The chart shows a recent peak followed by a downward correction, suggesting a potential short-term bearish move.
Entry Level: The entry point is set at 3,358.290, slightly above the current price, indicating a buy opportunity if the price stabilizes or retraces to this level. This aligns with a support zone near the recent low.
Stop Loss: A stop loss is placed at 3,370.362, above the recent high, offering protection against an upward breakout. This level is approximately 12.072 points above the entry, defining the risk.
Take Profit Levels:
Take Profit 1: 3,344.209, a conservative target about 14.081 points below the entry, aligning with a support level.
Take Profit 2: 3,335.002, a deeper target indicating further downside momentum.
Take Profit 3: 3,332.879, the furthest target, suggesting a significant short-term decline if the trend continues.
Price Action: The chart reflects a recent consolidation phase after a peak, with a clear downward move initiating. The setup anticipates continued bearish momentum from the entry level.
Risk-Reward Ratio: The distance to the stop loss (12.072 points) compared to the targets (14.081 to 25.411 points) offers a favorable risk-reward ratio, making this a potentially viable short-term trade.
Conclusion
This setup targets a bearish move from the entry level of 3,358.290 , with defined take-profit levels and a stop loss to manage risk. Traders should watch for confirmation at the entry level and be prepared for potential reversals given the short timeframe and minor price change.

Analysis of Gold Spot / U.S. Dollar (4-Hour Chart)
The provided chart for Gold Spot / U.S. Dollar (XAU/USD) on a 4-hour timeframe, published by NaviPips on TradingView.com on June 23, 2025, at 21:50 UTC, offers a technical trading setup with the following key observations:
Current Price and Trend: The price is currently at 3,390.980, showing a slight decline of -0.495 (-0.91%) as per the latest data. The chart indicates a recent downward movement following a peak, suggesting a potential reversal or correction phase.
Entry Level: The suggested entry point is set at 3,391.103, slightly above the current price, indicating a buy opportunity if the price breaks or retests this level. This aligns with the recent price action near the resistance zone.
Stop Loss: A stop loss is placed at 3,440.000, providing a buffer above the recent high to protect against an upward breakout or false signal. This level is approximately 48.897 points above the entry, representing the maximum risk.
Target Levels:
Target 1: 3,360.000, a conservative first target approximately 31.103 points below the entry, aligning with a support zone.
Target 2: 3,298.316, a deeper target indicating a potential continuation of the downward trend.
Target 3: 3,250.000, the furthest target, suggesting a significant move if the momentum sustains.
Price Action and Pattern: The chart highlights a potential descending pattern (labeled 1 to 5), with a notable drop from a peak (2) to a lower level (3), followed by a retest (4) and a projected decline to (5). This could indicate a bearish continuation or a corrective wave.
Risk-Reward Ratio: The distance to the stop loss (48.897 points) compared to the targets (e.g., 31.103 to 141.103 points) suggests a favorable risk-reward ratio, especially for Target 3, making this a potentially attractive trade setup.
Conclusion
This setup anticipates a bearish move from the entry level of 3,391.103, with defined targets and a stop loss to manage risk. Traders should monitor the price action around the entry level for confirmation and be cautious of any unexpected bullish reversal given the recent volatility.

Analysis of Gold Spot / U.S. Dollar (XAU/USD) 15-Minute Chart
Historical Trend: The chart displays the price movement of Gold Spot / U.S. Dollar (XAU/USD) on a 15-minute timeframe from June 21 to June 24, 2025. The price followed a downtrend, defined by a descending trendline, after peaking around $3,367.574, with a recent decline toward $3,367.255 as of 16:04 UTC on June 23.
Key Levels:
Stock Loss: Set at $3,360.820 (red line), indicating the upper limit to exit a short position if the price reverses upward.
Entry: Positioned at $3,367.574 (gray line), marking the entry point for a potential short trade near the trendline.
Target 1: $3,375.557 (green line), the first profit-taking level above the entry.
Target 2: $3,388.090 (green line), the second profit-taking level for a larger gain.
Support: The $3,390.915 level (green line) acts as a potential support zone if the downtrend continues.
Recent Price Action: The price approached the downtrend line and showed a rejection, forming a potential shorting opportunity (highlighted with a yellow circle). The price is currently testing the $3,367.255 level, suggesting continued bearish momentum after breaking below the entry zone.
Projected Movement: The downward projection suggests the price could decline toward the $3,360.820 stop loss level if the bearish trend persists. A break below this could lead to further drops, while a bounce might target the $3,375.557 or $3,388.090 resistance levels.
Volume and Indicators: The chart includes Bollinger Bands (O3,367.260 H3,367.810 L3,366.747 C3,367.255) with a -0.040 (-0.00%) change, indicating low volatility. The trendline break suggests selling pressure, though specific volume data is not detailed.
Outlook: The chart outlines a shorting strategy with a clear entry and stop loss. The price is in a bearish phase, with potential targets at $3,375.557 and $3,388.090 if the downtrend continues. Monitor for a break above $3,360.820 to reassess the trade, as it would signal a bullish reversal.

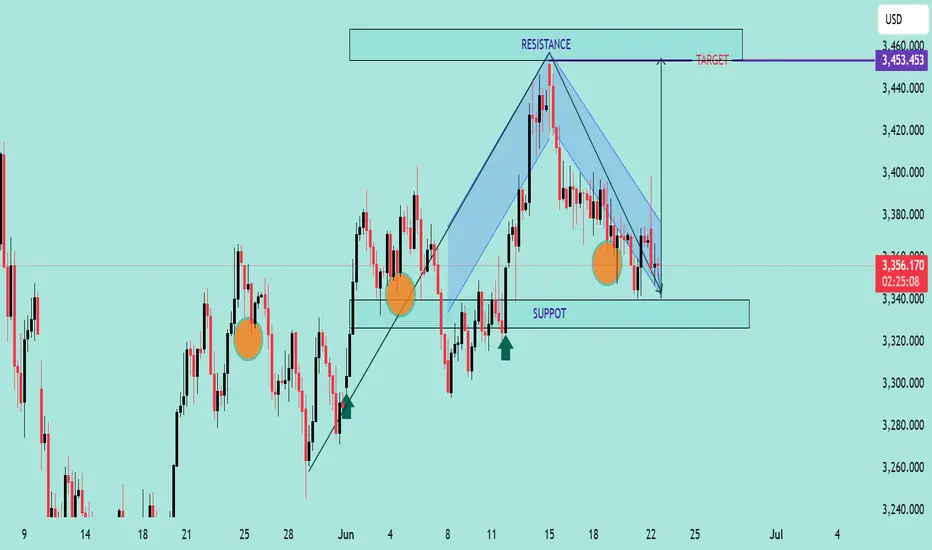
GOLD/USD Falling Wedge Breakout PotentialChart Analysis:
The chart illustrates a Falling Wedge Pattern, a bullish reversal setup typically signaling a breakout to the upside.
📌 Key Observations:
📉 Downward Channel: Price has been compressing within a falling wedge (highlighted in blue), indicating potential exhaustion of sellers.
💪 Support Zone: Strong support observed near the 3,340 level, with price rejecting this zone multiple times (highlighted with orange circles).
🔼 Bullish Signals: Price recently tested the lower wedge boundary and bounced, suggesting potential reversal.
🎯 Breakout Target: Projected target after breakout is around 3,453.453 USD, aligned with previous resistance zone.
🟢 Buy Pressure Arrows: Green arrows signal previous bullish reactions from similar demand zones.
📈 Conclusion:
If price breaks above the wedge’s upper boundary with volume confirmation, a bullish rally toward 3,453 is expected. Keep an eye on breakout retest for entry validation.
✅ Trading Plan Suggestion:
Entry: On breakout above wedge resistance
SL: Below recent swing low (~3,330)
TP: 3,453 zone 🎯
🔔 Note: Wait for a confirmed breakout before entering to avoid false signals.
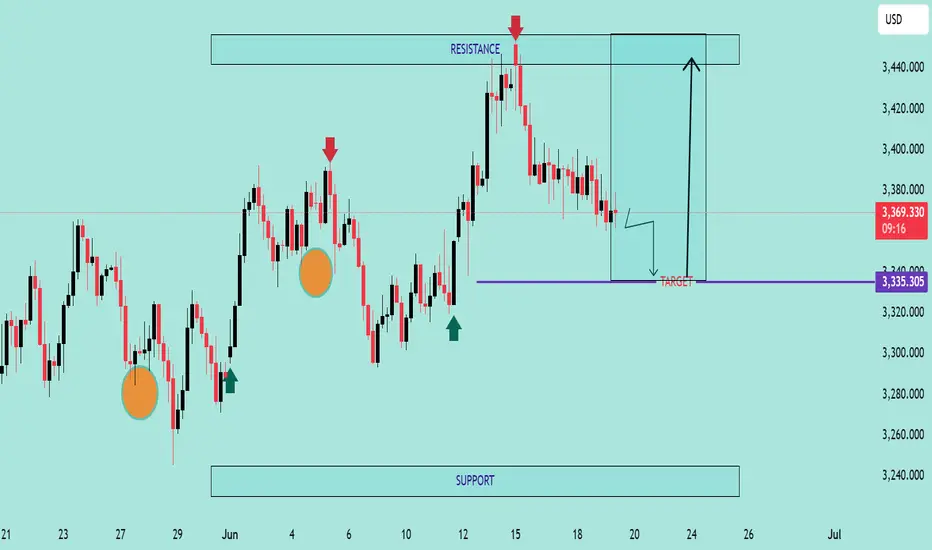
GOLD/USD Support Retest & Breakdown SetupGOLD/USD Support Retest & Breakdown Setup 📉🔍
🔹 Overview:
The chart indicates a potential bearish continuation pattern on GOLD/USD as the price is approaching a key support level at 3,335.305. Previous price action shows multiple rejections from the resistance zone (~3,435), followed by lower highs – a sign of weakening bullish momentum.
📊 Technical Analysis:
🔺 Resistance Zone (~3,435)
Multiple rejections (🔴 red arrows) indicate strong supply pressure.
Price has failed to break above this area thrice, forming a clear ceiling.
🔻 Support Zone (~3,335)
Marked as the target for a short setup.
Price is testing this level again after forming a minor consolidation below lower highs.
A clean break below this purple zone may trigger a continuation to the downside, targeting the broader support range below (~3,240).
🟠 Bearish Structure:
Series of lower highs (highlighted with circles).
Breakdown pattern is developing with declining bullish momentum.
📈 Potential Play:
A confirmed breakdown below 3,335 could lead to a drop toward the next major support.
If support holds, short-term bounce is possible but limited by the dominant resistance.
📌 Conclusion:
GOLD/USD is currently in a bearish setup, with the market eyeing a potential breakdown below a critical support zone. If this level fails to hold, we could see accelerated bearish momentum toward the lower support range.
💡 Caution: Wait for a confirmed close below support before entering any short trades.