XAUUSD ANALYSISI am posting a chart of XAUUSD this is the possible outcomes of the wave as per myview
3rd wave is completed and the current xauusd is in correction we can see abc correction on longterm as per trukit last wave now we can see trendline liquidity is need to be taken and in upcoming days we can see gold around 3820 from we can see 4-5wave as per my view.
Thanks
Goldlongterm

Gold Bullish Reversal from Demand Zone Targeting 4320 ResistanceGold has displayed a strong bullish rejection from the 4,220–4,240 demand zone, signaling that buyers are stepping back in after a brief corrective phase. The price has respected the previously broken ascending trendline, now acting as dynamic support, indicating that market sentiment remains positive.
Key Observations:
Trend Structure: The broader trend continues to favor the bulls, with higher highs and higher lows still valid.
Demand Zone: Buyers defended the 4,220–4,240 area with stxrong volume, confirming institutional interest.
Price Action: Recent bullish engulfing candles suggest renewed buying momentum.
Next Resistance: The 4,310–4,330 region stands as a key resistance zone where partial profit-taking could occur.
Volume: Noticeable increase in bullish volume near support adds confirmation to the move.
Trading Outlook:
If price sustains above 4,240, the bias remains bullish toward 4,320–4,340.
A daily close below 4,220 would invalidate this setup and shift focus back to the 4,100 zone.
Summary
Gold is currently positioned for a potential continuation of its primary uptrend, with early signs of buyer strength re-emerging at major support. Momentum remains in favor of the bulls as long as the 4,220 base holds firm.

Strategic Long-Term Perspective on GoldGold Market Analysis – Report View
Gold has delivered a strong bullish cycle after weeks of accumulation. The past phase showed a contracting range where liquidity was built up and multiple structural shifts occurred, signaling preparation for expansion. Once price broke out of that range in late August, momentum accelerated, leading to a clean and sustained rally into September.
The recent move highlights how market flow continues to favor the upside, with each correction acting as a re-accumulation zone rather than a trend reversal. Institutional order flow remains visible, supporting higher valuations as price respects bullish market structure.
Currently, gold is stabilizing after the sharp leg upward. This pause suggests a phase of healthy consolidation, likely absorbing liquidity before attempting the next impulsive wave higher. Overall sentiment remains constructive, with bullish continuation the dominant narrative unless a major structural shift occurs.

GOLD Bullish continuation (new highs, momentum sustain) :
Probability: around 60–65%
The breakout has strong support from macro conditions. Real yields look like they are peaking, inflation expectations remain sticky, and the Fed is leaning toward easing. On top of that, the US dollar is softening and central banks are continuing to add gold to reserves. These combined factors increase the odds that the breakout holds and the trend continues higher.
Sideways consolidation or retest of breakout :
Probability: about 25–30%
A pullback or cnsolidation wouldn’t be surprising, especially if the Fed sounds less dovish or if inflation data cools faster than expected. In that case, gold could spend some time chopping between support and resistance before deciding its next big move.
Major correction or deep mean reversion :
A deep selloff looks like the least likely path right now. Real yields aren’t rising sharply, inflation isn’t collapsing, and the dollar is still under pressure. But nothing is guaranteed. A surprise hawkish turn from the Fed or a sudden global disinflation shock could knock gold back toward old structural levels.but this remains the least likely scenario in the near to medium term.

Gold: Buy around 3624, target 3660-3674Gold Market Analysis:
Yesterday, we placed a sell order at 3655, then sold all our profits at 3646 in the US market. Yesterday's market saw a surge followed by a decline. The market fluctuations we predicted in yesterday's blog post were all correct. Gold is currently fluctuating at a high level in the short term. In this market, there are opportunities for buying and selling if you capitalize on the market's rhythm. Today, I predict gold will continue to fluctuate and correct before the CPI data is released. Capitalizing on this rhythm, both buying and selling are possible. Today, we are focusing on 3620. If this level breaks, we will consider a short position. Otherwise, we are looking for high-level fluctuations. The long-term trend is still a buy. We made it clear yesterday that long-term trends require time and space to develop. Yesterday's small positive close on the daily chart confirms our analysis. The 5-day moving average is beginning to rise. The volatility will not last long, and results will be seen soon. During the Asian session, we're focusing on the strong support band of 3620-3625. This level is also a buying opportunity for a rebound. Resistance is at 3657, yesterday's rebound high. We anticipate the market to fluctuate within this range. A break above 3657 will open up further upside, and a pullback could be considered a buying opportunity. Volatility occurs when a surge reaches resistance, and further gains are more likely after the volatility ends.
Support is 3620-3625, with strong support at 3600. Resistance is at 3647 and 3657, with 3647 being the dividing line between strength and weakness.
Fundamental Analysis:
The most important CPI data this week will be released today. The recent surge in gold prices is driven by increased market expectations for a September rate cut by the Federal Reserve. This CPI may be the final reference data the Fed uses.
Trading Recommendation:
Gold: Buy around 3624, target 3660-3674

Analysis of subsequent gold price trendsMarket News:
Spot gold saw slight gains in early Asian trading on Thursday (September 11th), currently trading around $3,545 per ounce. International gold prices continued their strong performance. Amidst softening US inflation data and widespread market bets that the Federal Reserve will initiate an interest rate cut next week, spot gold prices are approaching all-time highs, with related gold stocks and mining company indices simultaneously reaching record closing highs. The current strength in the gold market stems from a combination of weak US economic data, geopolitical risks, and the Federal Reserve's policy shift. While gold prices may fluctuate in the short term due to CPI data, the overall bull market is firmly in place, with a year-to-date gain of over 39% suggesting further upside potential. Gold prices continue to approach record highs, driven by unexpectedly weak inflation data, market confidence in an imminent Fed rate cut, and increased safe-haven demand. Industry analysts predict that if the Federal Reserve embarks on an easing cycle, gold will likely continue to attract investors, potentially reaching $3,900 per ounce by the end of the year.
Technical Analysis:
Gold has entered a period of volatile adjustment. Yesterday, it fell before rising, consolidating in a wide range around 3620/3660. Technically, the weekly and daily charts remain within a buying trend channel. The daily chart retraced its course below 3620 before stabilizing and rising strongly above 3658, closing above 3640. The daily chart closed with another positive candlestick pattern. The moving averages remain upward, with the 5-day MA moving average moving up to 3626. The hourly Bollinger Bands are converging, with the moving averages converging. The RSI indicator is retracing to its mid-50 level. On the four-hour chart, gold prices remain within the upper Bollinger Bands, with the moving averages converging. Technically, gold trading continues to see wide range-bound adjustments, with buyers buying at low prices and selling high. Fundamentals: Today's US PPI inflation data will be a key focus!
Trading strategy:
Short-term gold: Buy at 3627-3630, stop loss at 3618, target at 3660-3680;
Short-term gold: Sell at 3660-3663, stop loss at 3672, target at 3630-3610;
Key points:
First support level: 3626, Second support level: 3612, Third support level: 3600
First resistance level: 3666, Second resistance level: 3680, Third resistance level: 3696

Global central banks are buying gold! Gold prices are soaring!Market News:
In early Asian trading on Tuesday (September 9), spot gold prices fluctuated at high levels, currently trading around $3,636 per ounce. London gold prices, like a runaway force, broke through the $3,600 per ounce mark and ultimately reached a new all-time high of $3,647. This was primarily due to the US non-farm payroll data released last week, which fell far short of expectations, reinforcing the possibility of a Federal Reserve interest rate cut next week, with a 10% chance of a 50 basis point reduction. In addition to monetary policy expectations, continued gold purchases by global central banks have provided solid support for the international gold market. Meanwhile, global political dynamics are also fueling gold's upward trend. Any rapid rise in asset prices is accompanied by increased volatility. When positive news is fully digested by the market, be wary of the possibility of a volatile pullback triggered by profit-taking by long positions. Investors await Wednesday's Producer Price Index (PPI) and Thursday's Consumer Price Index (CPI) data to gauge the Federal Reserve's policy path. The Bureau of Labor Statistics will release revised non-farm payroll figures this trading day, which investors should pay close attention to. Furthermore, investors should monitor news related to the Russia-Ukraine geopolitical situation.
Technical Analysis:
Gold's trend-buying structure remains intact, reaching a new all-time high of 3646. The daily chart is currently moving upwards along the 5-day moving average, with the 10-day and 7-day moving averages opening at 3524 and 3570, respectively. The RSI indicator has reached the overbought zone at the high 80s, prompting caution for a pullback and correction. The recent consecutive gains require some technical adjustments, so we should remain cautious about overly bullish gold prices and remain wary of potential pullbacks. Looking at the 4-hour gold chart, short-term support is currently focused on the 3610 level, with particular attention focused on the 3575-83 support level. This level also serves as a strong short-term buying zone. Continued buying at this level within the day maintains a bullish outlook. As long as the daily chart does not break below this level, buying at lower prices on a pullback is the primary strategy. The 4-hour moving average remains upward, with prices within an ascending channel and within the upper Bollinger Band. The RSI is at a high of 80. Gold's technical outlook remains bullish, and the key trading strategy remains to buy on dips (short-term buying) and sell on highs (swing trading). Be wary of potential pullbacks after overbought conditions.
Trading strategy:
Short-term gold: Buy at 3610-3613, stop loss at 3600, target at 3640-3660;
Short-term gold: Sell at 3667-3670, stop loss at 3679, target at 3620-3600;
Key points:
First support level: 3620, second support level: 3613, third support level: 3600
First resistance level: 3640, second resistance level: 3655, third resistance level: 3678

Gold's historic rally continues!Market News:
In early Asian trading on Monday (September 8), spot gold prices fluctuated within a narrow range, currently trading around $3,597/oz. Influenced by exceptionally weak US non-farm payroll data, spot gold prices surged, reaching $3,600/oz in London, a record high. The market now believes there is approximately a 10% chance that the Federal Reserve will cut interest rates by 50 basis points in September. Investors should be wary of the risk of a significant rate cut at this meeting. From a broader perspective, the fundamentals of international gold are exceptionally strong. Non-yielding gold has stood out in an environment of low interest rates and high uncertainty. This rally is not a flash in the pan; it is built on a solid foundation of multiple factors, including a weak US dollar and expectations of a global economic slowdown. Another major pillar of gold's gains is continued central bank buying. In addition to domestic US economic factors, international geopolitical turmoil has also provided strong support for gold. Gold traders are focused on this week's US Consumer Price Index (CPI) data. If progress is made in combating inflation, this will strengthen the case for a rate cut at the September 16-17 meeting. Market sentiment for rate cuts has reached its limit. A slight rise in the CPI may lead to temporary caution in international gold prices, but the overall bull market remains intact.
Technical Analysis:
Non-farm payroll data fueled gold buying, extending the trend structure and reaching a new all-time high. Spot gold prices hit another all-time high, posting their strongest single-week gain. Weak US non-farm payroll data further heightened expectations of a Fed rate cut, and amidst growing global economic uncertainty, gold's strong rally has gained new momentum. The weekly chart showed a strong bullish trend. After seven consecutive daily gains, the eighth candlestick formed a small bearish retracing line, retracing to the 3516 level. After a correction, the 5-day moving average regained support. Following Friday's positive non-farm payroll data, gold once again broke through its all-time high, reaching the 3600 mark, driven by the convergence of technical and fundamental factors. The daily candlestick structure remains a buy signal! Price is trading within the upper Bollinger Band, with the RSI nearing the 80-day mark. The latest 10/7-day moving averages are moving upward to 3498/35. The daily and weekly trends remain bullish, but the RSI is approaching overbought territory, prompting caution for potential corrections. On the four-hour chart, price is trading within the upper middle Bollinger Band, with the moving averages remaining upward, maintaining its upward trend. The trading strategy for gold at the start of the week continues to be primarily buy-on-low.
Trading Strategy:
Short-term gold buy at 3572-3575, stop loss at 3564, target at 3600-3620;
Short-term gold sell at 3636-3639, stop loss at 3648, target at 3590-3570;
Key Points:
First Support Level: 3572, Second Support Level: 3555, Third Support Level: 3538
First Resistance Level: 3600, Second Resistance Level: 3616, Third Resistance Level: 3636

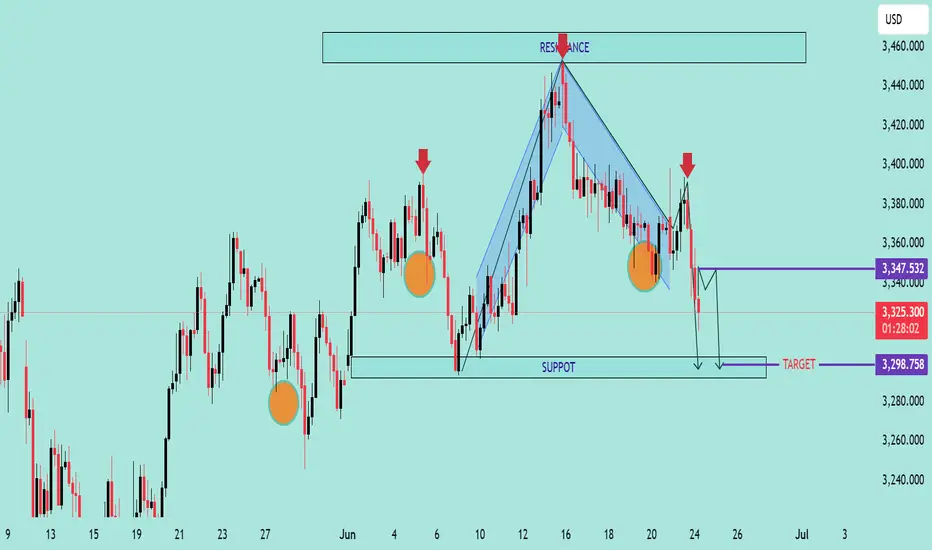
Bearish Continuation Pattern Detected on GOLD/USD Bearish Continuation Pattern Detected on GOLD/USD 📉
📊 Chart Analysis Summary:
The GOLD/USD chart shows a clear bearish continuation pattern, following a rejection from a major resistance zone.
🔍 Key Technical Highlights:
🔺 Resistance Zone:
Strong resistance at 3,420 – 3,440 USD, marked by multiple rejections (🔴 red arrows).
Price formed a Bearish Harmonic Pattern (likely a Gartley or Bat), suggesting reversal from this resistance.
🔻 Bearish Momentum:
After the pattern completed, price broke below the minor support structure and is currently forming lower highs and lower lows, indicating bearish structure.
📉 Support Level:
Strong horizontal support zone around 3,298 – 3,300 USD, marked as “TARGET.”
This area was previously tested (🟠 orange circles) and now projected to act as a target level again.
🔄 Minor Retracement Zone:
Expecting a minor pullback to 3,347 USD (purple line) before potential continuation downward.
This zone aligns with the previous support turned resistance (classic SR flip).
🎯 Target Projection:
Based on the bearish impulse and measured move, the projected target is around 3,298.758 USD, which coincides with the previous support zone.
📌 Conclusion:
The price action suggests a high-probability bearish continuation, targeting the 3,298 USD zone unless the price breaks and holds above 3,347 USD. Traders may consider selling on rallies with a confirmation of rejection at resistance.
📉 Bias: Bearish
📍 Invalidation: Break and daily close above 3,347 USD
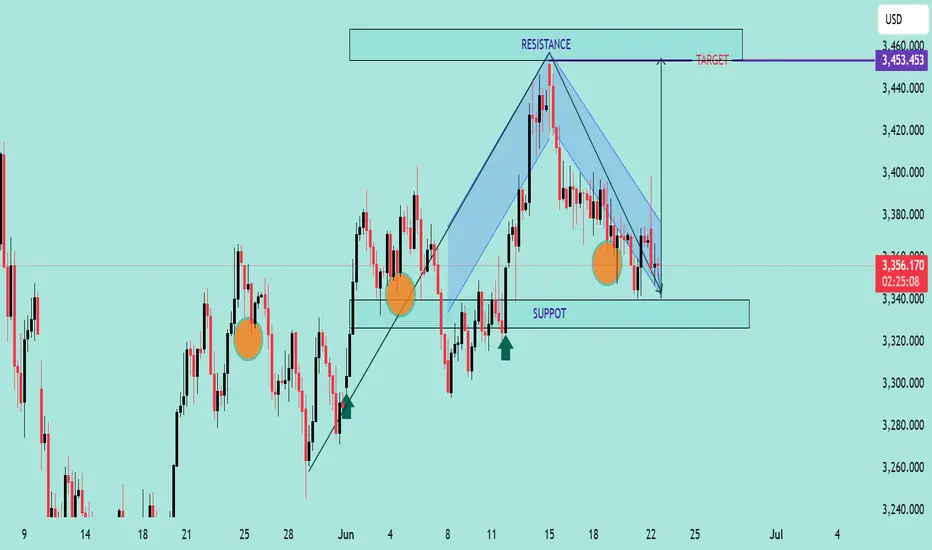
GOLD/USD Falling Wedge Breakout PotentialChart Analysis:
The chart illustrates a Falling Wedge Pattern, a bullish reversal setup typically signaling a breakout to the upside.
📌 Key Observations:
📉 Downward Channel: Price has been compressing within a falling wedge (highlighted in blue), indicating potential exhaustion of sellers.
💪 Support Zone: Strong support observed near the 3,340 level, with price rejecting this zone multiple times (highlighted with orange circles).
🔼 Bullish Signals: Price recently tested the lower wedge boundary and bounced, suggesting potential reversal.
🎯 Breakout Target: Projected target after breakout is around 3,453.453 USD, aligned with previous resistance zone.
🟢 Buy Pressure Arrows: Green arrows signal previous bullish reactions from similar demand zones.
📈 Conclusion:
If price breaks above the wedge’s upper boundary with volume confirmation, a bullish rally toward 3,453 is expected. Keep an eye on breakout retest for entry validation.
✅ Trading Plan Suggestion:
Entry: On breakout above wedge resistance
SL: Below recent swing low (~3,330)
TP: 3,453 zone 🎯
🔔 Note: Wait for a confirmed breakout before entering to avoid false signals.
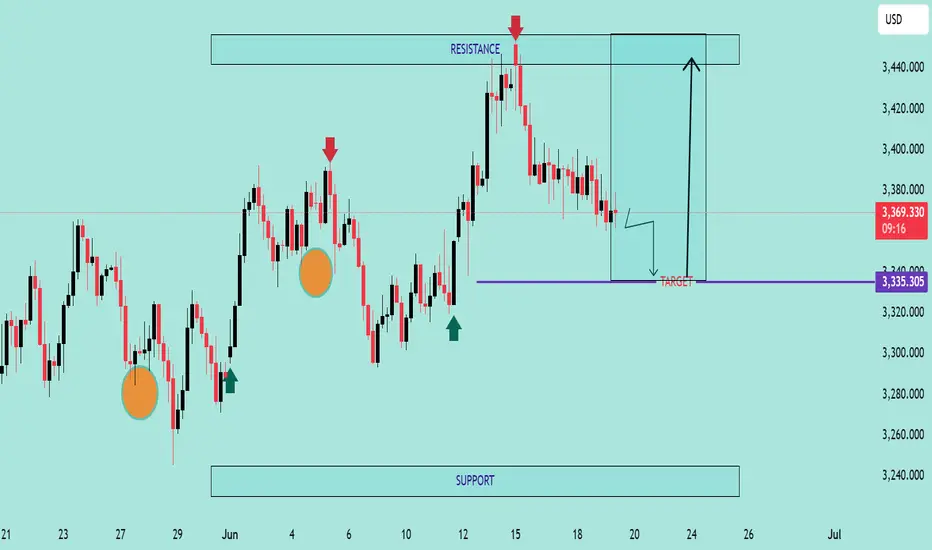
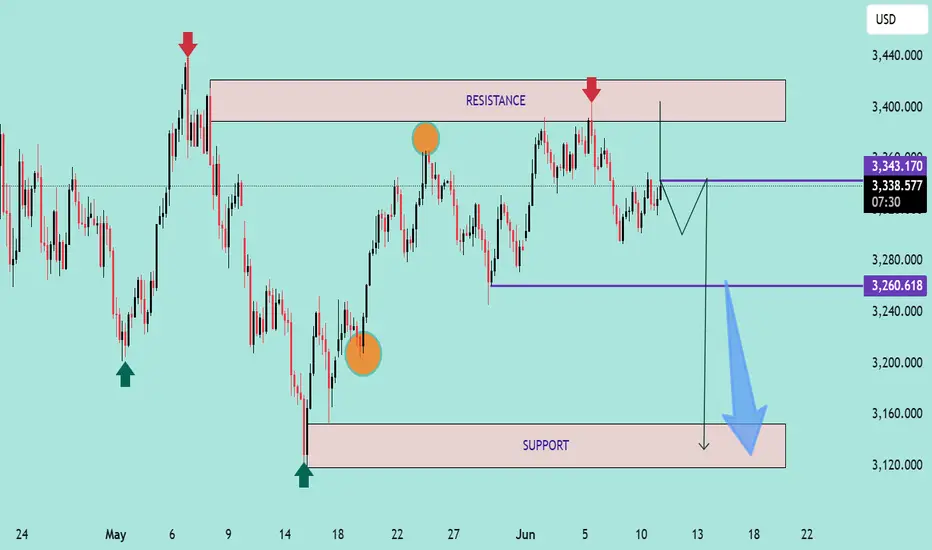
GOLD/USD Support Retest & Breakdown SetupGOLD/USD Support Retest & Breakdown Setup 📉🔍
🔹 Overview:
The chart indicates a potential bearish continuation pattern on GOLD/USD as the price is approaching a key support level at 3,335.305. Previous price action shows multiple rejections from the resistance zone (~3,435), followed by lower highs – a sign of weakening bullish momentum.
📊 Technical Analysis:
🔺 Resistance Zone (~3,435)
Multiple rejections (🔴 red arrows) indicate strong supply pressure.
Price has failed to break above this area thrice, forming a clear ceiling.
🔻 Support Zone (~3,335)
Marked as the target for a short setup.
Price is testing this level again after forming a minor consolidation below lower highs.
A clean break below this purple zone may trigger a continuation to the downside, targeting the broader support range below (~3,240).
🟠 Bearish Structure:
Series of lower highs (highlighted with circles).
Breakdown pattern is developing with declining bullish momentum.
📈 Potential Play:
A confirmed breakdown below 3,335 could lead to a drop toward the next major support.
If support holds, short-term bounce is possible but limited by the dominant resistance.
📌 Conclusion:
GOLD/USD is currently in a bearish setup, with the market eyeing a potential breakdown below a critical support zone. If this level fails to hold, we could see accelerated bearish momentum toward the lower support range.
💡 Caution: Wait for a confirmed close below support before entering any short trades.
GOLD/USD Bearish Rejection at Resistance ZoneGOLD/USD Bearish Rejection at Resistance Zone 📉🟥
📊 Technical Overview:
The chart for GOLD/USD shows a clear price action behavior between a well-defined resistance zone (~3,480–3,510) and a support zone (~3,260–3,280).
🔻 Bearish Signals:
The price has tested the resistance zone multiple times (highlighted with red arrows and orange circles) but failed to break above it, indicating strong selling pressure.
The current price action suggests another lower high formation, which is a bearish signal 📉.
Recent candles are rejecting the upward move, pointing to potential downside movement.
🟩 Support Confirmation:
Previous reactions from the support zone (green arrows) show that buyers have consistently stepped in near the 3,260–3,280 range.
This level remains a key demand zone where a bounce might be expected.
🔁 Outlook:
If the price continues to reject the resistance and follows the pattern, we might see another drop towards the support area.
A break below the support zone would confirm a bearish breakout and could open the door to deeper downside targets.
📌 Conclusion:
GOLD/USD is trading within a range, but the repeated failures at resistance suggest bearish momentum might take control in the short term. A move back toward the support zone is likely unless a breakout above resistance occurs.
📉 Resistance: 3,480–3,510
🟩 Support: 3,260–3,280
🔍 Bias: Short-term Bearish unless resistance breaks

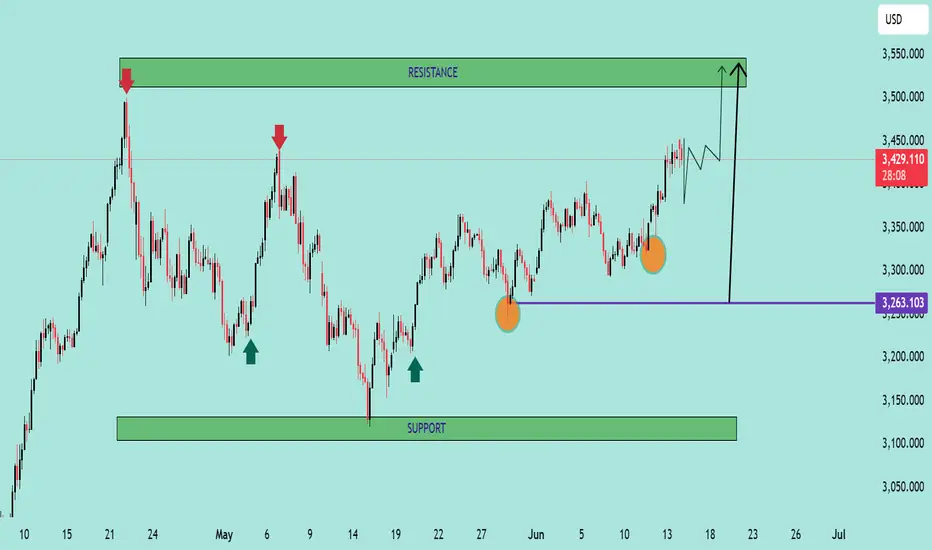
GOLD/USD – Bullish Reversal Pattern ForminGOLD/USD – Bullish Reversal Pattern Forming 🟢📈
📊 Chart Analysis:
The chart shows a strong Inverse Head and Shoulders pattern forming, which is a classic bullish reversal signal:
🔹 Left Shoulder and Right Shoulder – Marked with orange circles, both found support near the 3,263 level (purple line), suggesting strong buying interest at this zone.
🔹 Head – The lowest point in between the shoulders, also bouncing from support.
🔹 Resistance Zone – Marked with red arrows around 3,500–3,520. This zone has rejected price action multiple times in the past.
🔹 Support Zone – Marked below 3,200, where previous consolidation and buying took place.
📈 Projected Move:
The neckline breakout suggests a potential move toward the 3,520+ level. A minor pullback is expected before continuation. If price breaks above resistance, we could see a strong bullish rally.
📌 Key Levels:
Support: 3,263 🟩
Resistance: 3,500–3,520 🟥
Potential Target After Breakout: 3,550+ 🎯
✅ Bias: Bullish above 3,263 support
⚠️ Invalidation: A break below the neckline would cancel the bullish setup
GOLD SPOT (XAU/USD) 4H Analysis – Bullish Momentum Breakout🔔 GOLD SPOT (XAU/USD) 4H Analysis – Bullish Momentum Breakout 💥📈
📊 Overview:
Gold has confirmed a strong bullish breakout from the consolidation zone, driven by sustained support and recent upward pressure. After rebounding from the MAIN SUPPORT zone around $3,200, price action has surged and successfully touched the 1st Take Profit (TP1) zone at $3,429.
🔍 Key Levels:
🟩 Main Support: $3,200 zone — held firm and acted as a launchpad for the bullish reversal.
📌 1st TP (Touched): $3,429 — resistance level has been tested and price is currently hovering near it.
🎯 Next Target (TP2): $3,504 — price is expected to approach this zone as bullish momentum continues.
📈 Technical Outlook:
Price structure shows a clear higher low formation followed by a strong impulse breakout.
Current momentum suggests bulls are in control, with volume and volatility increasing on the upward leg.
As long as the price remains above the $3,366 short-term support, the bias remains bullish.
🛑 Risk Note:
Watch for possible rejection near TP2.
A failure to hold above $3,366 may trigger a pullback to retest lower zones.
✅ Conclusion:
The bullish continuation scenario remains valid with potential to hit the $3,504 mark. Traders may look for long opportunities on pullbacks while maintaining tight risk management. 🔐📊

GOLD/USD Bullish Breakout Confirmation GOLD/USD Bullish Breakout Confirmation 🚀📈
📊 Technical Analysis Overview:
The chart illustrates a bullish breakout above a well-defined resistance zone around $3,390–$3,400. Price action has decisively closed above this resistance, suggesting strong bullish momentum.
🔍 Key Observations:
🟦 Support Zone:
Marked clearly between $3,250–$3,280, this level has held firm multiple times (highlighted with green arrows and orange circles), confirming buyer interest and market structure.
🟦 Resistance Turned Support:
The previous resistance zone around $3,390–$3,400 has now potentially turned into a new support. Price retesting this zone and holding would further validate the breakout.
📈 Future Projections:
The chart anticipates a retest-pullback-continuation scenario:
Pullback to new support 📉
Bullish continuation toward $3,460+ 🎯 if support holds.
✅ Bias:
Bullish as long as price remains above the $3,390 zone. Break and hold below would invalidate the bullish setup.
📌 Strategy Tip:
Look for confirmation on the lower timeframes (e.g., bullish engulfing or pin bar) on the retest before entering long.
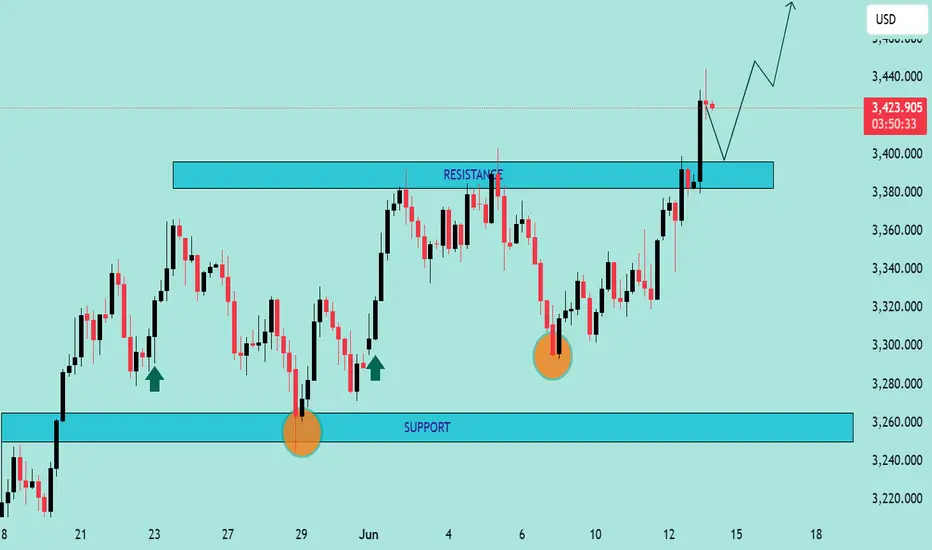
GOLD PRICE ACTION ANALYSIS – June 11, 2025 GOLD PRICE ACTION ANALYSIS – June 11, 2025 🟡
Technical Breakdown & Bearish Scenario Ahead ⚠️📉
🔍 Overview:
The chart presents a clear range-bound structure with strong horizontal resistance around the $3,400–$3,420 zone and support around the $3,120–$3,160 level. Price is currently trading near the upper range of the consolidation.
📊 Key Technical Levels:
🔴 Resistance Zone: $3,400 – $3,420
➤ Price has been rejected here multiple times (highlighted by red arrows and orange circles), showing strong supply pressure.
🟣 Intermediate Support: $3,260.618
➤ This level acted as a minor support and could be tested again if the current pullback deepens.
🟤 Major Support Zone: $3,120 – $3,160
➤ A key demand area where price previously bounced significantly.
📉 Bearish Setup:
A potential lower high is forming just below the resistance zone.
The projected path suggests a minor pullback to form a bearish retest, followed by a potential breakdown below $3,260.
If the $3,260 support is broken decisively, further downside toward the $3,120–$3,160 support is likely (blue arrow projection).
🔄 Bullish Scenario (Invalidation):
A breakout and strong close above $3,420 could invalidate the bearish structure.
In that case, price might attempt to target higher resistance levels beyond $3,440.
📌 Conclusion:
Gold remains in a range with a bearish bias unless the $3,420 resistance is breached.
🔽 Watch for confirmation below $3,260 for bearish continuation.
✅ For bulls, wait for a strong breakout above resistance with volume.
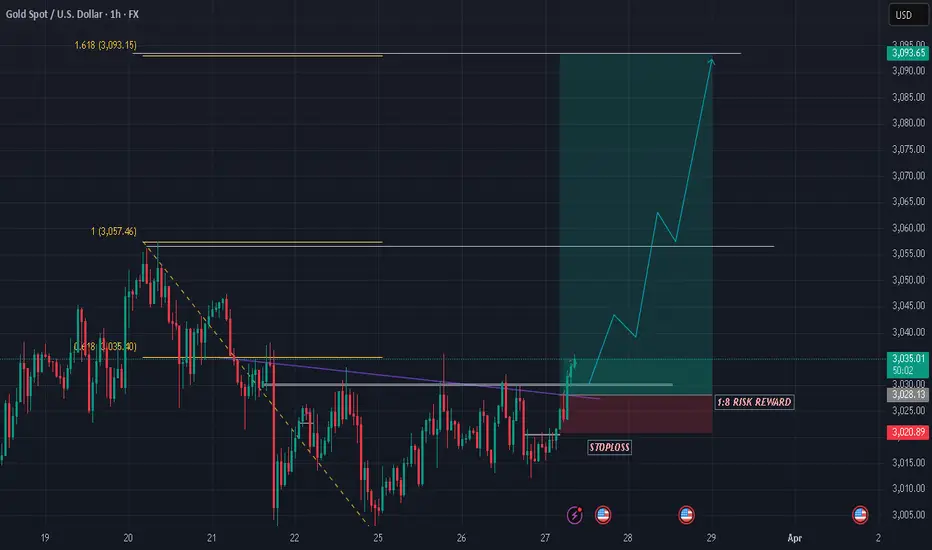
GOLD SHOWING A GOOD UP MOVE WITH 1:8 RISK REWARD GOLD SHOWING A GOOD UP MOVE WITH 1:8 RISK REWARD
DUE TO THESE REASON
A. its following a rectangle pattern that stocked the market
which preventing the market to move any one direction now it trying to break the strong resistant lable
B. after the break of this rectangle it will boost the market potential for break
C. also its resisting from a strong neckline the neckline also got weeker ald the price is ready to break in the outer region
all of these reason are indicating the same thing its ready for breakout BREAKOUT trading are follws good risk reward
please dont use more than one percentage of your capitalfollow risk reward and tradeing rules
that will help you to to become a bettertrader
thank you
GOLD SHOWING A GOOD UP MOVE WITH 1:7 RISK REWARDGOLD SHOWING A GOOD UP MOVE WITH 1:5 RISK REWARD
DUE TO THESE REASON
A. its following a rectangle pattern that stocked the market
which preventing the market to move any one direction now it trying to break the strong resistant lable
B. after the break of this rectangle it will boost the market potential for break
C. also its resisting from a strong neckline the neckline also got weeker ald the price is ready to break in the outer region
all of these reason are indicating the same thing its ready for breakout BREAKOUT trading are follws good risk reward
please dont use more than one percentage of your capitalfollow risk reward and tradeing rules
that will help you to to become a bettertrader
thank you

GOLD SHOWING A GOOD UP MOVE WITH 1:7 RISK REWARDGOLD SHOWING A GOOD UP MOVE WITH 1:7 RISK REWARD
DUE TO THESE REASON
A. its following a rectangle pattern that stocked the market
which preventing the market to move any one direction now it trying to break the strong resistant lable
B. after the break of this rectangle it will boost the market potential for break
C. also its resisting from a strong neckline the neckline also got weeker ald the price is ready to break in the outer region
all of these reason are indicating the same thing its ready for breakout BREAKOUT trading are follws good risk reward
please dont use more than one percentage of your capitalfollow risk reward and tradeing rules
that will help you to to become a bettertrader
thank you

Gold 🪙Gold could climb to 2687 within or on ( 16th Sep 2024 )
Disclaimer:
It's a personal view not a financial advise and I assume no responsibility and liability whatever outcome arises.

BTCUSD SHOWING A GOOD DOWN MOVE WITH 1:20 RISK REWARDGold trying to break the rectangle zone to Down side
With huge sellers power
A short term 15m tradeing setup showing on gold
Selling setup
With a risk reward ratio of 1:20
The setup giving clarity to SELL
Selling because in longterm it's a Down TREND
Also in a pick top lable
And forming a DOWN setup
So according to the combine results of
15minit 1hour and daily chat
And the short term setup
All are of them indicating the same SELLING SETUP
BTCUSD SHOWING A GOOD D
UP MOVE WITH 1:20 RISK REWARD
DUE TO THESE REASON
A. its following a rectangle pattern that stocked the market
which preventing the market to move any one direction now it trying to break the strong resistant lable
B. after the break of this rectangle it will boost the market potential for break
C. also its resisting from a strong neckline the neckline also got weeker ald the price is ready to break in the outer region
all of these reason are indicating the same thing its ready for breakout BREAKOUT trading are follws good risk reward
please dont use more than one percentage of your capitalfollow risk reward and tradeing rules
that will help you to to become a bettertrader
thank you

Bullish on Gold Gold screaming Buy Buy Buy
From 26th July'24
Time to buy the Dip in Gold Due to Slash in Custom Duty by the Government.
Buy on Dips strategy is good to go for Long term Investing This is the right time for Gold lovers to invest as Daily Timeframe Charts suggest the Fall in Gold prices are Done.
The bottom is made to be precise.
Buy Signal also generated on Silver too.

XAUUSD/GOLD WEEEKLY ANALYSIS 22.07.24The allure of non-yielding bullion tends to increase when interest rates are lowered because the opportunity cost of holding gold decreases. Investor sentiment has played a significant role in the recent spike in gold prices. The current market positioning reflects a strong bullish outlook on gold
