XAU/USD – Bullish Range Breakout with Pivot Support | Target in Technical Analysis (H1):
📊 Market Structure:
Gold maintains a strong bullish structure with clear Higher Highs & Higher Lows ✅, perfectly aligned with the ascending trendline 📈.
📦 Range → Breakout:
Price consolidated inside a range 🔄 and then delivered a clean bullish breakout 💥, signaling accumulation and continuation strength.
🎯 POI (Point of Interest):
Multiple POI reactions 🟢 confirm aggressive buyer interest at demand zones, reinforcing bullish conviction.
🔁 Pivot Point Flip:
The marked pivot zone has flipped from resistance into strong support 🟩 — a textbook bullish continuation signal.
🕯️ Current Price Action:
Price is holding above the pivot point and consolidating bullishly, indicating acceptance at higher levels 📌.
🎯 Upside Target Projection
🎯 Primary Target: 4,750 – 4,760
(Liquidity zone & projected resistance)
🔄 Expected Path:
Minor pullbacks inside the grey zone 🔍 ➝ continuation toward the target 🚀
❌ Invalidation Level
⚠️ A strong H1 close below the pivot support (~4,690–4,700) would weaken the bullish bias and signal possible range re-entry.
Bias: 📈 Bullish Continuation
Trade Idea: 🧠 Buy pullbacks above pivot 🟢 | Aim for liquidity at highs 🎯🚀
Goldman_analysis

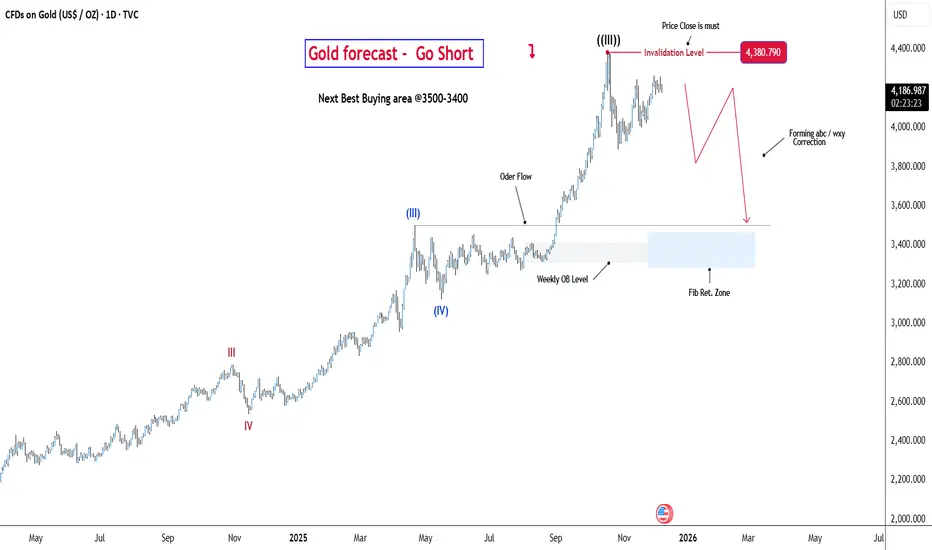
Gold Forecast Daily TF Elliott Wave AnalysisGold Price now super cycle wave 3 completed and wave 4 correction is going... this correction forming ABC flat or WXY correction so wait for fresh buy @ 3500 to 3400 USD or short @ 3350-3450 level
GOLD/USD Bullish Breakout Confirmation GOLD/USD Bullish Breakout Confirmation 🚀📈
📊 Technical Analysis Overview:
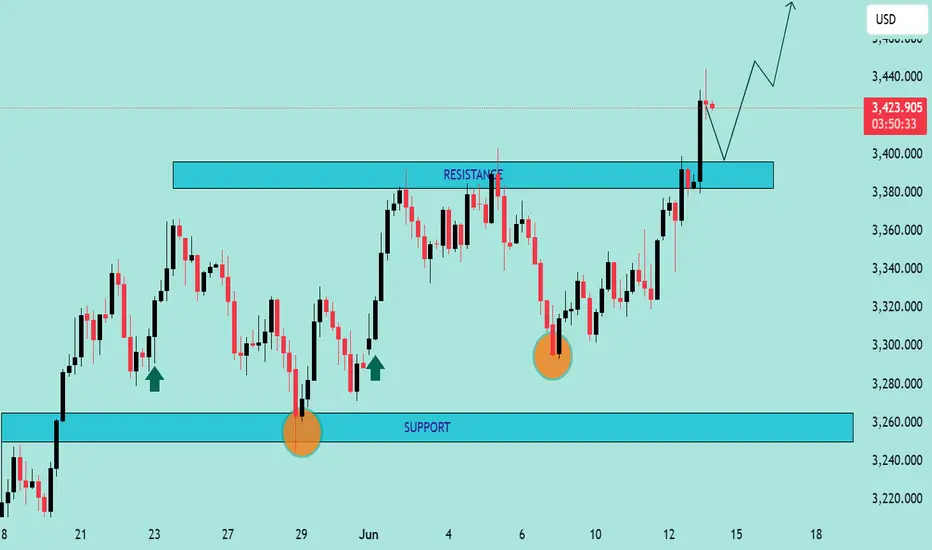
The chart illustrates a bullish breakout above a well-defined resistance zone around $3,390–$3,400. Price action has decisively closed above this resistance, suggesting strong bullish momentum.
🔍 Key Observations:
🟦 Support Zone:
Marked clearly between $3,250–$3,280, this level has held firm multiple times (highlighted with green arrows and orange circles), confirming buyer interest and market structure.
🟦 Resistance Turned Support:
The previous resistance zone around $3,390–$3,400 has now potentially turned into a new support. Price retesting this zone and holding would further validate the breakout.
📈 Future Projections:
The chart anticipates a retest-pullback-continuation scenario:
Pullback to new support 📉
Bullish continuation toward $3,460+ 🎯 if support holds.
✅ Bias:
Bullish as long as price remains above the $3,390 zone. Break and hold below would invalidate the bullish setup.
📌 Strategy Tip:
Look for confirmation on the lower timeframes (e.g., bullish engulfing or pin bar) on the retest before entering long.
"Gold's Danger Zones: Are You Prepared for the Next Move?"Gold Trading Analysis: Key Levels for Your Strategy
In this analysis, we focus on two critical levels for gold trading: 2665.624 and 2670.240. These levels are your danger zones, and you should only use them on the 15-minute timeframe.
Here’s how to approach it:
1. Breakout and Retest: Whenever you see a breakout at these levels on the 15-minute chart, wait for a retest before entering. This increases your chances of a successful trade.
2. Set Your Targets: After entry, aim for the next level as your profit target and enjoy the gains!
3. Avoid Large Candle Breakouts: If there’s a breakout with a large candle on the 15-minute timeframe, exercise caution. Such breakouts can lead to bigger stop-losses, increasing the risk of getting stopped out.
Your feedback is crucial! If you find my analysis helpful and are making profits by following these levels, please comment and let me know. Your support motivates me to provide more insights, so share how much profit you’ve made using these strategies!
