XAUUSD ANALYSISI have market the possible wave count as per my analysis we can see new high in upcoming months before new high we can see 10 percent correction in gold in upcoming days this is simple correction all metals are bullish as per my analysis. i am attaching last analysis of gold also.
Thanks
Ishu Prajapati
Goldmansachs

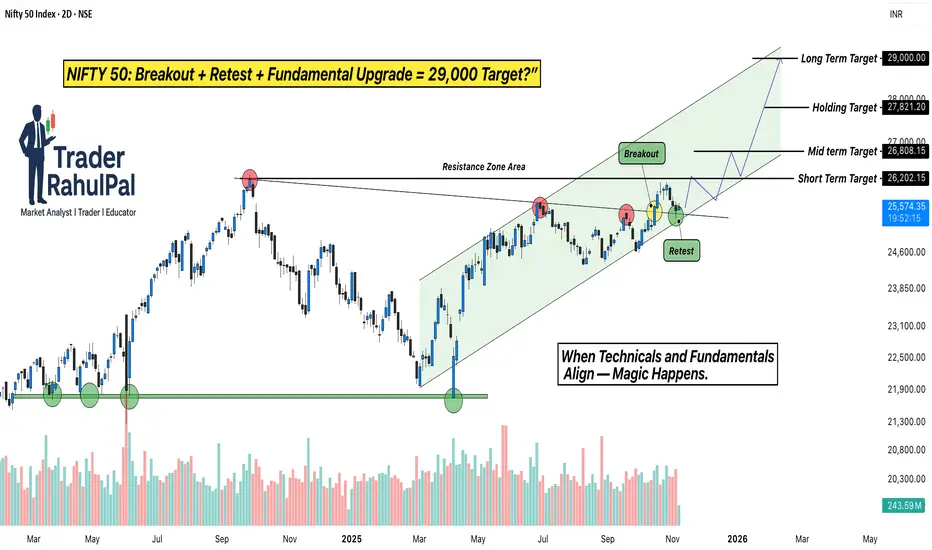
NIFTY Breakout + Goldman Sachs Upgrade = 29,000 Target?Hello Traders!
Today’s analysis is on NIFTY 50 Index, which has recently given a strong Breakout and Retest setup after months of consolidation. The index broke out from its Resistance Zone , retested the breakout area perfectly, and is now holding firmly inside a rising Trend Channel .
This move is not just technical, it’s being backed by major institutional optimism. According to a recent Goldman Sachs report , India’s stock market has been upgraded to “Overweight”, with NIFTY 50 projected to reach 29,000 by 2026 .
Why this setup is special?
Perfect breakout and retest structure with strong volume confirmation.
Channel trend remains intact, showing controlled accumulation at higher levels.
Institutional support from Goldman Sachs aligns with the technical breakout, adding conviction to the rally.
Levels to Track:
NIFTY is holding above the breakout zone near 25,000 , with immediate support seen at 24,600 . As long as the index sustains above this level, the short-term upside remains open toward 26,800 , followed by the next leg around 29,000 , matching Goldman Sachs’ longterm projection.
Rahul’s Tip:
When technicals and fundamentals align, the results are often explosive. A clean retest like this, supported by global institutional confidence, can lead to a powerful trend extension. Traders who position early usually ride the strongest part of the move.
(Analysis By @TraderRahulPal | More analysis & educational content on my profile. If this helped you, don’t forget to like and follow for regular updates.)
Disclaimer:
This analysis is for educational purposes only and should not be taken as financial advice. Please do your own research or consult your financial advisor before investing.
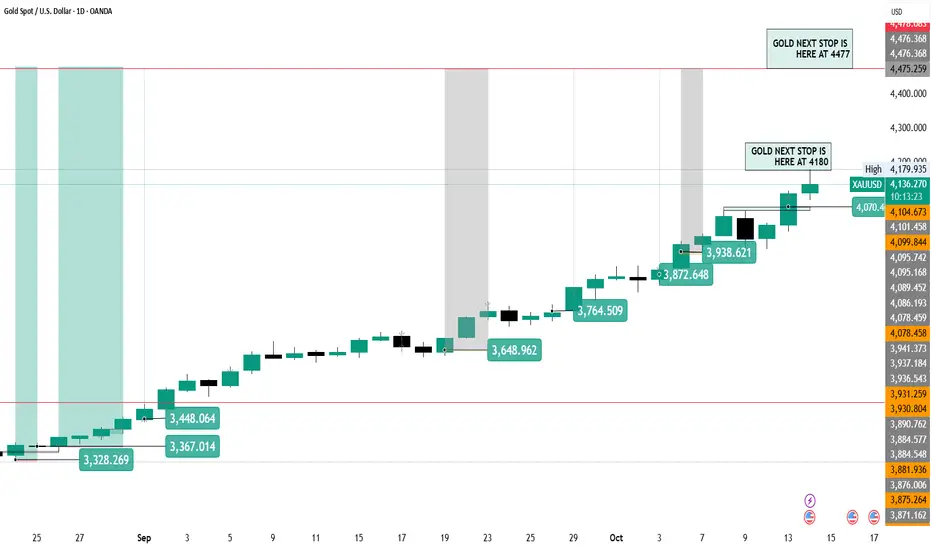
Gold may continue rising — Trading around 4,150–4,200 range📊 Market outlook:
• Spot gold is currently around 4,150 USD/oz.
• It is up roughly +0.20% (≈ +8 USD) over the past 24 hours.
• The rise is supported by expectations that the Federal Reserve (Fed) may cut interest rates soon, making non-yielding assets like gold more attractive.
📉 Technical view (short-term):
• Support zone: ~ 4,130 – 4,140 USD/oz — watch for a retracement bounce.
• Resistance zone: ~ 4,180 – 4,200 USD/oz — a breakout could trigger further gains.
• In a low-interest environment and with ongoing macro uncertainties, gold remains a safe-haven asset — bullish bias continues.
📌 Interpretation:
• In the short term, gold is likely to rise further if expectations of rate cuts remain strong.
• If U.S. economic data comes in stronger and the Fed turns hawkish → a minor correction is possible.
• Current bias: upside, but sensitive to U.S. economic data and Fed signals.
💡 Trading Strategy:
🔺 BUY XAU/USD: 4,135 – 4,132
🎯 TP: 40 / 80 / 200 pips
🛑 SL: 4,129
🔻 SELL XAU/USD: 4,185 – 4,188
🎯 TP: 40 / 80 / 200 pips
🛑 SL: 4,192

This is my next #gold tp in next 2-3 week and hight will be 4477This is my next #gold tp in next 2-3 week and hight will be 4477This is my next #gold tp in next 2-3 week and hight will be 4477This is my next #gold tp in next 2-3 week and hight will be 4477This is my next #gold tp in next 2-3 week and hight will be 4477This is my next #gold tp in next 2-3 week and hight will be 4477This is my next #gold tp in next 2-3 week and hight will be 4477This is my next #gold tp in next 2-3 week and hight will be 4477
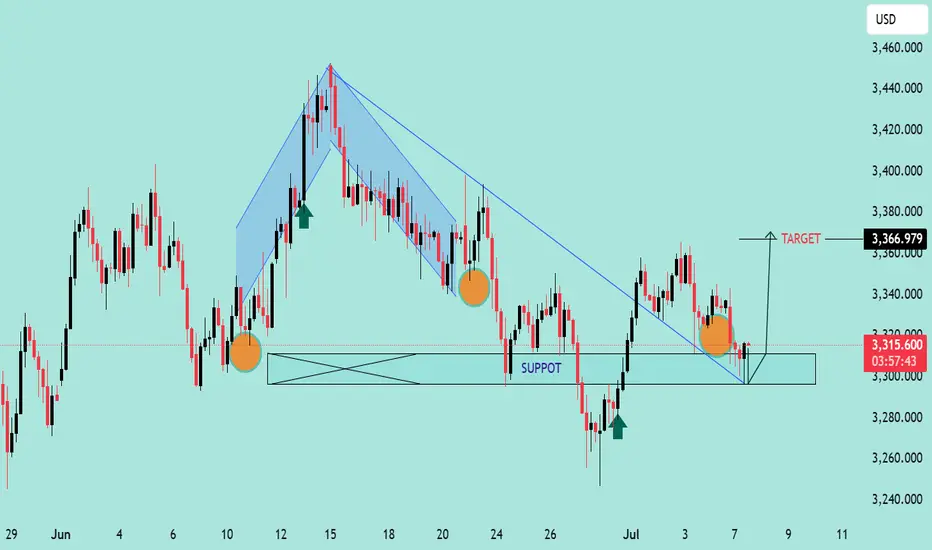
Gold/USD Bullish Reversal from Support Zone Gold/USD Bullish Reversal from Support Zone 🟢📈
Technical Analysis:
Support Zone: Price is consistently respecting the horizontal support range near 3,305 – 3,310, confirming it as a strong demand zone (marked by multiple orange circles and previous bounce reactions).
Bullish Structure: After breaking the descending trendline, the price has retested the trendline and horizontal support zone, forming a higher low — a classic bullish reversal signal.
Target Projection: The measured move projection targets a potential upside near 3,366.979, aligned with previous highs.
Bullish Candlestick Patterns: Green arrows highlight bullish price action at significant reversal points, confirming buyer strength at support.
Harmonic Pattern: The shaded harmonic pattern suggests completion near the previous lows, which aligns with the reversal zone.
Conclusion:
As long as the price holds above the support area and respects the trendline retest, bulls may push toward the projected target. A break below the zone would invalidate this bullish setup.
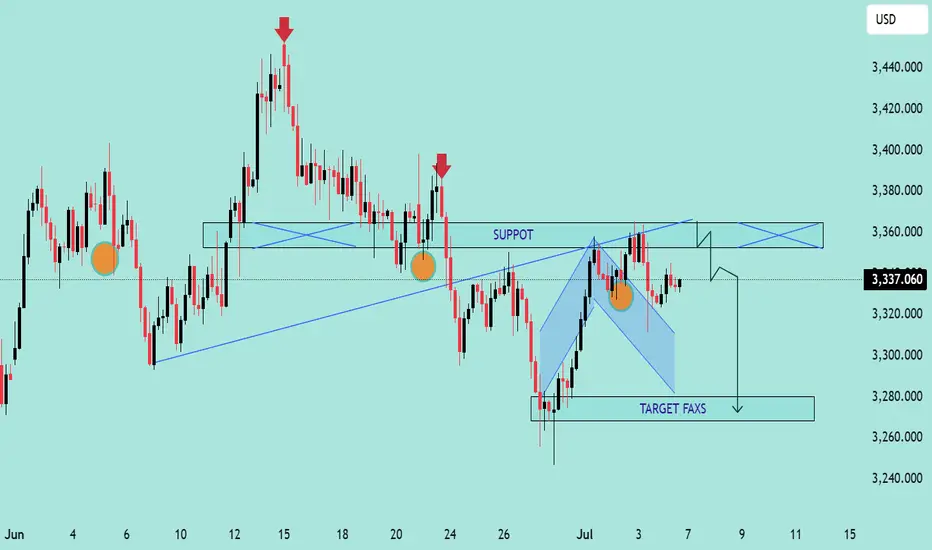
GOLD/USD Bearish Rejection From Resistance Zone – Potential DropGOLD/USD Bearish Rejection From Resistance Zone – Potential Drop Ahead! 🎯
📊 Technical Analysis Summary:
The chart illustrates a bearish setup forming after multiple rejection points near a key resistance zone around 3,360–3,380 USD.
🔍 Key Observations:
🔴 Double Rejection Pattern:
Red arrows highlight strong bearish rejections from resistance.
Indicates sellers are defending this zone aggressively.
🟠 Support Turned Resistance:
The previous support (labelled as "SUPPOT") is now acting as resistance.
Classic bearish retest behavior.
🔷 Bearish Flag Formation:
Price consolidates in a descending flag pattern.
Breakdown below the flag suggests continuation to the downside.
🎯 Target Zone:
If breakdown confirms, price may drop towards target area near 3,275–3,280 USD (marked as “TARGET FAXS”).
🟧 Important Reaction Zones:
Multiple orange circles indicate zones of high reaction – historically significant for both buyers and sellers.
📌 Conclusion:
Unless bulls reclaim the 3,360–3,380 resistance zone convincingly, the bias remains bearish, and the next leg down may target the 3,280 USD area.
🔔 Traders should watch for a clean break below 3,320 to confirm bearish continuation.
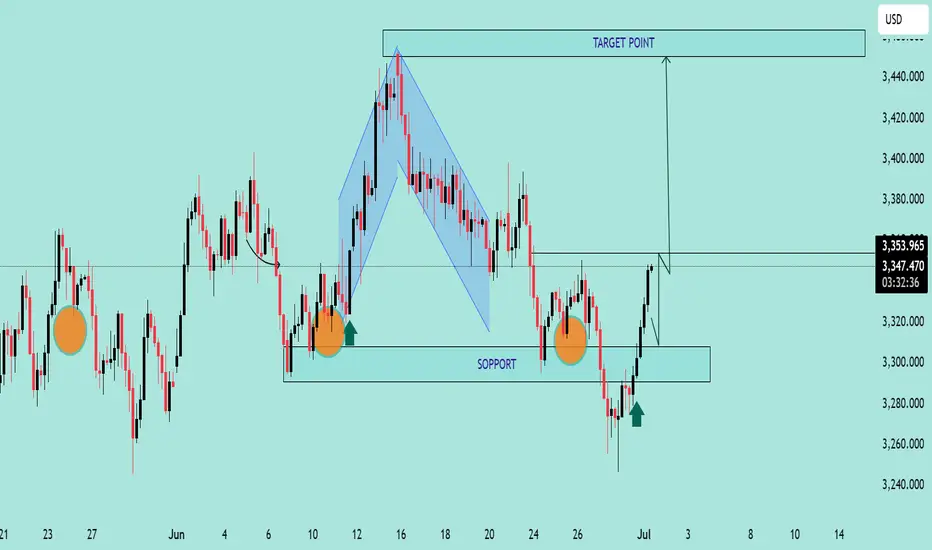
Bullish Reversal Setup on GOLD/USD Bullish Reversal Setup on GOLD/USD 💰📈
🔍 Chart Analysis:
The chart illustrates a clear bullish reversal structure forming off a strong support zone:
📌 Key Observations:
Multiple Rejections at Support 🟠
The price has reacted to the 3,300 - 3,280 USD support zone multiple times, forming a triple bottom pattern, indicating strong buyer interest.
Bullish Harmonic Pattern ✅
A bullish harmonic pattern (likely a Bat or Gartley) completed right at the support level, triggering a strong reversal with a bullish engulfing candle.
Break of Minor Structure 📊
Price broke through minor resistance near 3,340 USD, confirming bullish momentum. The breakout is supported by a retest shown with the green arrow 🟢.
Target Point Identified 🎯
The projected target is 3,460 USD, marked clearly as the next significant resistance zone. This aligns with previous price rejection areas, making it a high-probability target.
📈 Trading Outlook:
✅ Buy Confirmation: Break and retest of 3,340 USD zone.
🎯 Target: 3,460 USD.
🛡️ Support Zone: 3,300 – 3,280 USD (watch for any breakdown below this).
📌 Conclusion:
The chart signals a high-probability bullish continuation, with strong support, harmonic confluence, and structural breakout. Traders may look for buy opportunities on pullbacks with the target set at 3,460 USD. 🚀📊
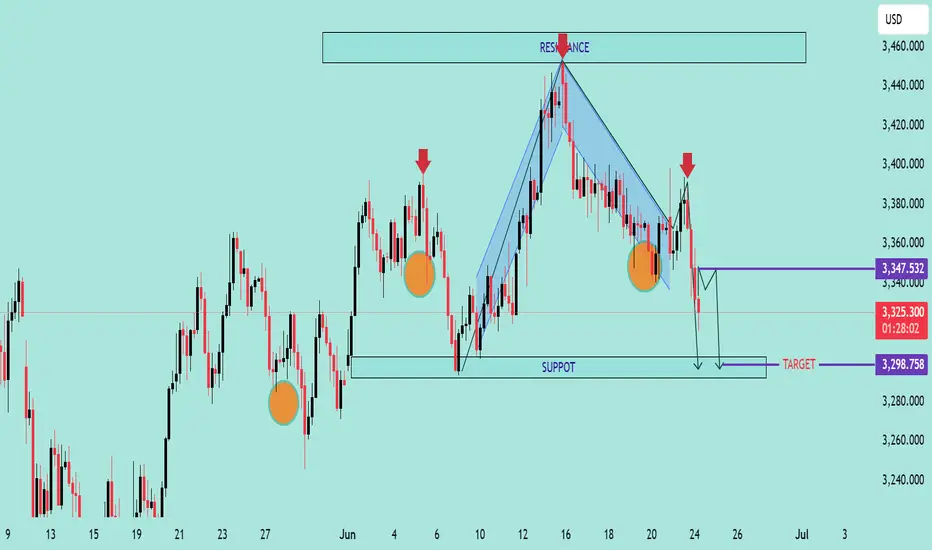
Bearish Continuation Pattern Detected on GOLD/USD Bearish Continuation Pattern Detected on GOLD/USD 📉
📊 Chart Analysis Summary:
The GOLD/USD chart shows a clear bearish continuation pattern, following a rejection from a major resistance zone.
🔍 Key Technical Highlights:
🔺 Resistance Zone:
Strong resistance at 3,420 – 3,440 USD, marked by multiple rejections (🔴 red arrows).
Price formed a Bearish Harmonic Pattern (likely a Gartley or Bat), suggesting reversal from this resistance.
🔻 Bearish Momentum:
After the pattern completed, price broke below the minor support structure and is currently forming lower highs and lower lows, indicating bearish structure.
📉 Support Level:
Strong horizontal support zone around 3,298 – 3,300 USD, marked as “TARGET.”
This area was previously tested (🟠 orange circles) and now projected to act as a target level again.
🔄 Minor Retracement Zone:
Expecting a minor pullback to 3,347 USD (purple line) before potential continuation downward.
This zone aligns with the previous support turned resistance (classic SR flip).
🎯 Target Projection:
Based on the bearish impulse and measured move, the projected target is around 3,298.758 USD, which coincides with the previous support zone.
📌 Conclusion:
The price action suggests a high-probability bearish continuation, targeting the 3,298 USD zone unless the price breaks and holds above 3,347 USD. Traders may consider selling on rallies with a confirmation of rejection at resistance.
📉 Bias: Bearish
📍 Invalidation: Break and daily close above 3,347 USD
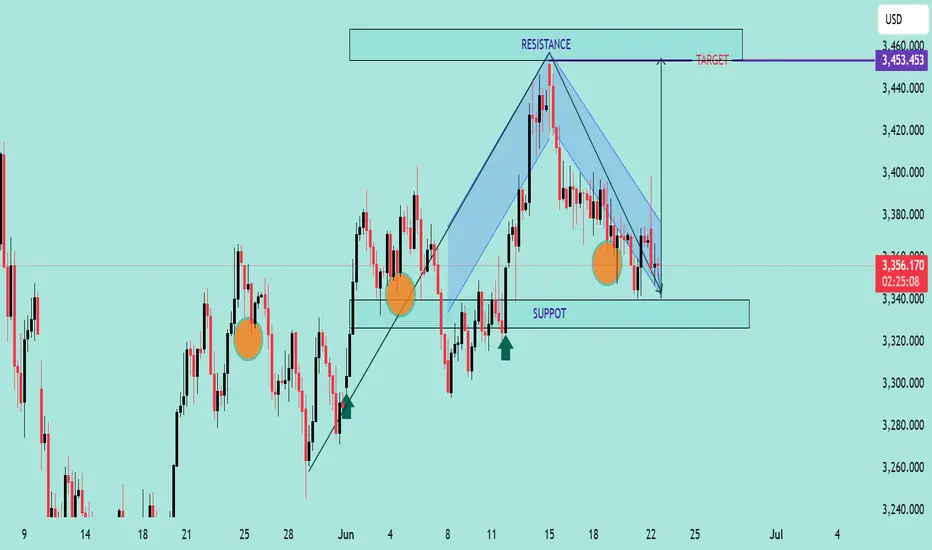
GOLD/USD Falling Wedge Breakout PotentialChart Analysis:
The chart illustrates a Falling Wedge Pattern, a bullish reversal setup typically signaling a breakout to the upside.
📌 Key Observations:
📉 Downward Channel: Price has been compressing within a falling wedge (highlighted in blue), indicating potential exhaustion of sellers.
💪 Support Zone: Strong support observed near the 3,340 level, with price rejecting this zone multiple times (highlighted with orange circles).
🔼 Bullish Signals: Price recently tested the lower wedge boundary and bounced, suggesting potential reversal.
🎯 Breakout Target: Projected target after breakout is around 3,453.453 USD, aligned with previous resistance zone.
🟢 Buy Pressure Arrows: Green arrows signal previous bullish reactions from similar demand zones.
📈 Conclusion:
If price breaks above the wedge’s upper boundary with volume confirmation, a bullish rally toward 3,453 is expected. Keep an eye on breakout retest for entry validation.
✅ Trading Plan Suggestion:
Entry: On breakout above wedge resistance
SL: Below recent swing low (~3,330)
TP: 3,453 zone 🎯
🔔 Note: Wait for a confirmed breakout before entering to avoid false signals.
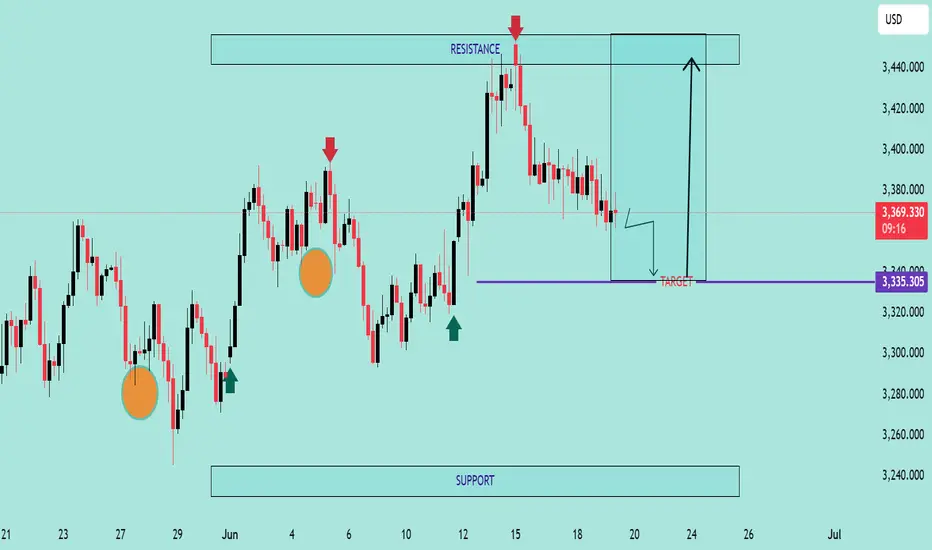
GOLD/USD Support Retest & Breakdown SetupGOLD/USD Support Retest & Breakdown Setup 📉🔍
🔹 Overview:
The chart indicates a potential bearish continuation pattern on GOLD/USD as the price is approaching a key support level at 3,335.305. Previous price action shows multiple rejections from the resistance zone (~3,435), followed by lower highs – a sign of weakening bullish momentum.
📊 Technical Analysis:
🔺 Resistance Zone (~3,435)
Multiple rejections (🔴 red arrows) indicate strong supply pressure.
Price has failed to break above this area thrice, forming a clear ceiling.
🔻 Support Zone (~3,335)
Marked as the target for a short setup.
Price is testing this level again after forming a minor consolidation below lower highs.
A clean break below this purple zone may trigger a continuation to the downside, targeting the broader support range below (~3,240).
🟠 Bearish Structure:
Series of lower highs (highlighted with circles).
Breakdown pattern is developing with declining bullish momentum.
📈 Potential Play:
A confirmed breakdown below 3,335 could lead to a drop toward the next major support.
If support holds, short-term bounce is possible but limited by the dominant resistance.
📌 Conclusion:
GOLD/USD is currently in a bearish setup, with the market eyeing a potential breakdown below a critical support zone. If this level fails to hold, we could see accelerated bearish momentum toward the lower support range.
💡 Caution: Wait for a confirmed close below support before entering any short trades.
GOLD/USD Bearish Rejection at ResistanceGOLD/USD Bearish Rejection at Resistance 📉🟥
🔍 Technical Analysis Overview:
The GOLD/USD chart shows a clear bearish rejection pattern forming near the resistance zone around $3,450, marked with red arrows. After price tested this level twice, strong selling pressure appeared, resulting in a sharp decline.
📌 Key Observations:
🔴 Resistance Zone:
Price was rejected from the resistance area around $3,450 twice, indicating strong seller presence.
Double top-like behavior seen with lower highs confirming weakening bullish momentum.
🟠 Support Zone:
A well-respected support level near $3,250 has been identified based on past reaction (highlighted with orange circles).
Price previously bounced twice from this zone, validating it as a strong support level.
🎯 Target Level:
A near-term target of $3,305.586 is marked, which aligns with previous reaction zones and short-term structure support.
If momentum continues, a deeper push toward $3,250 support is probable.
📉 Bearish Bias Justified By:
Clear rejection from resistance
Lower high formation
Current consolidation with downward bias
Possible breakout to downside if $3,305 fails to hold
⚠️ Risk Note:
If price retraces and breaks back above $3,400 with volume, the bearish setup will be invalidated.
📊 Conclusion:
The chart favors bearish continuation with a primary target around $3,305, and extended downside to $3,250 if bearish pressure sustains. Traders should watch for bearish confirmation patterns below current price before engaging.
🔽 Resistance: $3,450
🔼 Support: $3,250
🎯 Target: $3,305

GOLD/USD Bearish Rejection at Resistance ZoneGOLD/USD Bearish Rejection at Resistance Zone 📉🟥
📊 Technical Overview:
The chart for GOLD/USD shows a clear price action behavior between a well-defined resistance zone (~3,480–3,510) and a support zone (~3,260–3,280).
🔻 Bearish Signals:
The price has tested the resistance zone multiple times (highlighted with red arrows and orange circles) but failed to break above it, indicating strong selling pressure.
The current price action suggests another lower high formation, which is a bearish signal 📉.
Recent candles are rejecting the upward move, pointing to potential downside movement.
🟩 Support Confirmation:
Previous reactions from the support zone (green arrows) show that buyers have consistently stepped in near the 3,260–3,280 range.
This level remains a key demand zone where a bounce might be expected.
🔁 Outlook:
If the price continues to reject the resistance and follows the pattern, we might see another drop towards the support area.
A break below the support zone would confirm a bearish breakout and could open the door to deeper downside targets.
📌 Conclusion:
GOLD/USD is trading within a range, but the repeated failures at resistance suggest bearish momentum might take control in the short term. A move back toward the support zone is likely unless a breakout above resistance occurs.
📉 Resistance: 3,480–3,510
🟩 Support: 3,260–3,280
🔍 Bias: Short-term Bearish unless resistance breaks

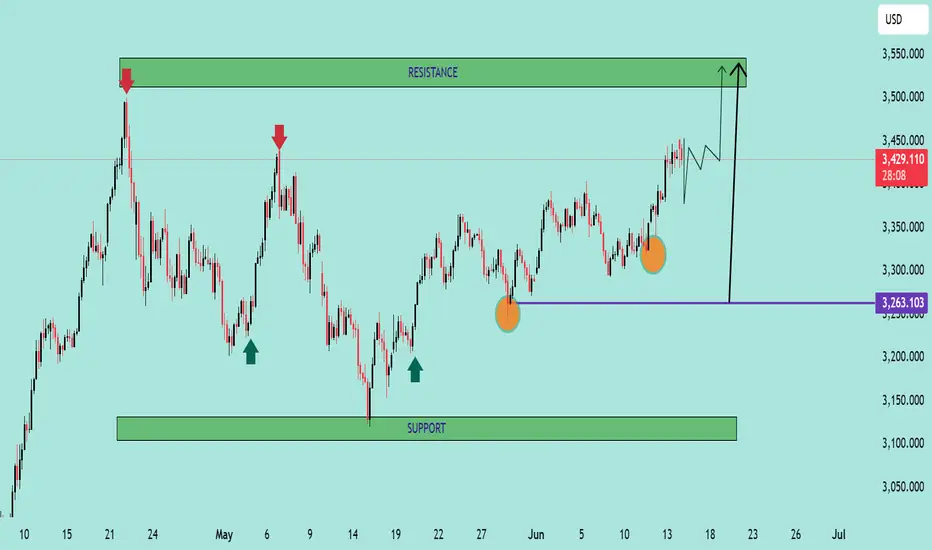
GOLD/USD – Bullish Reversal Pattern ForminGOLD/USD – Bullish Reversal Pattern Forming 🟢📈
📊 Chart Analysis:
The chart shows a strong Inverse Head and Shoulders pattern forming, which is a classic bullish reversal signal:
🔹 Left Shoulder and Right Shoulder – Marked with orange circles, both found support near the 3,263 level (purple line), suggesting strong buying interest at this zone.
🔹 Head – The lowest point in between the shoulders, also bouncing from support.
🔹 Resistance Zone – Marked with red arrows around 3,500–3,520. This zone has rejected price action multiple times in the past.
🔹 Support Zone – Marked below 3,200, where previous consolidation and buying took place.
📈 Projected Move:
The neckline breakout suggests a potential move toward the 3,520+ level. A minor pullback is expected before continuation. If price breaks above resistance, we could see a strong bullish rally.
📌 Key Levels:
Support: 3,263 🟩
Resistance: 3,500–3,520 🟥
Potential Target After Breakout: 3,550+ 🎯
✅ Bias: Bullish above 3,263 support
⚠️ Invalidation: A break below the neckline would cancel the bullish setup
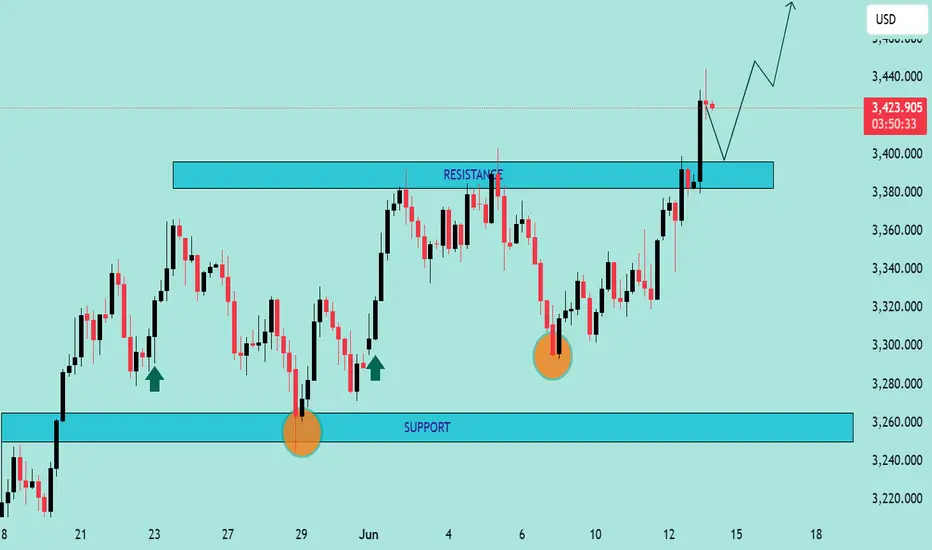
GOLD/USD Bullish Breakout Confirmation GOLD/USD Bullish Breakout Confirmation 🚀📈
📊 Technical Analysis Overview:
The chart illustrates a bullish breakout above a well-defined resistance zone around $3,390–$3,400. Price action has decisively closed above this resistance, suggesting strong bullish momentum.
🔍 Key Observations:
🟦 Support Zone:
Marked clearly between $3,250–$3,280, this level has held firm multiple times (highlighted with green arrows and orange circles), confirming buyer interest and market structure.
🟦 Resistance Turned Support:
The previous resistance zone around $3,390–$3,400 has now potentially turned into a new support. Price retesting this zone and holding would further validate the breakout.
📈 Future Projections:
The chart anticipates a retest-pullback-continuation scenario:
Pullback to new support 📉
Bullish continuation toward $3,460+ 🎯 if support holds.
✅ Bias:
Bullish as long as price remains above the $3,390 zone. Break and hold below would invalidate the bullish setup.
📌 Strategy Tip:
Look for confirmation on the lower timeframes (e.g., bullish engulfing or pin bar) on the retest before entering long.
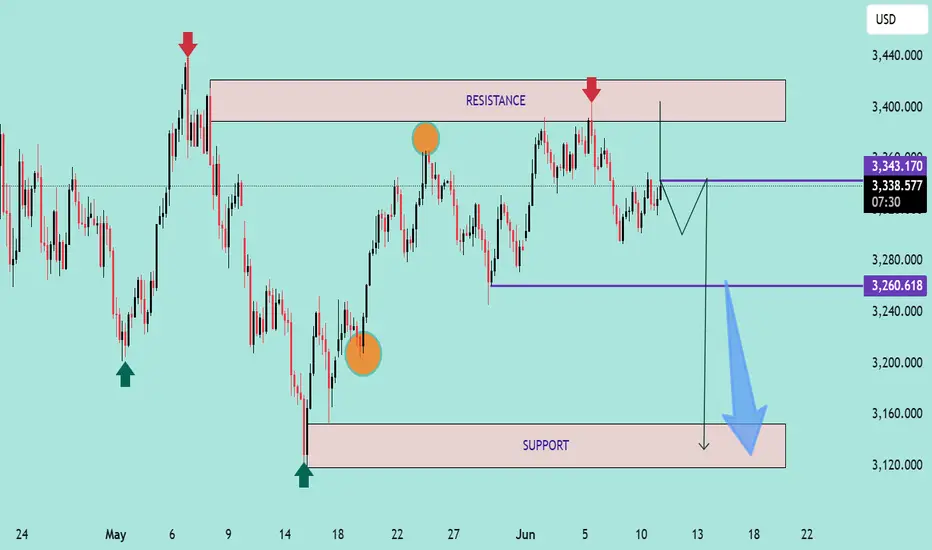
GOLD PRICE ACTION ANALYSIS – June 11, 2025 GOLD PRICE ACTION ANALYSIS – June 11, 2025 🟡
Technical Breakdown & Bearish Scenario Ahead ⚠️📉
🔍 Overview:
The chart presents a clear range-bound structure with strong horizontal resistance around the $3,400–$3,420 zone and support around the $3,120–$3,160 level. Price is currently trading near the upper range of the consolidation.
📊 Key Technical Levels:
🔴 Resistance Zone: $3,400 – $3,420
➤ Price has been rejected here multiple times (highlighted by red arrows and orange circles), showing strong supply pressure.
🟣 Intermediate Support: $3,260.618
➤ This level acted as a minor support and could be tested again if the current pullback deepens.
🟤 Major Support Zone: $3,120 – $3,160
➤ A key demand area where price previously bounced significantly.
📉 Bearish Setup:
A potential lower high is forming just below the resistance zone.
The projected path suggests a minor pullback to form a bearish retest, followed by a potential breakdown below $3,260.
If the $3,260 support is broken decisively, further downside toward the $3,120–$3,160 support is likely (blue arrow projection).
🔄 Bullish Scenario (Invalidation):
A breakout and strong close above $3,420 could invalidate the bearish structure.
In that case, price might attempt to target higher resistance levels beyond $3,440.
📌 Conclusion:
Gold remains in a range with a bearish bias unless the $3,420 resistance is breached.
🔽 Watch for confirmation below $3,260 for bearish continuation.
✅ For bulls, wait for a strong breakout above resistance with volume.
XAU/USD) Bullish trand line analysis Read The ChaptianSMC Trading point update
Technical analysis of Gold Spot (XAUUSD) on the 4-hour timeframe, featuring key support and resistance levels, price action projections, and RSI for momentum evaluation. Here's a breakdown of the idea:
Key Points in the Analysis:
1. Support & Resistance Zones:
Big Support / Buying Zone: Around 3,222 – 3,240. This zone has seen previous bullish reversals and is supported by the 200 EMA.
Intermediate Support Level: Around 3,270–3,290, where price might bounce before attempting a breakout.
Key Resistance Level: Around 3,350–3,365. Price must break this area to move toward higher targets.
2. Price Action Projections:
The analysis shows two bullish potential scenarios:
Scenario 1: Price breaks above the resistance level directly and moves toward the target point at 3,535.83.
Scenario 2: A retracement to the lower support or even the big buying zone before a bullish rally to the same target.
3. RSI (Relative Strength Index):
Currently near the neutral zone (around 49), suggesting there's room for movement in either direction.
No extreme overbought/oversold signals right now.
4. EMA (200):
The price is currently hovering above the 200 EMA (3,222.01), which acts as a long-term support and trend indicator.
Mr SMC Trading point
Summary of the Trading Idea:
Bias: Bullish
Entry Zones: Look for long entries at either the support level (3,270–3,290) or lower buying zone (around 3,222).
Target: 3,435.05 initially, then 3,535.83.
Invalidation: A clear breakdown below the 3,222 support level could invalidate the bullish bias.
Pelas support boost 🚀 analysis follow)

XAU/USD) Bullish Trade Setup – Targeting $3,506.52 with Entry atEntry Point: $3,221.19
Stop Loss: $3,169.80
Resistance Zone: Around $3,277.98 to $3,280.64
Target (TP) Point: $3,506.52 (Approx. 9.05% upside)
📊 Technical Indicators and Markings:
Moving Averages:
Likely a 50-period (blue) and 200-period (red) moving average.
Price is currently below both MAs, signaling a short-term downtrend.
Support & Resistance Zones:
Strong support around $3,207.67–$3,221.19 (entry area).
Resistance at $3,244.25–$3,280.64.
Stop-loss is strategically placed below support to limit downside risk.
Target Area:
Projected upside target is $3,506.52, with a potential 9.05% gain from the entry.
This is marked as the EA (Expert Advisor) Target Point, possibly suggesting this is a strategy from an automated trading system.
Orange Circles:
Likely indicate swing highs and lows, used to identify trend patterns and potential reversal points.
📈 Trading Idea Summary:
Bullish Setup: Buying at support, aiming for breakout above resistance to reach target.
Risk-Reward Ratio: Favorable, assuming price holds above $3,207.
Watch for Confirmation: Price needs to break above resistance around $3,280 for momentum continuation.

XAU/USD) Bullish reversal analysis Read The ChaptianSMC Trading point update
technical analysis of Gold Spot (XAU/USD) on the 4-hour timeframe, projecting a bullish outlook. Here's a breakdown of the main ideas conveyed:
1. Support Level & Double Bottom
A strong support level is marked around the 3,177 area, with the price bouncing from it twice (highlighted by two black dots), indicating a potential double bottom pattern, which is typically a bullish reversal signal.
2. EMA 200 Support
The 200 EMA (Exponential Moving Average) lies just below the current price (~3,177), acting as dynamic support. The fact that price is holding above it adds strength to the bullish argument.
3. Bullish Divergence on RSI
The RSI (Relative Strength Index) shows a bullish divergence, where the price made lower lows but RSI made higher lows—another potential reversal indicator.
4. Price Projection
If the bullish move plays out, the chart outlines two upward targets:
Target Point: ~3,501.67
Next Target Point: ~3,729.23
These are based on measured moves from previous impulse legs (shown by vertical blue projections).
5. Entry Setup
The chart suggests a break above the short-term consolidation could trigger the bullish run toward the first target, aligning with bullish price structure and support confirmation.
Mr SMC Trading point
---
Overall Idea: The chart expects a bullish reversal from support, confirmed by double bottom, EMA 200 support, and RSI divergence, targeting higher resistance zones.
Pales support boost 🚀 analysis follow)

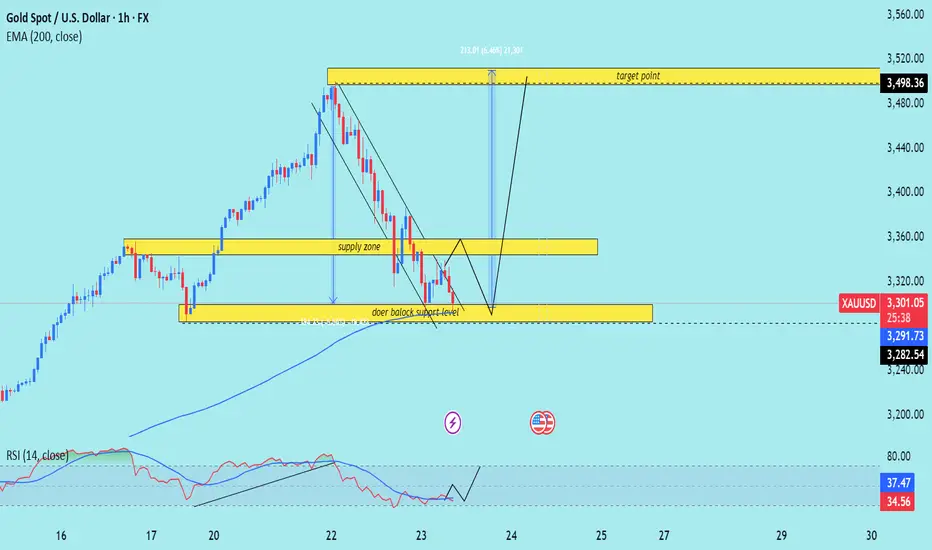
XAU/USD) orderblok key Support Analysis Read The ChaptianSMC Trading point update
technical analysis of Gold Spot against USD (XAUUSD) on the 1-hour timeframe. Here's a breakdown of the key ideas presented:
Chart Analysis Summary:
1. Price Zones:
Supply Zone (Resistance): Around the 3,355–3,365 level.
Demand/Support Zone (Doer Block Support Level): Around 3,282–3,291.
2. Current Price Action:
Price is currently at $3,331.96, close to the supply zone, and bouncing between the zones.
There’s a sharp downtrend, which seems to be slowing down near the support level.
3. Projected Move:
The chart suggests a short-term dip back into the demand/support zone, followed by a bullish reversal.
Target Point: A move back up toward $3,498.36, which is marked as a significant resistance.
4. Technical Indicators:
RSI (Relative Strength Index): Currently around 36.64 and recovering, suggesting potential bullish divergence or an oversold condition.
200 EMA: Around $3,291.52, providing dynamic support — aligning with the lower demand zone.
Mr SMC Trading point
Trade Idea:
Buy Setup (Long Trade):
Entry: Near 3,282–3,291 (support zone).
Target: 3,498.36.
Stop Loss: Below the support zone (~3,270).
Overall Idea:
This is a reversal-based setup. The price is expected to retest the support before launching a bullish leg toward the target. The confluence of the EMA, support zone, and RSI near oversold adds weight to the potential for a bounce.
Pelas support boost 🚀 analysis follow)
XAU/ USD) bullish trend analysis Read The ChaptianSMC Trading point update
analysis for XAUUSD (Gold vs. USD) on the 2-hour timeframe appears to suggest a bullish continuation setup after a correction. Here's a breakdown of the idea:
Key Points from the Chart:
1. Rising Channel:
The price is moving within an ascending channel.
After a breakout and strong rally, it is currently in a flag or wedge-like correction pattern.
2. Correction Zone:
The price is consolidating downward inside a small descending wedge (a bullish pattern), potentially forming a bull flag.
This is typically a sign of continuation after a strong upward impulse.
3. Support Zone:
A 4H support level is marked around 3,301.416, which aligns with the lower boundary of the flag pattern.
This is a potential buy zone for price to react and bounce.
4. Target Point:
The target is projected at 3,404.254, implying a breakout to the upside if the support holds.
5. RSI Indicator:
RSI is currently around 65, with previous values near 80, suggesting a slight cooldown but still in bullish territory.
A slight drop in RSI might occur before the next bounce.
6. EMA 200:
The EMA 200 is well below current price (around 3,137), indicating a strong bullish trend.
Mr SMC Trading point
Possible Trade Idea:
Entry: Around the 3,301–3,305 support area.
Confirmation: Wait for a bullish reversal pattern (engulfing candle or strong bounce).
Target: Around 3,404 (as per the marked target zone).
Stop Loss: Below the support zone (e.g., below 3,295), depending on risk tolerance.
Pales support boost 🚀 analysis follow)

XAU/USD) Bearish trand analysis Read The ChaptianSMC Trading point update
This chart analysis is for Gold Spot (XAU/USD) on the 1-hour timeframe. Here’s a breakdown of the idea shown:
---
Key Points in the Analysis:
1. Current Price:
XAU/USD is around $2,982.92 at the time of the chart.
2. Trend:
The chart suggests a bearish outlook.
Price has been consistently rejected from the yellow supply zone (around 3,020–3,033).
EMA 200 (blue line) is above the current price, confirming downward momentum.
3. Rejection Zone:
Marked in yellow between 3,020 and 3,033. Labeled as “Reject points”.
Price failed to break above this zone multiple times.
4. Breakout Pattern:
Two descending rectangles highlight bearish continuation patterns.
A bearish flag or wedge is visible, followed by a breakout downward.
5. Target Zone:
Highlighted in yellow between 2,900 and 2,921, with target point at 2,920.615.
Price is expected to move down to this level.
6. RSI (Relative Strength Index):
RSI is declining and shows bearish divergence, supporting downside move.
Currently around 39.19, which is closer to oversold territory but still has room to drop.
Mr SMC Trading point
---
Trade Idea Summary:
Bias: Bearish
Entry Area: Rejection near 3,020–3,033 zone
Target: 2,920.615 (highlighted support zone)
Stop Loss: Could be placed above 3,033 (supply zone or EMA 200)
Confluence Factors:
EMA 200 rejection
Bearish RSI divergence
Repeated supply rejection
Breakout from bear flag structures
Pales support boost 🚀 analysis follow)

XAU/USD) bearish rejected fvg analysis Read The ChaptianSMC Trading point update
This chart analysis of Gold (XAU/USD) on the 2-hour timeframe appears to be a bearish setup based on Smart Money Concepts (SMC). Here's a breakdown
Key Elements:
1. Price Channel Break & CHoCH:
The price was in a rising channel.
A clear Change of Character (CHoCH) occurred after the price broke below the structure, signaling a shift from bullish to bearish.
2. Fair Value Gap (FVG):
There's a bearish Fair Value Gap (FVG) highlighted in the yellow box around the 3,047–3,075 level.
The expectation is that price may retrace into this FVG before continuing downward.
Mr SMC Trading point
3. Target Zone:
A major demand zone or target point is marked around 2,940, indicating a potential bearish move of around -148 points (~4.8%) from the FVG.
4. EMA & RSI:
200 EMA is around 3,047, acting as dynamic resistance now.
RSI is below 40 and trending down, showing bearish momentum with slight bullish divergence, hinting at a short retracement before another drop.
---
Summary of the Idea:
Bias: Bearish
Trade Plan:
Wait for price to retrace into the FVG zone (~3,047–3,075).
Look for bearish confirmation (like bearish engulfing or rejections).
Enter short with a target at 2,940, stop above FVG.
Pales support boost 🚀 analysis follow)

This chart shows a potential bullish setup for Gold (XAUUSD) on This chart shows a potential bullish setup for Gold (XAUUSD) on the 15-minute timeframe, with some key technical elements and a projected trade idea. Here's a breakdown of the analysis:
1. Current Market Overview
Price: Trading around $3,038.51.
Trend: Recent downtrend followed by a minor recovery.
Indicators:
EMA 200 (Blue): Currently at $3,090.41, acting as a dynamic resistance.
EMA 30 (Red): Positioned below the EMA 200, indicating a still bearish trend but with potential for a pullback.
2. Key Zones & Labels
Limit Entry Zone: Highlighted around $3,025.72 (bottom purple zone)
Labeled as “LIMIT ENTRY”, indicating a potential buy entry.
This area corresponds with a fair value gap (fvg) — often used in smart money concepts as a sign of institutional interest.
Target Zone: Around $3,082.22 (top purple zone)
Labeled as “target point EA”.
Lies just below the EMA 200 resistance level, which is a likely take-profit area for a bullish move.
3. Projected Price Action
A possible bullish retracement is anticipated:
Dip into the limit entry/fvg zone at ~$3,025.
Then, a rally targeting the $3,082 zone, possibly extending toward the EMA 200 at ~$3,090.
4. Trade Setup (Based on the Chart)
Entry: Around $3,025.72 (limit buy)
Target: Between $3,082.22 - $3,090.41
Risk: Likely below the FVG zone (~$3,015–$3,020), depending on risk appetite.
