Safe-Haven Assets Demand (Gold, Treasuries)🟡 Gold as a Safe-Haven Asset
Historical Role and Psychological Appeal
Gold has been regarded as a store of value for thousands of years. Unlike fiat currencies, it is not issued by any government and cannot be created at will. This intrinsic scarcity gives gold a reputation as a hedge against currency debasement, inflation, and systemic financial collapse. During crises—such as wars, financial crashes, or inflationary spirals—investors often flock to gold because it is perceived as tangible and universally valuable.
The psychological component of gold demand is significant. In times of uncertainty, trust in financial institutions or paper assets may weaken. Gold, being a physical asset, provides reassurance. It is not subject to default risk and does not rely on a counterparty’s promise to pay.
Gold During Economic Stress
Gold prices typically rise during:
Stock market downturns
High inflation periods
Currency depreciation
Geopolitical tensions
Banking crises
For example, during the 2008 global financial crisis, gold prices increased substantially as investors sought safety amid collapsing financial institutions. Similarly, during the COVID-19 pandemic in 2020, gold reached record highs as economic uncertainty intensified.
Inflation Hedge
Gold is often described as a hedge against inflation. When inflation erodes the purchasing power of currency, gold tends to maintain its real value over the long term. Although the relationship is not perfect in the short run, over extended periods gold has preserved wealth during inflationary cycles.
Portfolio Diversification
Gold also plays a diversification role. It often exhibits low or negative correlation with equities and other risk assets. By adding gold to a portfolio, investors can potentially reduce overall volatility. Institutional investors, central banks, and retail investors alike incorporate gold to manage systemic risk exposure.
🏛️ United States Treasury securities as a Safe-Haven Asset
Credit Quality and Government Backing
U.S. Treasury securities—such as Treasury bills, notes, and bonds—are debt instruments issued by the U.S. government. They are widely considered among the safest investments in the world because they are backed by the “full faith and credit” of the United States government.
Unlike corporate bonds, Treasuries carry minimal default risk. The U.S. government has the authority to tax and issue currency, making the probability of outright default extremely low relative to other borrowers.
Flight to Safety
When financial markets become volatile, investors often engage in what is called a “flight to safety.” This involves selling risky assets like stocks or emerging market securities and reallocating funds into Treasuries. Increased demand for Treasuries pushes their prices up and yields down.
This inverse relationship between price and yield is central to understanding Treasury market behavior. During crises, Treasury yields frequently fall sharply as investors seek protection.
Liquidity and Market Depth
Another key reason Treasuries serve as a safe haven is liquidity. The U.S. Treasury market is one of the largest and most liquid financial markets in the world. Investors can quickly buy or sell large quantities without significantly affecting prices. In times of stress, liquidity becomes extremely valuable, and Treasuries provide that stability.
Role in Monetary Policy
Treasuries also serve as critical instruments in global finance. Central banks use them in open market operations, and they function as benchmark rates for other financial assets. Their deep integration into the financial system reinforces their safe-haven status.
Drivers of Safe-Haven Demand
Safe-haven demand for gold and Treasuries is influenced by several interconnected factors:
1. Economic Uncertainty
Recession fears, weak economic data, or financial instability often increase demand for safe assets. Investors prioritize capital preservation over high returns.
2. Geopolitical Risk
Wars, trade conflicts, political instability, and sanctions can trigger global uncertainty. Gold, being internationally recognized and not tied to a specific government, becomes attractive. Meanwhile, Treasuries benefit from the U.S. dollar’s reserve currency status.
3. Inflation and Currency Risk
If inflation accelerates or currency values decline, investors may hedge by purchasing gold. In contrast, during deflationary shocks, Treasuries become more attractive due to falling yields and capital gains potential.
4. Market Volatility
Spikes in volatility indices often coincide with increased safe-haven flows. Investors rebalance portfolios toward lower-risk assets when uncertainty rises.
Differences Between Gold and Treasuries
Although both are safe havens, they respond differently to economic conditions.
Gold performs well during inflationary crises and when trust in fiat currency weakens.
Treasuries perform well during deflationary recessions and liquidity crunches.
Treasuries generate interest income, while gold does not. Therefore, when real interest rates rise significantly, gold can become less attractive because it has an opportunity cost. Conversely, when real yields are low or negative, gold demand typically strengthens.
Gold is also influenced by central bank purchases and global jewelry demand, while Treasuries are influenced by fiscal policy, monetary policy, and debt issuance levels.
Central Banks and Institutional Demand
Central banks play a significant role in safe-haven markets. Many central banks hold gold as part of their foreign exchange reserves. In recent years, several countries have increased gold holdings to diversify away from U.S. dollar dependence.
At the same time, global investors—including pension funds, insurance companies, and sovereign wealth funds—hold large quantities of U.S. Treasuries as reserve assets. The dollar’s status as the world’s primary reserve currency enhances Treasury demand, especially during crises.
Impact on Financial Markets
Safe-haven demand can significantly influence asset prices and capital flows:
Equity markets may decline as funds rotate into safer assets.
Treasury yields often fall sharply during panic-driven buying.
Gold prices may spike during geopolitical shocks.
Emerging market assets can experience capital outflows.
These flows reflect investor sentiment and risk perception. Monitoring safe-haven demand provides clues about broader market confidence.
Limitations of Safe-Haven Assets
Despite their reputation, gold and Treasuries are not risk-free in all scenarios.
Gold can experience significant short-term volatility. It does not generate income and can underperform during periods of strong economic growth and rising interest rates.
Treasuries carry interest rate risk. If inflation rises unexpectedly and bond yields increase, Treasury prices can decline. Additionally, long-term fiscal sustainability concerns could affect confidence, although historically Treasuries have maintained strong credibility.
Modern Developments
In recent years, safe-haven demand has been influenced by:
Ultra-low and negative interest rate environments
Large-scale quantitative easing
Rising geopolitical tensions
High global debt levels
Some investors have also considered alternative safe havens, such as certain currencies or even digital assets. However, gold and Treasuries remain dominant due to their long-standing trust, liquidity, and institutional backing.
Conclusion
Safe-haven assets like gold and U.S. Treasury securities play a critical role in global financial markets. Their demand rises when uncertainty increases, reflecting investor preference for stability over growth. While gold provides protection against inflation and currency debasement, Treasuries offer security, income, and liquidity during economic downturns.
Together, they serve as cornerstones of defensive investment strategies. By observing shifts in safe-haven demand, analysts and policymakers can better understand market sentiment, systemic risk, and macroeconomic expectations.
Goldmarket

Precious metals (Gold, Silver, Platinum)1. GOLD (Au)
1. Basic Information
Chemical symbol: Au (from Latin Aurum).
Atomic number: 79.
Bright yellow, dense, soft metal.
One of the least reactive chemical elements.
Found in pure (native) form in nature.
2. Physical Properties
Highly malleable (can be hammered into thin sheets).
Highly ductile (can be drawn into thin wires).
Excellent conductor of electricity.
Does not tarnish or rust.
Very dense (19.3 g/cm³).
Melting point: 1064°C.
Boiling point: 2856°C.
3. Chemical Properties
Resistant to corrosion and oxidation.
Does not react with oxygen under normal conditions.
Dissolves in aqua regia (mixture of nitric and hydrochloric acid).
Forms alloys easily with other metals.
4. Uses of Gold
Jewelry and ornaments.
Investment (coins, bars, bullion).
Central bank reserves.
Electronics (connectors, circuit boards).
Dentistry (crowns, fillings).
Aerospace components.
Medical applications (certain treatments).
Awards and medals.
5. Economic Importance
Considered a safe-haven asset.
Used as hedge against inflation.
Historically used as currency.
Affects global financial markets.
Traded on commodity exchanges.
6. Sources and Mining
Mined in countries like China, Australia, Russia.
Extracted from underground mines.
Also recovered from river sediments (placer mining).
Recycled from old jewelry and electronics.
7. Advantages
Long-lasting value.
High liquidity.
Portable wealth storage.
Universal acceptance.
8. Disadvantages
Expensive.
Mining causes environmental damage.
Price volatility.
2. SILVER (Ag)
1. Basic Information
Chemical symbol: Ag (from Latin Argentum).
Atomic number: 47.
Shiny white metallic element.
More abundant than gold.
Highly reflective metal.
2. Physical Properties
Best electrical conductor among metals.
Best thermal conductor.
Highly malleable and ductile.
Density: 10.49 g/cm³.
Melting point: 961.8°C.
Boiling point: 2162°C.
3. Chemical Properties
Reacts with sulfur compounds (tarnishes).
Forms silver sulfide when exposed to air.
Dissolves in nitric acid.
Forms alloys with copper.
4. Uses of Silver
Jewelry and silverware.
Coins and investment bars.
Electronics and electrical contacts.
Solar panels.
Photography (silver nitrate).
Mirrors and coatings.
Medical instruments.
Antibacterial applications.
Batteries.
Catalysts in chemical reactions.
5. Industrial Importance
Widely used in renewable energy.
Important in semiconductor industry.
Used in 5G technology components.
Increasing demand in electric vehicles.
6. Sources and Mining
Major producers: Mexico, Peru, China.
Often mined as by-product of copper, lead, zinc mining.
Extracted through underground and open-pit mining.
7. Advantages
More affordable than gold.
High industrial demand.
Good investment diversification.
Excellent conductivity.
8. Disadvantages
Tarnishes easily.
More price volatility.
Storage bulkier than gold (lower value density).
3. PLATINUM (Pt)
1. Basic Information
Chemical symbol: Pt.
Atomic number: 78.
Silvery-white metal.
Rarer than gold.
Extremely dense and durable.
2. Physical Properties
Density: 21.45 g/cm³.
Very high melting point (1768°C).
Strong and corrosion-resistant.
Malleable and ductile.
Good conductor of electricity.
Highly stable at high temperatures.
3. Chemical Properties
Resistant to oxidation.
Does not corrode easily.
Acts as excellent catalyst.
Dissolves in aqua regia.
Forms alloys with other metals.
4. Uses of Platinum
Catalytic converters in vehicles.
Jewelry (premium category).
Laboratory equipment.
Medical devices.
Cancer treatment drugs (cisplatin).
Petroleum refining.
Fuel cells.
Chemical industry catalysts.
Investment coins and bars.
5. Industrial Importance
Essential for reducing vehicle emissions.
Important in hydrogen fuel technology.
Used in glass manufacturing.
Critical in clean energy transition.
6. Sources and Mining
Major producers: South Africa, Russia.
Extracted from deep underground mines.
Mining process is complex and costly.
Limited global supply.
7. Advantages
Very durable.
High industrial value.
Rare and prestigious.
Hypoallergenic (good for sensitive skin).
8. Disadvantages
Expensive mining cost.
Industrial demand affects price.
Less liquid market compared to gold.
Price fluctuations linked to automotive industry.
4. COMPARISON OF GOLD, SILVER, AND PLATINUM
Gold is mainly a monetary metal.
Silver is both monetary and industrial.
Platinum is primarily industrial.
Platinum is rarer than gold.
Silver is more abundant.
Platinum has highest density.
Silver has best electrical conductivity.
Gold is most corrosion-resistant.
Platinum has highest melting point.
Silver is most affordable.
Gold is most stable investment.
Platinum demand depends on automobile industry.
Silver demand depends on industrial growth.
Gold demand depends on economic stability.
All three are traded globally.
All are considered precious metals.
Used in jewelry worldwide.
All have high resale value.
Stored as wealth for centuries.
Important in global economy.
5. ROLE IN INVESTMENT
Hedge against inflation.
Portfolio diversification.
Protection during economic crisis.
Tangible asset.
Can be held physically.
Also traded as ETFs.
Futures contracts available.
Used in retirement portfolios.
Global demand influences price.
Supply constraints affect market value.
6. ENVIRONMENTAL AND SOCIAL IMPACT
Mining can cause deforestation.
Water pollution from mining chemicals.
Energy-intensive extraction processes.
Labor issues in mining regions.
Recycling reduces environmental harm.
Sustainable mining practices increasing.
Ethical sourcing becoming important.
Government regulations applied.
Environmental rehabilitation required.
Shift toward greener extraction methods.
7. CONCLUSION
Gold represents stability and wealth.
Silver represents industrial growth and affordability.
Platinum represents rarity and advanced technology.
All three metals play crucial roles in economy.
They are essential in modern industries.
They serve as investment tools.
Their value depends on supply and demand.
They have historical importance.
They remain relevant in modern financial systems.
Precious metals continue to shape global markets.

Gold & Silver as Safe Haven AssetsFactors Driving Gold & Silver Safe Haven Demand
Several macroeconomic and geopolitical factors dictate the demand for gold and silver as safe havens:
Inflation and Currency Depreciation
When inflation accelerates, the purchasing power of fiat currency declines. Investors often turn to gold and silver to preserve wealth. Historically, gold has outperformed during high inflation periods due to its finite supply. Silver, while also a hedge, can experience higher volatility due to its industrial applications.
Geopolitical Tensions
Wars, political instability, and global conflicts tend to increase demand for safe havens. Gold, being globally recognized, often rallies during crises. For example, gold prices surged during the 2008 financial crisis and geopolitical conflicts in the Middle East.
Financial Market Volatility
Equity and bond market instability drives investors to allocate funds into gold and silver. These metals often have a low or negative correlation with traditional assets like stocks, making them effective portfolio diversifiers.
Central Bank Policies
Expansionary monetary policies, low interest rates, and quantitative easing can weaken currencies, prompting investors to shift to gold. Central banks themselves hold gold reserves, and their buying or selling activity can significantly impact prices.
Currency Fluctuations
Gold is typically priced in US dollars. A weakening dollar often boosts gold demand globally, whereas a stronger dollar can depress gold prices. Investors may use gold as a hedge against currency depreciation in local currencies.
Safe Haven Strategies for Gold & Silver
Investors employ various strategies to utilize gold and silver for capital preservation and risk management. These strategies vary depending on risk tolerance, investment horizon, and market conditions.
1. Physical Ownership
Physical ownership remains the most direct method. This includes coins, bars, and bullion. The advantages are tangible asset holding, no counterparty risk, and universal acceptance. Key considerations include storage, security, and liquidity. Investors often maintain 5-15% of their portfolio in physical metals as a hedge.
2. Exchange-Traded Funds (ETFs)
Gold and silver ETFs provide exposure without the need to physically store metals. ETFs like SPDR Gold Shares (GLD) or iShares Silver Trust (SLV) track the price of the underlying metal. ETFs offer high liquidity, ease of trading, and lower transaction costs, making them suitable for both short-term hedging and long-term protection.
3. Futures and Options
Derivative contracts allow strategic exposure to gold and silver price movements. Futures contracts can hedge against currency devaluation or portfolio risk. Options, including calls and puts, provide leverage and flexibility to profit from price swings or hedge against downside risks. However, derivatives involve higher complexity and risk, and they are suitable primarily for sophisticated investors.
4. Mining Stocks and ETFs
Investing in gold and silver mining companies provides indirect exposure to metal prices. Mining stocks often outperform physical metals during strong rallies due to operational leverage. Mining ETFs, such as the VanEck Vectors Gold Miners ETF (GDX), offer diversified exposure across the sector. Risks include operational and geopolitical factors affecting mining operations.
5. Portfolio Diversification
Incorporating gold and silver into a diversified portfolio can reduce overall volatility. Traditional safe haven allocation ranges from 5% to 20%, depending on risk appetite and market conditions. During crises, these allocations may increase to protect wealth and maintain liquidity.
6. Currency Hedge Strategy
Gold and silver serve as effective hedges against local currency depreciation. Investors in emerging markets, for example, often shift part of their portfolio into USD-denominated gold to preserve value against domestic currency weakness.
7. Systematic Investment
Dollar-cost averaging (DCA) into gold and silver mitigates timing risk. By investing fixed amounts at regular intervals, investors accumulate metals at varying price points, reducing the impact of short-term volatility. This is particularly effective in long-term wealth preservation strategies.
8. Crisis-Triggered Allocation
Some investors follow a reactive strategy, allocating funds to gold and silver only during market stress or geopolitical uncertainty. While this approach can maximize returns during crises, it requires precise timing and continuous monitoring of global events.
Risk Management and Considerations
Even as safe havens, gold and silver are not risk-free. Investors must account for price volatility, storage costs, and liquidity risks. Key considerations include:
Price Volatility: While gold is relatively stable, silver can experience sharp swings due to industrial demand and speculative trading.
Opportunity Cost: Holding metals in lieu of higher-yielding assets may reduce returns in bull equity markets.
Liquidity Needs: Physical metals may be less liquid than ETFs or stocks.
Market Timing: Buying during price spikes can reduce long-term returns.
Balancing safe haven strategies with other portfolio components ensures optimal protection without sacrificing growth potential. A combination of physical metals, ETFs, and mining stocks can provide diversification across risk levels and investment horizons.
Behavioral Aspects and Investor Psychology
Safe haven strategies are also driven by behavioral factors. Fear, uncertainty, and panic often amplify demand for gold and silver. Historically, during crises, investors flock to these metals even if underlying fundamentals remain stable. Understanding these psychological drivers can help investors time entries and exits more effectively. Long-term investors may avoid panic-driven purchases and maintain consistent allocations to metals as part of a disciplined risk management plan.
Case Studies of Safe Haven Performance
2008 Financial Crisis: Gold surged from around $800 to over $1,000 per ounce as equity markets collapsed, demonstrating its crisis resilience.
COVID-19 Pandemic (2020): Both gold and silver rallied sharply amid unprecedented fiscal and monetary stimulus. Gold reached all-time highs, while silver doubled in value, highlighting its dual safe haven and industrial appeal.
Geopolitical Conflicts: In periods like the Russia-Ukraine conflict, gold demand spiked globally, emphasizing its role as a geopolitical hedge.
These examples underscore that gold and silver provide a reliable buffer against systemic risk, preserving wealth and reducing portfolio drawdowns.
Conclusion
Gold and silver remain cornerstone assets in safe haven strategies, offering protection against inflation, currency depreciation, financial market volatility, and geopolitical risks. Strategies range from physical ownership and ETFs to derivatives, mining stocks, and systematic investment plans. While gold is historically more stable, silver provides higher upside potential but with greater volatility.
Effective safe haven strategies integrate these metals into a diversified portfolio, balancing risk and liquidity needs while considering market conditions and behavioral factors. By maintaining a disciplined approach and aligning allocations with risk tolerance, investors can harness the wealth-preserving power of gold and silver, ensuring resilience in uncertain economic environments.

GOLD (XAU/USD) – Bullish Continuation Toward Premium Zone🔍 Technical Analysis Breakdown
Market Structure: Clear bullish structure with higher highs & higher lows intact ✔️
Trendline: Price continues to respect the ascending trendline, confirming strong upside momentum 📈
Breakouts: Multiple confirmed bullish breakouts from consolidation and range zones 🔓
Volume: Strong bullish volume expansion during impulsive moves, validating institutional participation 💥
POI (Point of Interest): Repeated reactions from POI zones, acting as reliable demand areas 🎯
Pivot Point: The green pivot zone is holding as dynamic support after the pullback 🟩
Pullback: Current retracement is corrective and healthy, indicating accumulation before continuation 🔄
🎯 Targets & Trade Projection
Primary Target (TP1): 🟢 4,850 – 4,860
Extended Target (TP2): 🟢 4,890 – 4,920 (premium supply / liquidity zone)
Bullish Continuation Zone: Grey consolidation box → expected higher-low formation then expansion ⬆️
🛑 Invalidation / Risk Level
Bias invalidated below: ❌ 4,740 – 4,720 (High Pivot / trendline break)
✨ Trade Bias: Bullish Continuation
📍 Strategy: Buy pullbacks above pivot | Hold longs while trendline holds
📌 Key Message:
As long as GOLD holds above the pivot point + rising trendline, the path of least resistance remains upward toward the marked targets 🚀💰

How does today’s gold top compare to the 1980 and 2011 peaks?Gold is not just at a nominal high — it is trading at the highest real (inflation-adjusted) price in modern history.
How does today’s gold top compare to the 1980 and 2011 peaks?
1️⃣ GOLD MAJOR TOPS — NOMINAL vs REAL (TODAY’S MONEY)
🔴 1980 GOLD TOP (true panic peak)
Nominal price (1980): ~$850/oz
Inflation-adjusted to today: ~$3,200–3,400/oz
What the world looked like:
Double-digit inflation
Oil crisis
Cold War escalation
Dollar confidence collapse
Real rates deeply negative
Monetary panic
Meaning: This was a once-in-a-generation monetary crisis peak.
🟠 2011 GOLD TOP (QE / crisis fear)
Nominal price (2011) : ~$1,920/oz
Inflation-adjusted to today : ~$2,600–2,700/oz
What the world looked like:
Global Financial Crisis aftermath
QE everywhere
Eurozone debt crisis
Fear of currency debasement
Inflation still relatively controlled
Meaning: This was a financial-system fear peak, not a currency collapse.
🟡 TODAY (2025–26) GOLD ~ $4,584
Nominal price : ~$4,584/oz (new high)
Inflation-adjusted: $4,584 (today’s dollars by definition)
Compared to past real peaks:
~35–45% above the 1980 real peak (~$3,300 mid-range)
~70–75% above the 2011 real peak (~$2,650 mid-range)
This is extremely important : today’s gold price is already the highest real gold price in modern history.
2️⃣ TABLE SUMMARY
| Gold Peak | Nominal Then | Real Value Today |
| 1980 panic | ~$850 | ~$3,200–3,400 |
| 2011 QE | ~$1,920 | ~$2,600–2,700 |
| Today | ~$4,584 | $4,584 |
3️⃣ WHAT MAKES TODAY DIFFERENT FROM 1980 & 2011
Today:
Inflation already happened
Debt far higher than 1980 or 2011
Central banks trapped
Geopolitical fragmentation
De-dollarization pressure
Central banks buying gold aggressively
Takeaway: Today’s price reflects structural distrust , not just panic.
4️⃣ WHAT A REAL GOLD TOP USUALLY MEANS NEXT
Historically, after gold peaks in real terms:
Nominal price may still go higher briefly
Then:
Long consolidation
Sharp correction
Or years of underperformance vs inflation
Gold doesn’t crash like silver — it bleeds purchasing power over time . That’s how tops resolve.
Disclaimer:
This post is for educational and informational purposes only and does not constitute financial, investment, or trading advice. Readers should conduct their own research or consult a professional before making any financial decisions.

"Gold in Firm Bullish Control""Gold in Firm Bullish Control"
Gold is currently trading in a constructive upward environment, where price behavior reflects sustained participation from institutional buyers rather than speculative spikes. Recent movements show that upside progress has been built through measured advances followed by controlled pauses, a pattern that typically appears when the market is preparing for continuation rather than exhaustion.
Market activity suggests that buy-side interest remains dominant, with pullbacks being absorbed efficiently and failing to generate follow-through selling. This indicates that bearish pressure lacks commitment, while bullish participation remains organized and patient. The absence of aggressive downside momentum during pauses reinforces confidence in the prevailing direction.
Volatility has compressed after an expansion phase, which often precedes another directional move. This compression reflects balance at higher price levels, a sign that the market is accepting value above prior ranges. Such acceptance generally supports further upside attempts once activity re-expands.
From a flow perspective, price reactions imply that liquidity has already been tested and cleared, reducing immediate downside vulnerability. The market now appears positioned for continuation rather than correction, with sentiment favoring gradual appreciation rather than sharp reversals.
Overall Assessment:
Gold remains in a positive continuation phase, where conditions favor further upward progress as long as market behavior continues to show acceptance at elevated levels and pullbacks remain corrective in nature

Gold Declines as Sellers Dominate the MarketGold is undergoing a controlled correction phase after an extended period of sustained gains. Market behavior over recent sessions reflects a shift from expansion to contraction as liquidity flow decreases and momentum weakens across key time horizons.
The previous upward cycle attracted substantial speculative interest, but current market dynamics suggest profit-taking by institutional participants and reduced accumulation from large holders. The recent structural shift confirms that sentiment has turned defensive, aligning with global market caution amid evolving economic conditions.
Despite short-term consolidation, the broader setup indicates that gold remains sensitive to global financial stability concerns and policy signals. Market participants are now waiting for clarity on upcoming economic data and interest rate outlooks, which could determine whether the correction deepens or transitions into a new accumulation phase.
In the near term, volatility is expected to remain elevated as investors reassess exposure levels. The prevailing outlook maintains a cautious bias, with traders closely observing how price reacts to continued shifts in liquidity and macro sentiment. Sustained capital outflow from hedge assets could pressure gold further, while renewed demand for safety could limit downside potential in the medium term.

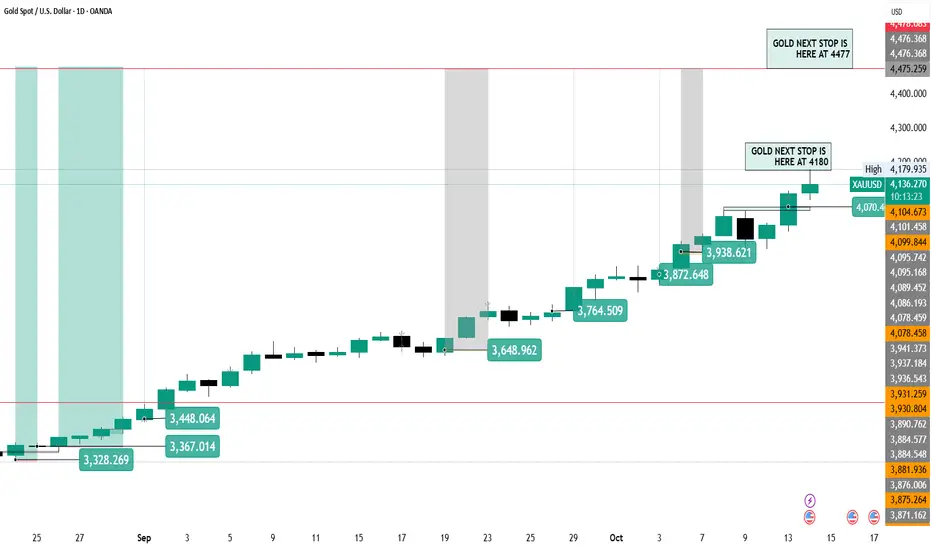
This is my next #gold tp in next 2-3 week and hight will be 4477This is my next #gold tp in next 2-3 week and hight will be 4477This is my next #gold tp in next 2-3 week and hight will be 4477This is my next #gold tp in next 2-3 week and hight will be 4477This is my next #gold tp in next 2-3 week and hight will be 4477This is my next #gold tp in next 2-3 week and hight will be 4477This is my next #gold tp in next 2-3 week and hight will be 4477This is my next #gold tp in next 2-3 week and hight will be 4477
Gold Forecast: Liquidity Rotation Shaping Price ActionGold Forecast: Liquidity Rotation Shaping Price Action
Gold’s recent movement reflects shifting dynamics between liquidity capture and market rebalancing. The push above 3,800 was less about sustained trend extension and more about triggering stops and gathering liquidity before rotating lower. This type of move often indicates that large participants are managing positioning rather than chasing new highs.
The current correction phase is part of that process. Price is being driven back into zones where imbalances remain, allowing institutional flow to realign. Instead of showing weakness, this return highlights how markets redistribute liquidity to prepare for the next decisive move.
From a flow perspective, gold remains in an accumulation phase. Consolidation pockets reveal ongoing positioning, while the corrective dip reflects controlled market engineering rather than disorder. If this cycle continues, the next stage could see energy released in the form of a renewed expansion leg once sufficient liquidity has been absorbed.
In essence, gold is navigating a liquidity-driven cycle: sweep → redistribute → prepare → expand. The underlying order flow still favors upward continuation once the current rebalancing phase completes.

Gold Breaking Limits – Trend Speaks for ItselfGold Breaking Limits – Trend Speaks for Itself
Gold Market Outlook
Gold continues to demonstrate a well-structured bullish cycle, characterized by steady momentum and clean trend development. The market has transitioned from a prolonged consolidation phase into a sustained directional move, where each breakout is validated by controlled retracements. This reflects strong participation and confidence from larger players.
The sequence of market shifts and break-of-structure signals highlight how short-term pullbacks are consistently absorbed, turning into fuel for further expansion. Price action is orderly, with no signs of erratic volatility, showing that buyers remain in control and liquidity is being managed efficiently.
Overall, gold is moving in line with the broader macro sentiment. The rhythm of accumulation, expansion, and continuation suggests that the current cycle has not yet exhausted its potential. While interim pauses are expected, the structural integrity of the trend continues to favor upside development over the medium term.

GOLD SHOWING A GOOD UP MOVE WITH 1:7 RISK REWARDGOLD SHOWING A GOOD UP MOVE WITH 1:5 RISK REWARD
DUE TO THESE REASON
A. its following a rectangle pattern that stocked the market
which preventing the market to move any one direction now it trying to break the strong resistant lable
B. after the break of this rectangle it will boost the market potential for break
C. also its resisting from a strong neckline the neckline also got weeker ald the price is ready to break in the outer region
all of these reason are indicating the same thing its ready for breakout BREAKOUT trading are follws good risk reward
please dont use more than one percentage of your capitalfollow risk reward and tradeing rules
that will help you to to become a bettertrader
thank you

gold had broke itsthroughout big resistance on weeklygold had broke itsthroughout big resistance on weekly, and combined with bounding on fibo level so if becomes back and breaks it, gold can blow up
