Gold - Sell around 3532, target 3500-3480Gold Market Analysis:
Yesterday, we planned to buy gold at 3531, and the blog post clearly stated buying at 3526. Almost all of the purchases were made at the lowest point. Gold surged to 3578 in the European and American trading sessions, closing with a strong positive daily candlestick pattern. However, gold plummeted in the Asian session, giving back all of yesterday's gains in just a few hours. Does this signal a topping? A technical pullback after a significant surge is normal, but the magnitude of the pullback has disrupted the short-term buying structure, allowing gold to re-enter a new pattern. This week is a data week, and the further into the future, the more critical the market for gold. I believe the current sharp drop is merely profit-taking ahead of the data releases, and it's not yet a definitive peak signal. The overall trend should continue to be buying today. Don't blindly buy in the Asian session. Consider selling on a short-term rebound. The 3526 level has been broken. This level is the hourly low and also the daily support level. A break of this level indicates a weakening trend. Another level is the 5-day moving average of the daily chart, 3508-3500. A significant drop below this level would confirm a short-term Yin-enclosing Yang pattern, potentially signaling the start of a major correction. We can buy and sell intraday, capitalizing on this trend. Furthermore, the 4-hour chart's consecutive reversals into the red are causing market confusion.
Support is 3508-3500, while resistance lies at 3566, 3553, and 3542. The dividing line between strength and weakness is 3526.
Fundamental Analysis:
Today we will have ADP employment and unemployment benefit data.
Trading Recommendation:
Gold - Sell around 3532, target 3500-3480
Goldminers

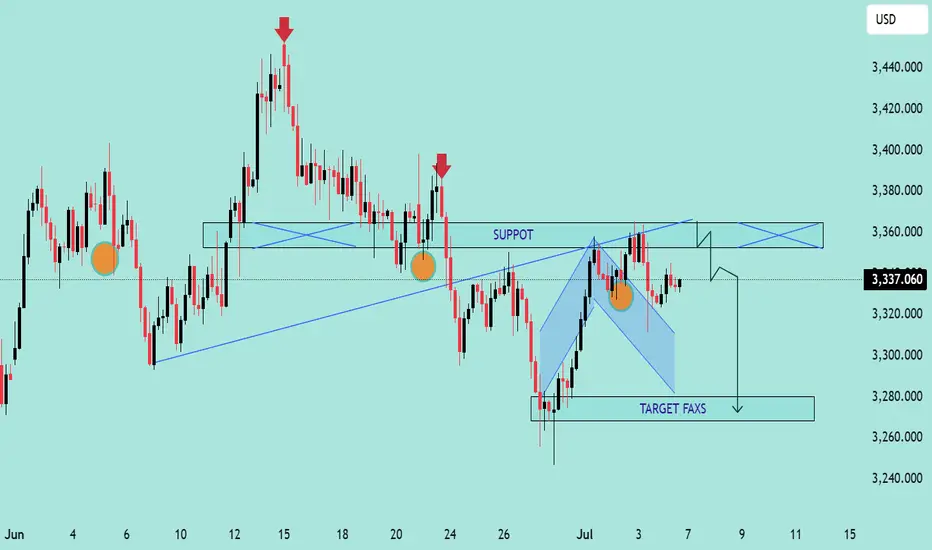
GOLD/USD Bearish Rejection From Resistance Zone – Potential DropGOLD/USD Bearish Rejection From Resistance Zone – Potential Drop Ahead! 🎯
📊 Technical Analysis Summary:
The chart illustrates a bearish setup forming after multiple rejection points near a key resistance zone around 3,360–3,380 USD.
🔍 Key Observations:
🔴 Double Rejection Pattern:
Red arrows highlight strong bearish rejections from resistance.
Indicates sellers are defending this zone aggressively.
🟠 Support Turned Resistance:
The previous support (labelled as "SUPPOT") is now acting as resistance.
Classic bearish retest behavior.
🔷 Bearish Flag Formation:
Price consolidates in a descending flag pattern.
Breakdown below the flag suggests continuation to the downside.
🎯 Target Zone:
If breakdown confirms, price may drop towards target area near 3,275–3,280 USD (marked as “TARGET FAXS”).
🟧 Important Reaction Zones:
Multiple orange circles indicate zones of high reaction – historically significant for both buyers and sellers.
📌 Conclusion:
Unless bulls reclaim the 3,360–3,380 resistance zone convincingly, the bias remains bearish, and the next leg down may target the 3,280 USD area.
🔔 Traders should watch for a clean break below 3,320 to confirm bearish continuation.
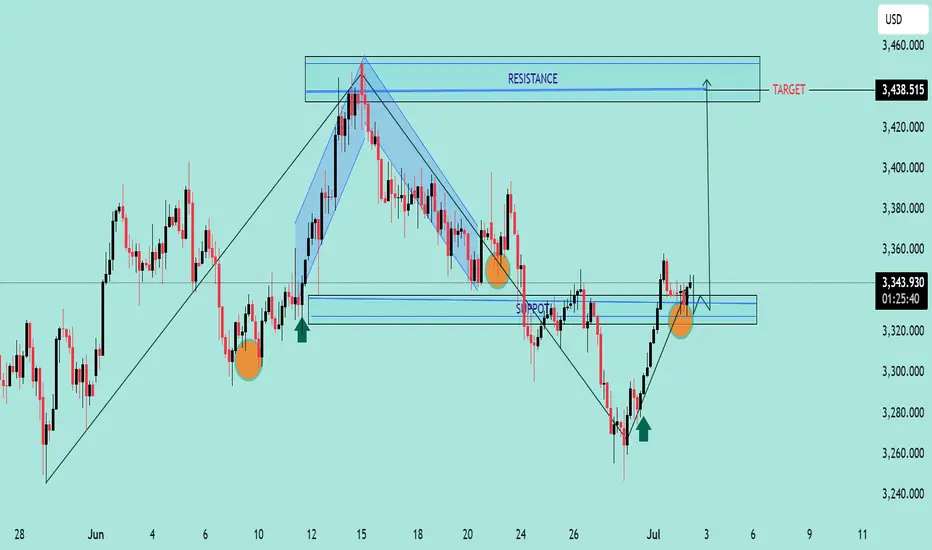
GOLD/USD Bullish Reversal and Breakout Target GOLD/USD Bullish Reversal and Breakout Target 🎯 ✨📈
🔍 Technical Analysis Overview:
The chart illustrates a clear bullish reversal pattern following a strong downtrend, with price reacting from a key support zone (highlighted in blue).
Multiple bullish rejection wicks and confirmation candles (green arrows) indicate buying interest at this support.
The recent higher low formation confirms shift in market structure towards bullish bias.
📌 Key Zones:
🟦 Support Zone: Around 3,280 – 3,320 USD
Price respected this zone multiple times (marked with orange circles), confirming its strength.
🟥 Resistance Zone / Target: 3,430 – 3,460 USD
This area aligns with previous swing highs and is the projected target for this bullish move.
📈 Chart Structure:
Break of descending trendline and bullish momentum above support suggests potential continuation towards the marked target.
Falling wedge breakout also aligns with reversal logic.
🎯 Price Target:
3,438.515 USD (resistance area), as labeled on chart with arrow and breakout projection.
🛑 Invalidation Level:
A sustained break below the support zone (3,280 USD) would invalidate this bullish outlook.
📌 Conclusion:
Gold is exhibiting strong bullish behavior with confirmation from price action and structure break. As long as price sustains above support, the path toward 3,438 remains
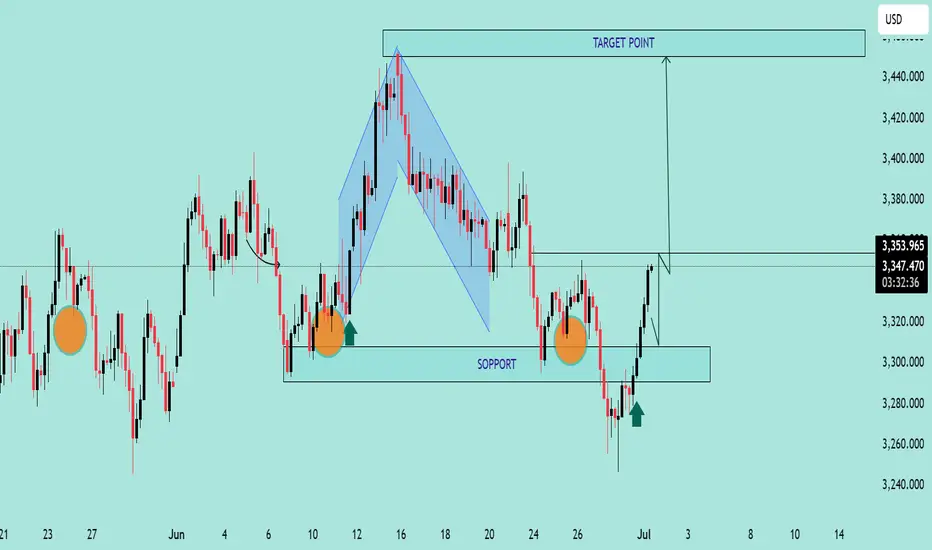
Bullish Reversal Setup on GOLD/USD Bullish Reversal Setup on GOLD/USD 💰📈
🔍 Chart Analysis:
The chart illustrates a clear bullish reversal structure forming off a strong support zone:
📌 Key Observations:
Multiple Rejections at Support 🟠
The price has reacted to the 3,300 - 3,280 USD support zone multiple times, forming a triple bottom pattern, indicating strong buyer interest.
Bullish Harmonic Pattern ✅
A bullish harmonic pattern (likely a Bat or Gartley) completed right at the support level, triggering a strong reversal with a bullish engulfing candle.
Break of Minor Structure 📊
Price broke through minor resistance near 3,340 USD, confirming bullish momentum. The breakout is supported by a retest shown with the green arrow 🟢.
Target Point Identified 🎯
The projected target is 3,460 USD, marked clearly as the next significant resistance zone. This aligns with previous price rejection areas, making it a high-probability target.
📈 Trading Outlook:
✅ Buy Confirmation: Break and retest of 3,340 USD zone.
🎯 Target: 3,460 USD.
🛡️ Support Zone: 3,300 – 3,280 USD (watch for any breakdown below this).
📌 Conclusion:
The chart signals a high-probability bullish continuation, with strong support, harmonic confluence, and structural breakout. Traders may look for buy opportunities on pullbacks with the target set at 3,460 USD. 🚀📊
Gold (XAU/USD) Technical Analysis – Bearish Breakdown in Play📉 Gold (XAU/USD) Technical Analysis – Bearish Breakdown in Play | June 20, 2025 🟡
🕒 Timeframe: 4-Hour
📍 Asset: Gold Spot / U.S. Dollar (XAU/USD)
🖼️ Chart Source: TradingView by AngelaFxTrading
🔍 Chart Overview
The 4H chart displays a clear bearish breakdown from an ascending trendline (blue), followed by a rejection at a key horizontal resistance zone (highlighted in purple).
🧠 Key Technical Insights
📌 1. Resistance Zone Rejection
Price Level: ~$3,370 - $3,390
Price attempted multiple breakouts above the resistance zone but consistently failed, indicating strong seller presence. The red arrow marks a lower high, suggesting waning bullish momentum.
📈 2. Trendline Break
The rising blue trendline has been decisively broken. This signals a potential trend reversal from bullish to bearish.
🧭 3. Support Levels to Watch
Minor Support: $3,294.43 (short-term reaction zone)
Major Support: $3,244.87 (target of the projected drop)
🔮 4. Bearish Projection
Blue arrows indicate a measured move expectation, targeting the $3,244.87 level.
A bearish flag/pennant formation post-break suggests continuation lower.
⚠️ Key Considerations
Fundamentals: Note the icons at the bottom — upcoming USD-related news/events 📅 could inject volatility.
Confirmation: For bears, a clean rejection from the resistance retest would confirm entry zones.
🧭 Trading Bias:
🔻 Short-term Bearish
As long as price remains below the purple resistance and under the broken trendline, selling pressure dominates.
🛑 Invalidation Zone
A daily close above ~$3,390 would invalidate this bearish setup and suggest a return to bullish momentum.

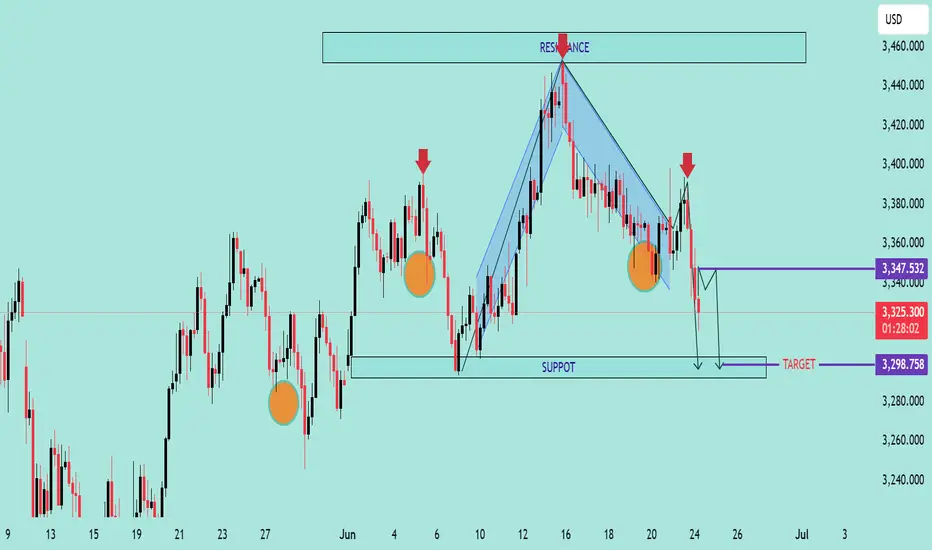
Bearish Continuation Pattern Detected on GOLD/USD Bearish Continuation Pattern Detected on GOLD/USD 📉
📊 Chart Analysis Summary:
The GOLD/USD chart shows a clear bearish continuation pattern, following a rejection from a major resistance zone.
🔍 Key Technical Highlights:
🔺 Resistance Zone:
Strong resistance at 3,420 – 3,440 USD, marked by multiple rejections (🔴 red arrows).
Price formed a Bearish Harmonic Pattern (likely a Gartley or Bat), suggesting reversal from this resistance.
🔻 Bearish Momentum:
After the pattern completed, price broke below the minor support structure and is currently forming lower highs and lower lows, indicating bearish structure.
📉 Support Level:
Strong horizontal support zone around 3,298 – 3,300 USD, marked as “TARGET.”
This area was previously tested (🟠 orange circles) and now projected to act as a target level again.
🔄 Minor Retracement Zone:
Expecting a minor pullback to 3,347 USD (purple line) before potential continuation downward.
This zone aligns with the previous support turned resistance (classic SR flip).
🎯 Target Projection:
Based on the bearish impulse and measured move, the projected target is around 3,298.758 USD, which coincides with the previous support zone.
📌 Conclusion:
The price action suggests a high-probability bearish continuation, targeting the 3,298 USD zone unless the price breaks and holds above 3,347 USD. Traders may consider selling on rallies with a confirmation of rejection at resistance.
📉 Bias: Bearish
📍 Invalidation: Break and daily close above 3,347 USD
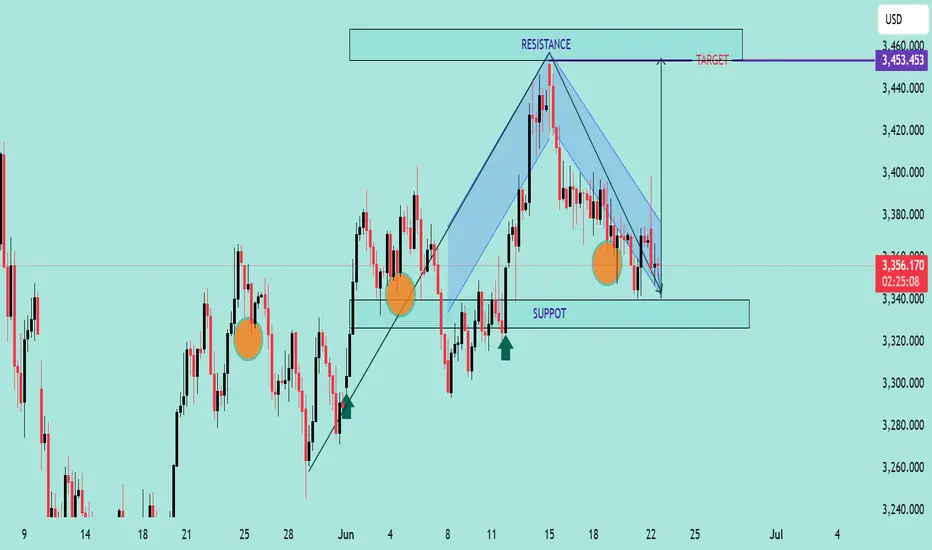
GOLD/USD Falling Wedge Breakout PotentialChart Analysis:
The chart illustrates a Falling Wedge Pattern, a bullish reversal setup typically signaling a breakout to the upside.
📌 Key Observations:
📉 Downward Channel: Price has been compressing within a falling wedge (highlighted in blue), indicating potential exhaustion of sellers.
💪 Support Zone: Strong support observed near the 3,340 level, with price rejecting this zone multiple times (highlighted with orange circles).
🔼 Bullish Signals: Price recently tested the lower wedge boundary and bounced, suggesting potential reversal.
🎯 Breakout Target: Projected target after breakout is around 3,453.453 USD, aligned with previous resistance zone.
🟢 Buy Pressure Arrows: Green arrows signal previous bullish reactions from similar demand zones.
📈 Conclusion:
If price breaks above the wedge’s upper boundary with volume confirmation, a bullish rally toward 3,453 is expected. Keep an eye on breakout retest for entry validation.
✅ Trading Plan Suggestion:
Entry: On breakout above wedge resistance
SL: Below recent swing low (~3,330)
TP: 3,453 zone 🎯
🔔 Note: Wait for a confirmed breakout before entering to avoid false signals.
GOLD/USD Bearish Rejection at Resistance ZoneGOLD/USD Bearish Rejection at Resistance Zone 📉🟥
📊 Technical Overview:
The chart for GOLD/USD shows a clear price action behavior between a well-defined resistance zone (~3,480–3,510) and a support zone (~3,260–3,280).
🔻 Bearish Signals:
The price has tested the resistance zone multiple times (highlighted with red arrows and orange circles) but failed to break above it, indicating strong selling pressure.
The current price action suggests another lower high formation, which is a bearish signal 📉.
Recent candles are rejecting the upward move, pointing to potential downside movement.
🟩 Support Confirmation:
Previous reactions from the support zone (green arrows) show that buyers have consistently stepped in near the 3,260–3,280 range.
This level remains a key demand zone where a bounce might be expected.
🔁 Outlook:
If the price continues to reject the resistance and follows the pattern, we might see another drop towards the support area.
A break below the support zone would confirm a bearish breakout and could open the door to deeper downside targets.
📌 Conclusion:
GOLD/USD is trading within a range, but the repeated failures at resistance suggest bearish momentum might take control in the short term. A move back toward the support zone is likely unless a breakout above resistance occurs.
📉 Resistance: 3,480–3,510
🟩 Support: 3,260–3,280
🔍 Bias: Short-term Bearish unless resistance breaks

GOLD SPOT (XAU/USD) 4H Analysis – Bullish Momentum Breakout🔔 GOLD SPOT (XAU/USD) 4H Analysis – Bullish Momentum Breakout 💥📈
📊 Overview:
Gold has confirmed a strong bullish breakout from the consolidation zone, driven by sustained support and recent upward pressure. After rebounding from the MAIN SUPPORT zone around $3,200, price action has surged and successfully touched the 1st Take Profit (TP1) zone at $3,429.
🔍 Key Levels:
🟩 Main Support: $3,200 zone — held firm and acted as a launchpad for the bullish reversal.
📌 1st TP (Touched): $3,429 — resistance level has been tested and price is currently hovering near it.
🎯 Next Target (TP2): $3,504 — price is expected to approach this zone as bullish momentum continues.
📈 Technical Outlook:
Price structure shows a clear higher low formation followed by a strong impulse breakout.
Current momentum suggests bulls are in control, with volume and volatility increasing on the upward leg.
As long as the price remains above the $3,366 short-term support, the bias remains bullish.
🛑 Risk Note:
Watch for possible rejection near TP2.
A failure to hold above $3,366 may trigger a pullback to retest lower zones.
✅ Conclusion:
The bullish continuation scenario remains valid with potential to hit the $3,504 mark. Traders may look for long opportunities on pullbacks while maintaining tight risk management. 🔐📊

Chart Overview Instrument: Gold Spot (XAU/USD)🔍 Chart Overview
Instrument: Gold Spot (XAU/USD)
Timeframe: 2H (2-hour candles)
Date/Time: Chart ends on June 5th, 2025, 19:14 UTC.
🟩 Support & Resistance Zones
✅ Resistance Zone
Level: Around 3,355 – 3,375 USD
📌 This zone has seen repeated tests and rejections, indicating strong selling pressure.
✅ Support Zone
Level: Around 3,160 – 3,180 USD
🛡️ Price bounced from this zone previously, confirming it as a strong support area.
⚙️ Key Observations
📈 Range-Bound Trading
The price is currently trapped between the strong support and resistance zones.
Multiple rejections at the resistance zone suggest sellers are active above 3,355 USD.
💡 Horizontal Consolidation
Price has formed a horizontal range (sideways movement) in recent sessions.
This range-bound behavior signals market indecision or a buildup before a potential breakout.
📉 Previous Price Action
🔽 Sharp Reversal Drop
Around the middle of May, there was a strong rejection at resistance, followed by a rapid sell-off to the support zone.
This shows that the resistance zone is significant and that sellers are quick to act.
🔮 Potential Scenarios
✅ Bullish Breakout
If price closes above 3,375 USD with strong momentum, expect a potential bullish rally toward 3,400+ USD.
✅ Bearish Rejection
If price fails to close above 3,355 USD and shows rejection candles (like dojis or bearish engulfing patterns), price may retest 3,280 USD and even support at 3,160 USD.
🔔 Key Takeaway & Trader’s Tip
⚠️ Watch for breakout signals near resistance and support.
✅ Volume spikes and momentum indicators will help confirm true breakouts or fakeouts.
🔍 Neutral to Bearish Bias
Given repeated rejections at resistance, short-term bias is neutral to bearish unless a breakout occurs.
📝 Summary with Emojis
🔴 Resistance Zone: 🔝💪
🟩 Support Zone: 🛡️🟢
📉 Bearish Momentum likely below 3,355 USD
📈 Bullish Breakout above 3,375 USD
🕵️♂️ Watch for consolidation and breakout setups!

Gold (XAU/USD) Bullish Breakout Trade Setup – Targeting $3,4201. Entry Point Zone (~3,302.88 - 3,317.09):
This is the area where a long position (buy) is suggested.
The price has already moved slightly above this zone, indicating the trade may have already been triggered.
2. Stop Loss (~3,260.41 - 3,299.02):
Positioned below the entry zone to limit downside risk.
Suggests that if the price drops below this support zone, the trade idea is invalidated.
3. Target Point (3,420.41):
A bullish target suggesting a potential upside move of ~117.62 points (or ~3.56%).
This zone acts as a take-profit level.
4. Technical Indicators:
Moving averages (possibly 50 EMA in red and 200 EMA in blue) show a bullish crossover recently, supporting the upward momentum.
5. Pattern Outlook:
The chart implies a possible cup-and-handle or bullish consolidation breakout pattern, anticipating continuation upward.
Summary:
The strategy depicted is a bullish breakout setup:
Buy near 3,302.88–3,317.09
Stop Loss near 3,260–3,299
Take Profit near 3,420
This setup favors buyers as long as the price remains above the stop-loss zone. If the market holds this structure, there's a good risk-reward ratio for a move to 3,420.41.

XAU/USD) Buy Trade Setup – Entry, Target & Risk Management Plan Entry Point:
3,140.34 USD
This is the suggested level to enter a long (buy) trade.
Stop Loss (SL):
3,121.66 USD
A protective level to limit losses if the trade goes against the setup.
Target Point (Take Profit - TP):
3,251.33 USD
This is the EA target point — where profits are expected to be taken.
---
3. Risk/Reward Ratio:
Risk: From 3,140.34 to 3,121.66 = 18.68 points
Reward: From 3,140.34 to 3,251.33 = 110.99 points
Risk/Reward Ratio ≈ 1:6, which is very favorable.
4. Resistance Point:
Around 3,222.45 - 3,227.27
This area might act as a challenge for price movement, potentially leading to temporary retracements.
5. Indicators:
Moving Averages: Red (shorter period) and Blue (longer period) lines help indicate trends.
The price is moving above the short-term MA but currently under the long-term MA, which might suggest a short-term bullish move within a broader downtrend or sideways range.
Conclusion:
This is a bullish setup, anticipating a reversal or continuation to the upside after a pullback:
Buy Zone: 3,140.34
Stop Loss: 3,121.66
Take Profit: 3,251.33
If the price drops to the entry point zone

Gold (XAU/USD) 3H Chart Analysis – Bullish Setup Toward $3,500 TCurrent Price: $3,254.26
EMA 70: $3,285.50 (Price is below EMA – cautious zone)
Bias: Bullish 📈 (if demand zone holds)
Key Zones:
🟦 Demand Zone: $3,200 – $3,260
✅ Strong buy interest expected here
⚠️ Good place to look for entry signals
🟥 Resistance Zone: $3,223.60 – $3,323.84
🔄 Price is currently testing this zone
A breakout here can lead to bullish momentum
🎯 Target Point: $3,500 – $3,529 💰
📌 Defined as "Target Point 3500"
High potential for profit-taking here
⛔ Stop Loss: $3,161.32
🚫 Placed below demand zone for risk control
❗ Important to exit if price drops here
Trade Idea 💡
📥 Buy Entry: Near or above $3,223.60
✅ Hold as long as price respects demand zone
🎯 Target: $3,500
⛔ Stop Loss: $3,161.32
⚖️ Risk:Reward ratio looks favorable!
Quick Summary:
🟢 Bullish Setup
💪 Demand zone is strong
📈 Breakout above resistance may fuel a rally
⏳ Wait for confirmation before entry!

Gold (XAU/USD) Intraday Buy Setup with High Reward-to-Risk Ratio1. Entry Point Zone: Around 3,271.79 USD
This is identified as a potential buy entry area, marked in purple.
2. Stop Loss: Below the entry point at 3,257.71 USD
Risk management level in case the trade moves against the setup.
3. Target Point One: Between 3,313.75 and 3,317.07 USD
A short-term take-profit level, likely based on previous resistance.
4. Final Target (EA Target Point): Around 3,373.04 USD
A more ambitious take-profit, possibly based on a major resistance level or Fibonacci extension.
5. Trade Range:
Risk: 3,271.79 - 3,257.71 = 14.08 USD
Reward to First Target: ~42 USD

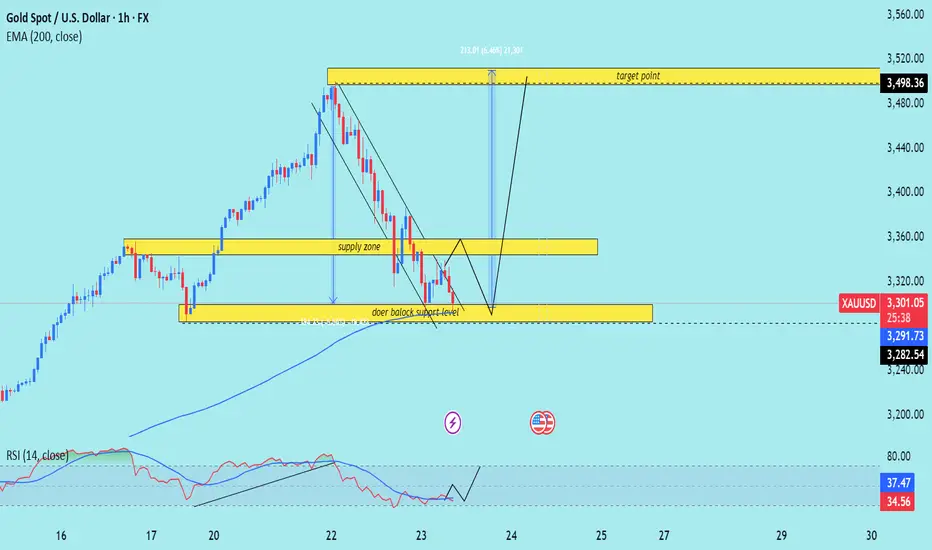
XAU/USD) orderblok key Support Analysis Read The ChaptianSMC Trading point update
technical analysis of Gold Spot against USD (XAUUSD) on the 1-hour timeframe. Here's a breakdown of the key ideas presented:
Chart Analysis Summary:
1. Price Zones:
Supply Zone (Resistance): Around the 3,355–3,365 level.
Demand/Support Zone (Doer Block Support Level): Around 3,282–3,291.
2. Current Price Action:
Price is currently at $3,331.96, close to the supply zone, and bouncing between the zones.
There’s a sharp downtrend, which seems to be slowing down near the support level.
3. Projected Move:
The chart suggests a short-term dip back into the demand/support zone, followed by a bullish reversal.
Target Point: A move back up toward $3,498.36, which is marked as a significant resistance.
4. Technical Indicators:
RSI (Relative Strength Index): Currently around 36.64 and recovering, suggesting potential bullish divergence or an oversold condition.
200 EMA: Around $3,291.52, providing dynamic support — aligning with the lower demand zone.
Mr SMC Trading point
Trade Idea:
Buy Setup (Long Trade):
Entry: Near 3,282–3,291 (support zone).
Target: 3,498.36.
Stop Loss: Below the support zone (~3,270).
Overall Idea:
This is a reversal-based setup. The price is expected to retest the support before launching a bullish leg toward the target. The confluence of the EMA, support zone, and RSI near oversold adds weight to the potential for a bounce.
Pelas support boost 🚀 analysis follow)
GOLD TRADING POINT UPDATE >READ THE CHPTAIAN Buddy'S dear friend
SMC Trading Signals Update 🗾 Update Gold Traders SMC-Trading Point update you on New technical analysis setup for Gold 🪙 Gold Traders. ) a little. Analysis setup for buying said FVG level support level 🎚️. Fisrt entry 3037 + 3060 next entry level support level 3025. Target point 3060 ) that is rejected point below 👇 trend 📉 update you next analysis) good luck 💯💯🤞
Key Resistance level 3055+ 3060
Key Support 3025 - 3019
Mr SMC Trading point
Pales support boost 🚀 analysis follow)

Is it time to flee or enter gold?This week, the market focus is on the Fed's interest rate decision and the tension in Yemen in the Middle East.
Gold prices rose to a new record high as the uncertainty of tariffs and bets on the Fed's loosening of monetary policy keep gold prices attractive. Central bank gold purchases and trade uncertainty are the main driving forces behind the rise in gold prices; investment institutions are accelerating the transfer of large quantities of physical gold bars to New York vaults to avoid possible tariffs and take advantage of the price difference between London and New York gold prices for arbitrage.
After the sharp rise, gold entered a shock consolidation, which is also a common trend in this round of upward trend. Although the decline at the end of last Friday was not very strong, the upward trend cannot be easily reversed by a single decline, and greater strength and time are needed.
Although the technical side still maintains the structural operation of the upward trend, we need to consider the historical high price of gold, and it is not easy to chase the rise at a high level. The trading idea at the beginning of the week is to wait for a pullback to buy at a low level, and then sell short-term near the previous historical high or another historical high!
Key points:
First support: 2980, second support: 2972, third support: 2963
First resistance: 3005, second resistance: 3013, third resistance: 3026
Operation ideas:
Buy: 2980-2983, SL: 2972, TP: 3000-3010;
Sell: 3005-3008, SL: 3016, TP: 2990-2980;

Gold (XAU/USD) 30-Minute Analysis Bearish Breakdown Towards Gold (XAU/USD) 30-Minute Analysis – Bearish Setup📉
Key Observations:
1.Rising Wedge Breakdown:
- The price has been moving within an ascending channel(EA TRADE LINE).
- A potential breakdown is forming as the price approaches resistance.
EMA Levels:
-30 EMA (Red, 2,986.22: The price is hovering near this level, showing potential weakness.
-200 EMA (Blue, 2,950.00) This is the first major support level in case of a decline.
3. Bearish Projection:
- A break below current leve could trigger a sharp drop.
- The **target zone is around 2,902.73 – 2,902.41, aligning with prior support.
4. Risk Management:
Stop-loss (Red Zone): Placed above 2,990.86 to protect against invalidation.
Take-Profit (Green Zone):Set near 2,902, offering a strong risk-to-reward ratio
Conclusion:
-Bearish Bias: A drop seems likely if the price fails to reclaim higher levels.
Confirmation Needed A clean break of 2,980 could accelerate the move.
-Risk Facto If price reclaims 2,990+, the bearish setup might be invalid.

GOLD TRADING POINT UPDATE > READ THE CHAPTIANBuddy'S dear friend 👋.
SMC Trading Signals Update 🗾🗺️ Gold Traders SMC-Trading Point update you on New technical analysis setup for Gold 🪙 Gold Traders Gold 1H time. Look 👀 first take FVG level that take entry buying said target point 2959 New ATH wait for FVG level good luck 🤞
Key Resistance level 2930 + 2959
Key Support level 2909 - 2902 - 2896
Mr SMC Trading point
Pales support boost 🚀 analysis follow)

GOLD VIEW 3H READ THE CAPTAINHello 👋 gold traders
3-hour timeframe of Gold Spot (XAU/USD) with technical analysis levels and moving averages. Here’s a breakdown of the key points:
Key Observations:
1. Support & Resistance Levels:
Support Level: Around 2,909.870 - 2,902.340 (marked as the buying zone).
Resistance Level: 2,930.173.
Target Point: 2,960.607.
2. Exponential Moving Averages (EMAs):
30 EMA (Red Line): 2,909.870 (Short-term trend).
200 EMA (Blue Line): 2,884.578 (Long-term trend, acting as strong support).
3. Price Action:
The price is currently in a consolidation phase around the resistance zone.
If the price breaks above 2,930, we might see a bullish move toward the target at 2,960.
If the price fails to break resistance, a pullback to the buying zone (support level at 2,909-2,902) is possible.
Trading Strategy Ideas:
Bullish Scenario (Breakout Above 2,930): Look for long positions targeting 2,960.
Bearish Scenario (Rejection at Resistance): A retest of the buying zone (2,909 - 2,902) before another push higher.

GOLD TRADING POINT UPDATE >READ THE CHPTIANBuddy'S dear friend 👋
SMC Trading Signals Update 🗾🗺️ Gold Traders SMC-Trading Point update you on New technical analysis setup for Gold 🪙 Gold Traders list time post signals Hit sucksfully My target point ) Now Gold making choch FVG level) FVG level 2897 + 2906 down 👇 👎 trend 📉 point below 👇 ⬇️ target point 2868- 2859 first. Hit sucksfully FVG level that take entry ☺️ 🥂 good luck 🤞
Key Resistance level 2897 + 2906
Key Support level 2868- 2859
Mr SMC Trading point
Pales support boost 🚀 analysis follow)

GOLD TRADING POINT UPDATE >READ THE CHAPTIAN Buddy'S dear friend 👋
SMC Trading Signals Update 🗾🗺️ Gold Traders SMC-Trading Point update you on New technical analysis setup for Gold traders SMC trading point ☝️ list time post signals 🚀 Hit sucksfully My target point 2920 ) Now Gold rejected point below 👇 supply zone 2892- 2875 FVG level up trand My target 🎯 point 2961 long Trade 🤝. First take short trend 📈 And buying it)
Key Resistance level 2915 + 2920 + 2956+ 2961
Key Support level 2892 - 2875
Mr SMC Trading point
Pales support boost 🚀 analysis follow)

GOLD TRDAING POINT UPDATE >READ THE CHAPTIAN Buddy'S dear friend 👋
SMC Trading Signals Update 🗾🗺️ Gold Traders SMC-Trading Point update you on New technical analysis setup for Gold 🪙. Gold Traders Gold 🪙) weekly 1D 4H Time Frame Candle) update. Gold Gold weekly basis analysis setup. Close above. ) and close below)
Weekly Time Frame Candle close above 2887) NEXT targets 2956 ) 1D candle close below 👇 ⬇️ 2873 Next target 2788
weekly TFM
4 TFM
Key Resistance level 2888+ 2940 + 2956
Key Support level 2834 - 2788
Mr SMC Trading point
Pales support boost 🚀 analysis follow)
