OVERVIEW GOLD CHART H1 11/21 🧭 1. CURRENT MARKET CONTEXT
Gold remains in a downtrend on the H1 timeframe, despite a minor rebound after the NFP release.
A sharp drop to 4,039 created a new low, followed by a weak recovery and sideways movement during the Asian session.
When the London session opened, price broke below the consolidation zone, confirming that sellers are still in control of the market.
Key highlights:
• The market remains bearish as long as price stays below 4,052–4,060
• Volume Profile shows VAL at 4,052 turning into a new resistance
• Intraday structure continues to form lower highs → maintaining the main downtrend
⸻
🔍 2. TECHNICAL ANALYSIS – H1
🔹 Trend overview
• H1: Clear bearish pattern with consecutive LL – LH.
Breakout from the Asian session sideways confirms the continuation of the downtrend.
🔹 Price action
• Asian session: Price consolidates after the sharp drop
• European session: Break below the sideways range → sellers continue to push
• All upward moves are just retracements – not a reversal
⸻
📌 3. IMPORTANT PRICE ZONES
🔥 Resistance zones (SELL priority)
• 4,040 – 4,052 → Strong intraday resistance
– Confluence of VAL, supply zone, and downtrend line
• 4,060 – 4,070 → For deeper pullbacks
🟩 Support zones (downside targets)
• 3,995 – 4,005 → Stronger support – extended target if selling momentum increases
⸻
🎯 4. TRADING SCENARIOS
🔻 Scenario 1 – Most important (priority)
SELL on pullback
If price retraces to 4,040 – 4,052 and shows rejection signals (M5/M15):
Sell zone: 4,040 – 4,052
TP: 4,025 → 4,010 → 3,995
SL: Above 4,060
🔻 Scenario 2 – Continuation after breaking the low
If price breaks 4,028 with a strong H1 candle close:
Sell continuation
TP: 4,010 → 3,995
SL: 4,045
🔻Scenario 3 – Only trigger on reversal structure
If price breaks & closes above 4,060, the structure weakens:
➡️Quick Buy: up to 4,075 → 4,092
(Only trade with strong signals – this is a counter-trend setup)
⸻
🥇 5. CONCLUSION
• Main trend: Down – SELL is preferred
• Best entry zone: 4,040 – 4,052 (strong confluence)
• Only Buy on a clear break above 4,060
Goldoutlook

Gold Drops to 4050 – Testing a Key Support Zone📊 Market Overview:
Gold continues to fall toward the 4050 region as the US Dollar strengthens and US bond yields edge higher, reducing safe-haven demand. The market is now awaiting clearer signals from the Fed minutes and upcoming US economic data, causing bullish momentum to weaken.
________________________________________
📉 Technical Analysis:
Key Resistance: 4072 – 4085
Stronger Resistance: 4095 – 4105
Nearest Support: 4055
Stronger Support: 4045 – 4040
EMA09: Price is trading below the EMA09 on the H1 chart → short-term bearish signal.
Candlestick / Momentum:
H1 candles continue forming lower highs, showing sellers are in control. Volume is gradually decreasing, indicating the market is waiting for a reaction at the 4050 support zone.
________________________________________
📌 Outlook:
• Gold may continue to decline in the short term if price breaks below 4045.
• Conversely, if gold bounces strongly from 4050 with a clear reversal candle, price could retrace toward 4072–4085, and may extend to 4095 if buying pressure strengthens.
________________________________________
💡 Suggested Trading Strategy:
🔻 SELL XAU/USD at: 4082 – 4085
🎯 TP: 40 / 80 / 200 pips
❌ SL: 4088
🔺 BUY XAU/USD at: 4040 – 4037
🎯 TP: 40 / 80 / 200 pips
❌ SL: 4035

XAUUSD | Bulls Hold Control Above 4070 - Eyes on 4090–4100 ZoneGold (XAUUSD) continues to show strong bullish structure, and price action above the 4070 key support reinforces buyers’ dominance.
If price sustains above this level, the next upside liquidity area sits at 4090–4100 , a zone where previous reactions have occurred.
Bullish Scenario:
Holding above 4070 keeps momentum pointed toward 4082 and then the 4090 zone.
The bullish outlook remains valid as long as price stays above 4059, which currently acts as intraday invalidation.
What I’m Watching:
A clean intraday consolidation above 4070
Momentum strength into 4082
Whether buyers can break into the 4090–4100 resistance pocket
This setup highlights how the market could behave, not financial advice—just educational analysis.
📌 Disclaimer:
This analysis is for educational purposes only and is not financial advice. Always manage risk and follow your trading plan.
Your feedback drives our content and keeps everyone trading smarter. Let’s make those pips together! 🚀
Happy Trading,
– The InvestPro Team

GOLD DAILY TRADING 17/11: BUY TODAY🦁 THE GOLDEN ARENA – 17 NOV, 2025
“Rebound or Trap? Let the Orderflow Decide.”
A visually striking TradingView plan – part narrative, part tactical map. This is not just a bias, it’s a battlefield strategy.
🧭 MARKET CONTEXT SNAPSHOT
Price currently consolidating around 4076 – 4084, after clean breaks of structure (BOS) and a deep retracement.
Significant supply zones confirmed at 4157 – 4180, where POC clusters, FVG imbalances, and volume absorptions align.
Orderflow on M5–M30 shows fading buy pressure and aggressive sells into lower highs.
🎯 CORE STRATEGIES FOR TODAY
🔺 Scenario 1: Breakout Trap SELL (High Conviction)
Target Zone 4178 – 4180 (Main Supply)
Stop Loss (SL) 4185
Take Profit 1 (TP1) 4155 (Low volume node)
Take Profit 2 (TP2) 4100 (Local support)
Take Profit 3 (TP3) 4040 (Structural SSL level)
🔍 Why this setup?
Clear liquidity pool above 4178 being targeted.
Volume tapering off into the move → classic reversal signal.
Footprint shows absorption candles at key supply.
🪙 Scenario 2: FVG Scalping SELL (Secondary)
Entry Zone 4157 – 4158
SL 4163
TP 4100 – 4105
✅ Perfect for short-term scalpers looking to ride the intraday rejection from the imbalance zone.
🟢 Bullish Reversal INVALIDATION (Failsafe Plan)
Trigger Break and hold above 4185
Entry Breakout Buy above 4190
SL 4175
TP 4220
Only flip bullish if aggressive buyers step in + strong delta + profile breakout.
🧱 KEY PRICE ZONES TO MONITOR
Level Description
4185 Stopline – invalidates Sell
4178 – 4180 Main SELL Zone (POC + FVG)
4157 – 4158 Minor FVG Scalping Area
4100 Micro support + Bull trap
4040 SSL – liquidity target
📊 VOLUME & ORDERFLOW INSIGHT
M5–M30 Footprints:
Massive seller imbalances from 4175+
Footprint at 4084 shows buyer exhaustion
Volume Profile:
High-volume node at 4178 acting as strong resistance
Low-volume gap below 4155 → fast price travel zone
Delta:
Negative delta buildup confirming sell bias
💡 EXECUTION CHECKLIST
✅ Wait for entry trigger at marked zones – don’t pre-empt.
🚫 Avoid FOMO buy into supply unless 4185 is cleanly broken.
🔔 Set alerts at 4157 and 4180 for rejection signs.
🧠 TRADING MANTRA OF THE DAY
"The chart speaks in structure,
The volume whispers the truth,
But the orderflow shouts the conviction."
📌 Bias: SELL on retracements toward supply → hold for 4100–4040
📌 Watchlist: Footprint aggression, absorption blocks, spoof traps

XAUUSD – Consolidation Before Drop**Gold (XAUUSD) – Consolidation Before Potential Downside Move**
Gold continues to hover in a consolidation range after the recent breakout and structural shift on the 3H chart. The bullish momentum that previously dominated has now slowed, indicating a possible distribution phase forming near the $4,050–$4,100 zone.
The market structure shows repeated rejections at the upper boundary, suggesting that buyers are losing strength. With BOS (Break of Structure) confirmations in the recent candles and a clear lack of higher highs, a potential downside continuation could unfold once the current range is broken.
If sellers take control below $3,978, the next liquidity targets lie around **$3,886** and possibly **$3,614**. This scenario aligns with the broader retracement expectation after a strong prior uptrend.
However, a confirmed breakout above the consolidation area would shift the short-term bias back to bullish, with upside potential toward **$4,248** and beyond.
**Market Outlook:** Neutral → Bearish
**Bias:** Short-term corrective move expected
**Key Levels:**
* Resistance: $4,050 – $4,100
* Support: $3,886 – $3,614
**Tags:** #Gold #XAUUSD #GoldAnalysis #XAUUSDforecast #GoldPricePrediction #GoldTrading #GoldMarket #Commodities #TradingViewIdeas

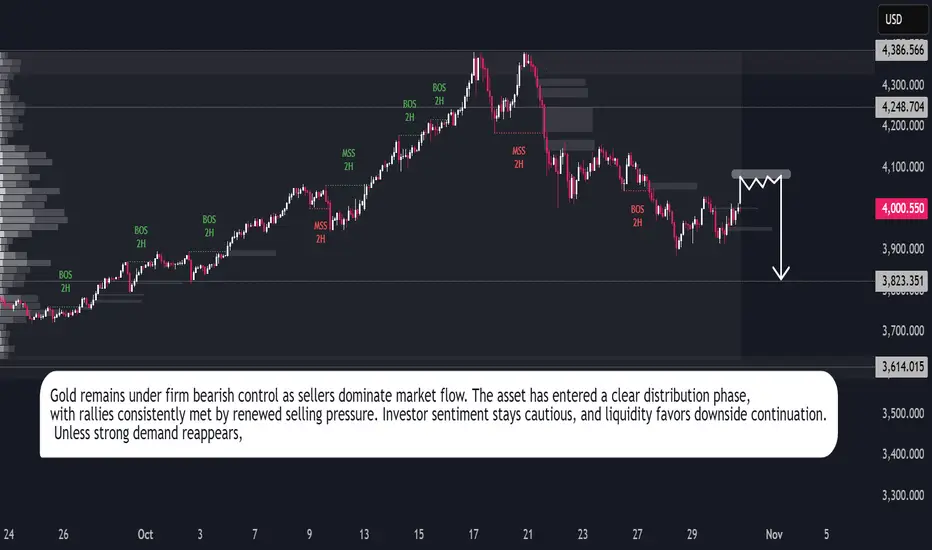
Gold Outlook: Bears Stay in ControlGold continues to operate within a bearish market environment characterized by persistent liquidation and declining momentum. The recent structural shift reflects an ongoing reallocation of capital away from defensive metals toward higher-yield instruments, signaling a broader change in market positioning.
Trading activity indicates that each upward movement is being met with renewed selling interest, suggesting limited participation from institutional buyers. This behavior aligns with the prevailing sentiment of caution, as investors prioritize stability over speculative exposure.
The broader outlook remains subdued, with market conditions favoring continued downside until clearer evidence of renewed demand emerges. Gold’s performance reflects a phase of market adjustment, where declining liquidity and moderate volatility reinforce the persistence of bearish sentiment across the short-term horizon.
Gold Declines as Sellers Dominate the MarketGold is undergoing a controlled correction phase after an extended period of sustained gains. Market behavior over recent sessions reflects a shift from expansion to contraction as liquidity flow decreases and momentum weakens across key time horizons.
The previous upward cycle attracted substantial speculative interest, but current market dynamics suggest profit-taking by institutional participants and reduced accumulation from large holders. The recent structural shift confirms that sentiment has turned defensive, aligning with global market caution amid evolving economic conditions.
Despite short-term consolidation, the broader setup indicates that gold remains sensitive to global financial stability concerns and policy signals. Market participants are now waiting for clarity on upcoming economic data and interest rate outlooks, which could determine whether the correction deepens or transitions into a new accumulation phase.
In the near term, volatility is expected to remain elevated as investors reassess exposure levels. The prevailing outlook maintains a cautious bias, with traders closely observing how price reacts to continued shifts in liquidity and macro sentiment. Sustained capital outflow from hedge assets could pressure gold further, while renewed demand for safety could limit downside potential in the medium term.

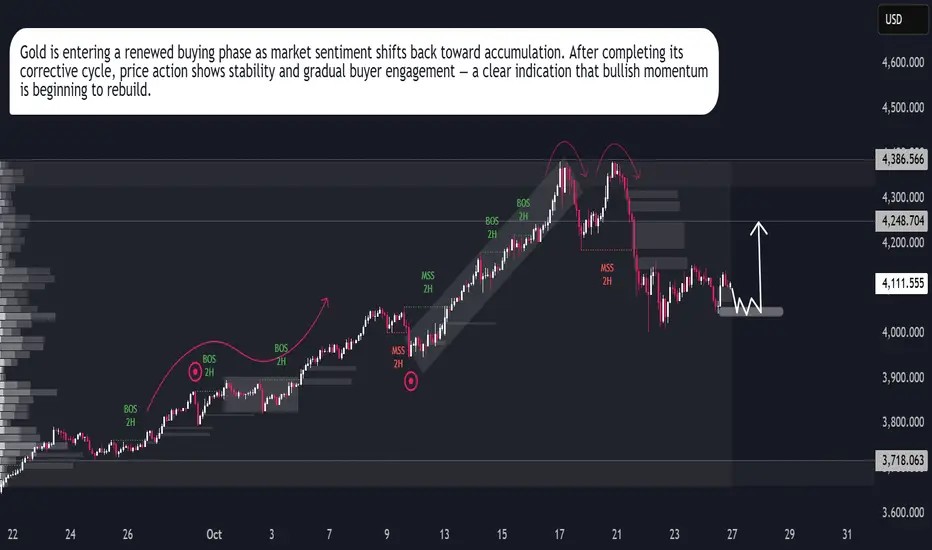
Gold Forecast — Market Turning BullishGold (XAU/USD) maintains a strong long-term bullish trend, supported by rising investor demand and global macroeconomic stability. After completing a healthy correction phase, the market is showing renewed strength, indicating a potential continuation of the broader uptrend.
Current price action reflects accumulation behavior among institutional traders, signaling confidence in gold’s long-term value growth. The consistent pattern of higher lows and steady momentum suggests that buyers are firmly in control, preparing for another upward expansion cycle.
From a fundamental perspective, global inflation concerns, a weaker U.S. dollar, and geopolitical tensions continue to support gold prices. Investors are increasingly seeking protection in safe-haven assets, which further strengthens gold’s long-term position in the market.
Technical structure and sentiment both align with a buy-side outlook, highlighting the potential for gold to extend gains as liquidity continues to build in the current price zones.
In summary, gold remains in a strong buying phase, with market data, investor sentiment, and macroeconomic indicators all favoring sustained upward momentum.
Keywords: Gold forecast, XAU/USD analysis, gold long-term trend, gold price outlook, bullish gold market, gold accumulation phase, forex gold trading, gold price prediction 2025.
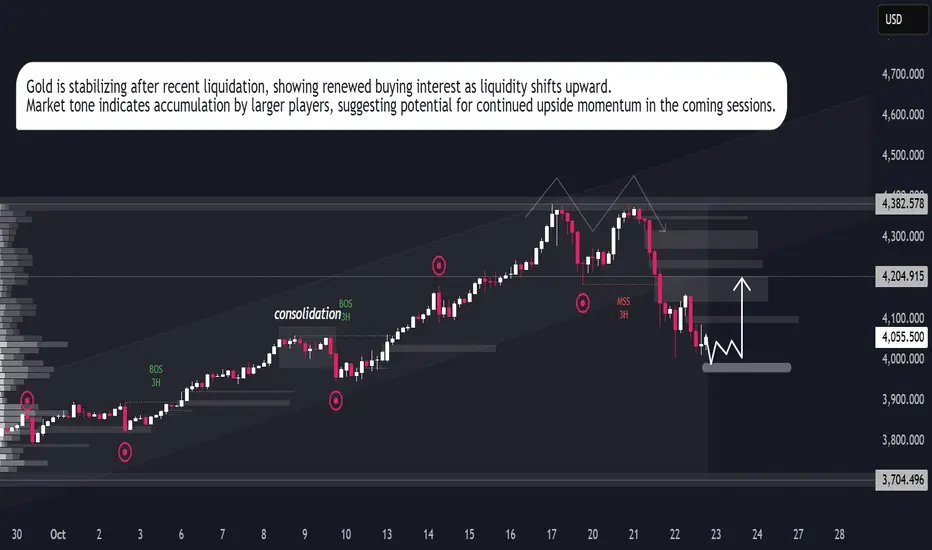
Buy Pressure Building on GoldGold is displaying signs of buyer re-entry after a period of controlled downside movement. The recent liquidity sweep around the lower range indicates that short-term selling pressure has been largely absorbed, creating favorable conditions for a potential upward expansion.
Market activity suggests renewed interest from institutional participants accumulating within the current price zone. The consolidation phase appears to be forming a base, signaling the possibility of a directional shift as liquidity gradually migrates upward. Increasing momentum on the lower end of the range reflects confidence returning to the market, setting the stage for a possible continuation toward higher valuation areas.
The outlook remains constructive as long as current accumulation behavior sustains, with market sentiment leaning toward a recovery-driven advance in the near term.
Gold Whats Next??gold rally lasted 4 years everytime in the past , and are trapped for years
Disclaimer- Just my view and opinion trade at your own risk not an investment advice these are only for educational purposes

XAUUSD | Gold Holds Firm as Buyers Dominate the MarketGold continues to demonstrate a strong and orderly bullish structure, with momentum sustained by a combination of market confidence and macroeconomic positioning. The metal’s consistent upward drive reflects ongoing demand for safety amid lingering inflationary concerns and uncertainty surrounding global economic recovery. Institutional accumulation remains visible, suggesting that investors are positioning ahead of potential policy adjustments and currency fluctuations.
The recent moderation phase appears to be a controlled pause rather than weakness, indicating that buyers are maintaining control while the market digests prior gains. Should current stability in yields persist and geopolitical tensions remain elevated, gold could extend its advance in the medium term, reaffirming its role as a key hedge within diversified portfolios.

Gold → Ready for the Next Bullish WaveGold (XAUUSD) continues to gain momentum as shifting global conditions drive investors toward safer assets. The ongoing uncertainty in financial markets, coupled with renewed concerns over U.S. fiscal policy and interest rate adjustments, has strengthened gold’s long-term appeal.
Recent market behavior reflects consistent institutional demand, with traders positioning ahead of potential monetary easing cycles. As confidence in traditional currencies weakens, gold remains a preferred store of value for both investors and central banks.
Structurally, the market is maintaining a healthy uptrend, showing controlled corrections within a broader bullish framework. The latest price movements suggest that momentum is building for another upward phase, possibly targeting new historical zones if global instability persists.
In summary, gold’s outlook stays constructive — supported by both macroeconomic sentiment and steady technical momentum.
How do you see the XAUUSD trajectory evolving — continuation of growth or a major pause ahead?

Gold Market Analysis – Sell Opportunity Emerging in XAU/USDGold has been climbing with strong momentum, but the current leg is showing signs of transition. After a period of consolidation, the market expanded upward, taking liquidity from previous highs and creating an extended run. This behavior often reflects the final stage of a bullish cycle before rebalancing begins.
What stands out now is the engineered path of price: a push into untested liquidity zones above, followed by a potential shift as large players unwind positions. Once liquidity is collected at the extremes, price tends to rotate back into inefficiencies left behind during the rapid climb.
This suggests gold is not simply trending higher, but moving through a liquidity cycle. The near-term structure favors a sweep of higher levels, then a corrective phase where price retraces to refill imbalances and reset order flow for the next directional move.

Gold Price Today: XAUUSD Sets Stage for Continued Bullish ExpansGold (XAUUSD) Market Report – September 21, 2025
Gold remains positioned near 3,685, with recent price behavior showing a structured climb despite short bursts of volatility. The market is cycling through phases of expansion and retracement, where each corrective leg has been followed by renewed upward momentum. This rhythm signals that buyers are steadily maintaining control of the broader trend.
The current setup reflects a market that is rebalancing efficiently. Short-term pullbacks are being absorbed quickly, keeping pressure aligned toward the upside. The sequence of structural shifts on the chart points to a continuation of this momentum, suggesting that higher valuations are within reach if the present flow persists.
Overall, gold’s tone is constructive, characterized by resilience and sustained demand. The pattern unfolding indicates a market preparing for further expansion, with the potential for continuation into higher ranges in the sessions ahead.

Gold Breaking Limits – Trend Speaks for ItselfGold Breaking Limits – Trend Speaks for Itself
Gold Market Outlook
Gold continues to demonstrate a well-structured bullish cycle, characterized by steady momentum and clean trend development. The market has transitioned from a prolonged consolidation phase into a sustained directional move, where each breakout is validated by controlled retracements. This reflects strong participation and confidence from larger players.
The sequence of market shifts and break-of-structure signals highlight how short-term pullbacks are consistently absorbed, turning into fuel for further expansion. Price action is orderly, with no signs of erratic volatility, showing that buyers remain in control and liquidity is being managed efficiently.
Overall, gold is moving in line with the broader macro sentiment. The rhythm of accumulation, expansion, and continuation suggests that the current cycle has not yet exhausted its potential. While interim pauses are expected, the structural integrity of the trend continues to favor upside development over the medium term.

Strategic Long-Term Perspective on GoldGold Market Analysis – Report View
Gold has delivered a strong bullish cycle after weeks of accumulation. The past phase showed a contracting range where liquidity was built up and multiple structural shifts occurred, signaling preparation for expansion. Once price broke out of that range in late August, momentum accelerated, leading to a clean and sustained rally into September.
The recent move highlights how market flow continues to favor the upside, with each correction acting as a re-accumulation zone rather than a trend reversal. Institutional order flow remains visible, supporting higher valuations as price respects bullish market structure.
Currently, gold is stabilizing after the sharp leg upward. This pause suggests a phase of healthy consolidation, likely absorbing liquidity before attempting the next impulsive wave higher. Overall sentiment remains constructive, with bullish continuation the dominant narrative unless a major structural shift occurs.


Analysis of Gold Spot / U.S. Dollar (4-Hour Chart)
The provided chart for Gold Spot / U.S. Dollar (XAU/USD) on a 4-hour timeframe, published by NaviPips on TradingView.com on June 23, 2025, at 21:50 UTC, offers a technical trading setup with the following key observations:
Current Price and Trend: The price is currently at 3,390.980, showing a slight decline of -0.495 (-0.91%) as per the latest data. The chart indicates a recent downward movement following a peak, suggesting a potential reversal or correction phase.
Entry Level: The suggested entry point is set at 3,391.103, slightly above the current price, indicating a buy opportunity if the price breaks or retests this level. This aligns with the recent price action near the resistance zone.
Stop Loss: A stop loss is placed at 3,440.000, providing a buffer above the recent high to protect against an upward breakout or false signal. This level is approximately 48.897 points above the entry, representing the maximum risk.
Target Levels:
Target 1: 3,360.000, a conservative first target approximately 31.103 points below the entry, aligning with a support zone.
Target 2: 3,298.316, a deeper target indicating a potential continuation of the downward trend.
Target 3: 3,250.000, the furthest target, suggesting a significant move if the momentum sustains.
Price Action and Pattern: The chart highlights a potential descending pattern (labeled 1 to 5), with a notable drop from a peak (2) to a lower level (3), followed by a retest (4) and a projected decline to (5). This could indicate a bearish continuation or a corrective wave.
Risk-Reward Ratio: The distance to the stop loss (48.897 points) compared to the targets (e.g., 31.103 to 141.103 points) suggests a favorable risk-reward ratio, especially for Target 3, making this a potentially attractive trade setup.
Conclusion
This setup anticipates a bearish move from the entry level of 3,391.103, with defined targets and a stop loss to manage risk. Traders should monitor the price action around the entry level for confirmation and be cautious of any unexpected bullish reversal given the recent volatility.

Analysis of Gold Spot / U.S. Dollar (XAU/USD) 15-Minute ChartHistorical Trend: The chart displays the Gold Spot / U.S. Dollar (XAU/USD) price movement on a 15-minute timeframe from June 22 to June 23, 2025. The price experienced a sharp decline from a peak around $3,369.447, followed by a potential reversal pattern.
Key Levels:
Stop Loss: Set at $3,369.447 (red line), indicating the upper limit to exit a short position if the price reverses upward.
Entry: Positioned at $3,362.463 (gray line), marking the entry point for a potential short trade after the peak.
Target 1: $3,353.009 (green line), the first profit-taking level.
Target 2: $3,340.915 (green line), the second profit-taking level.
Target 3: $3,323.157 (green line), the final target for the short trade.
Recent Price Action: The price peaked near $3,369.447 and began a downward move, forming a potential shorting opportunity (labeled 1-5). The chart suggests a bearish pattern with the price breaking below a support level, followed by a retest (2) and continuation downward (3, 4). The current position (5) indicates the price is approaching Target 1.
Projected Movement: The downward projection suggests the price could reach Target 1 at $3,353.009, with potential to hit Target 2 at $3,340.915 and Target 3 at $3,323.157 if the bearish momentum persists. A break above $3,369.447 would invalidate the short setup.
Volume and Indicators: The chart includes Bollinger Bands (O3,362.860 H3,363.070 L3,361.747 C3,362.295) with a -0.615 (-0.02%) change, indicating low volatility. The pattern suggests a momentum shift, though specific volume data is not detailed.
Outlook: The chart outlines a shorting strategy with clear entry and exit levels. The price is currently in a bearish phase, with potential targets at $3,353.009, $3,340.915, and $3,323.157. Monitor for a break above $3,369.447 to reassess the trade, as it would signal a bullish reversal.

XAUUSD Weekly Analysis For June - 23 - June 27 ~~ Fundamental Analysis ~~
Key Drivers
Geopolitical Tensions: Escalating conflicts in the Middle East (e.g., Israel-Iran) continue to drive safe-haven demand for gold. However, recent U.S. delays in decisions regarding Iran conflict involvement have led to investor hesitation, contributing to the current narrow trading range.
Federal Reserve Policy: The Fed maintained interest rates at 4.25%–4.5% on June 12, 2025, with no immediate rate cuts signaled. Fed Chairman Jerome Powell noted that tariffs could increase inflation, potentially capping gold’s upside in the short term. A hawkish Fed stance could pressure gold prices, while global policy easing could support bullish momentum.
U.S. Dollar Strength: A recovering U.S. dollar has exerted downward pressure on gold, as seen in recent pullbacks from highs above $3,450.
Economic Data: Upcoming U.S. labor market data (e.g., May data) and inflation reports (e.g., core PCE price index) could influence gold prices. Rising inflation expectations may drive XAU/USD toward higher prices.
China’s Economy: A weakening Chinese economy due to U.S.-China trade tensions could reduce gold demand, while a recovery could bolster prices.
Long-Term Outlook
Bullish Case: Continued global policy easing, escalating geopolitical conflicts, or a recovering Chinese economy could push gold toward $3,500 or higher in 2025, supported by safe-haven flows.
Bearish Case: Easing geopolitical tensions, persistent inflation, or a hawkish Fed could lead to declines toward $3,000
Refer Chart for your reference
-- Disclaimer --
This analysis is based on recent technical data and market sentiment from web sources. It is for informational purposes only and not financial advice. Trading involves high risks, and past performance does not guarantee future results. Always conduct your own research or consult a SEBI-registered advisor before trading.
#Boost and comment will be highly appreciated

GOLD MCXOn the 4 Hourly Charts Gold MCX has Strong Support Zone around 49900-50000, As it was previous Channel Resistance now acting as support. We may see the uptrend resuming, On should follow strategy to buy on correction and Hold for investment with Stoploss below 49000 on closing basis.
