Gold - Bearish ? Double Top with RSI DivergenceGold was bullish only due to empty words from Trump saying no gold in US, its missing, no one audited for 40 years, no doors and no windows in the store house etc etc. He never took efforts to go and check it or ask for audit report. so in my view its empty words from Trump. It must have helped Russia to offload its tons and tons of Gold accumulated long before the war, Thats the biggest gift Trump given to Putin to book profits in Gold. It has formed double top with clear Bearish Divergence in RSI. In my view its a Sell now and many be buy at lower levels later. No war, no covid and why any one hold Gold at these very high price ?
Goldpattern

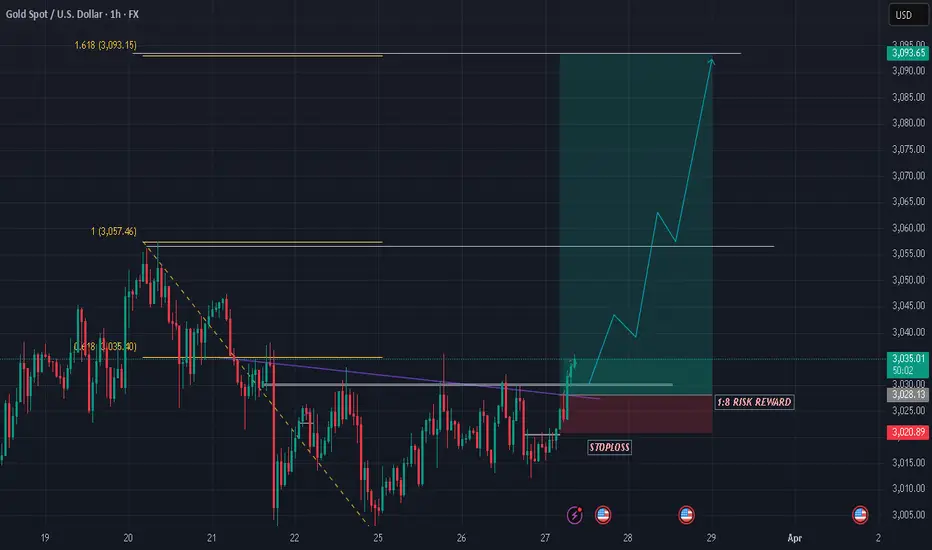
GOLD SHOWING A GOOD UP MOVE WITH 1:8 RISK REWARD GOLD SHOWING A GOOD UP MOVE WITH 1:8 RISK REWARD
DUE TO THESE REASON
A. its following a rectangle pattern that stocked the market
which preventing the market to move any one direction now it trying to break the strong resistant lable
B. after the break of this rectangle it will boost the market potential for break
C. also its resisting from a strong neckline the neckline also got weeker ald the price is ready to break in the outer region
all of these reason are indicating the same thing its ready for breakout BREAKOUT trading are follws good risk reward
please dont use more than one percentage of your capitalfollow risk reward and tradeing rules
that will help you to to become a bettertrader
thank you

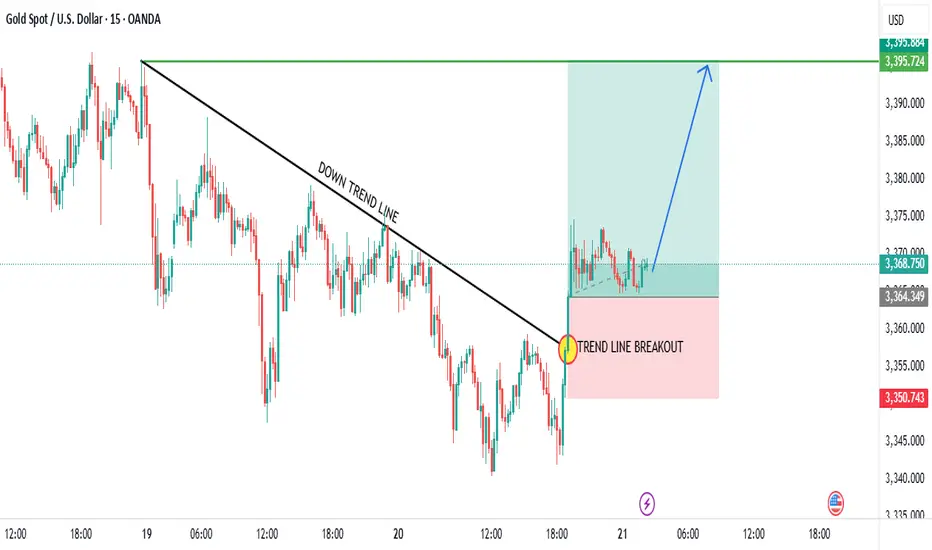
Analysis of Gold Spot / U.S. Dollar (XAU/USD) 15-Minute Chart
Historical Trend: The chart displays the Gold Spot / U.S. Dollar (XAU/USD) price movement on a 15-minute timeframe from June 19 to June 22, 2025. The price was in a clear downtrend, defined by a descending trendline, until a recent shift.
Key Levels:
Resistance: The $3,395.724 level (green line) has emerged as a significant resistance following the breakout. A break above this could confirm further upside.
Support: The $3,350.743 level (red line) acted as a major support during the downtrend and was recently breached upward.
Recent Price Action: The price broke above the downtrend line (highlighted with a yellow circle and labeled "TREND LINE BREAKOUT" in red), indicating a potential reversal. This breakout occurred around 12:00 on June 21, followed by a sharp upward move into a consolidation zone (light green).
Projected Movement: The upward projection (blue arrow) suggests the price could target levels around $3,380.00-$3,400.00 if the breakout momentum continues. The consolidation above $3,350.743 supports the bullish outlook.
Volume and Indicators: The chart includes Bollinger Bands (O3,368.320 H3,369.500 L3,367.660 C3,368.750) with a -0.360 (-0.01%) change, indicating low volatility. The breakout suggests increasing buying interest, though specific volume data is not detailed.
Outlook: The trend line breakout signals a potential shift from bearish to bullish momentum. Maintaining above $3,350.743 is crucial for the uptrend to continue. A failure to hold this level could see the price retest the downtrend line or lower supports. Monitor for confirmation of sustained momentum above resistance.
GOLD SHOWING A GOOD UP MOVE WITH 1:8 RISK REWARD GOLD SHOWING A GOOD UP MOVE WITH 1:8 RISK REWARD
DUE TO THESE REASON
A. its following a rectangle pattern that stocked the market
which preventing the market to move any one direction now it trying to break the strong resistant lable
B. after the break of this rectangle it will boost the market potential for break
C. also its resisting from a strong neckline the neckline also got weeker ald the price is ready to break in the outer region
all of these reason are indicating the same thing its ready for breakout BREAKOUT trading are follws good risk reward
please dont use more than one percentage of your capitalfollow risk reward and tradeing rules
that will help you to to become a bettertrader
thank you
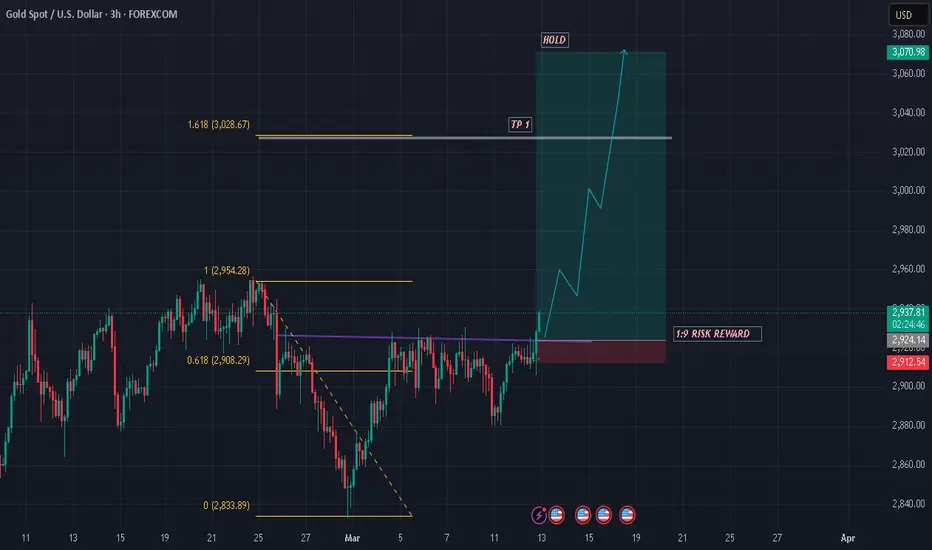
GOLD SHOWING A GOOD UP MOVE WITH 1:9 RISK REWARD GOLD SHOWING A GOOD UP MOVE WITH 1:9RISK REWARD
DUE TO THESE REASON
A. its following a rectangle pattern that stocked the market
which preventing the market to move any one direction now it trying to break the strong resistant lable
B. after the break of this rectangle it will boost the market potential for break
C. also its resisting from a strong neckline the neckline also got weeker ald the price is ready to break in the outer region
all of these reason are indicating the same thing its ready for breakout BREAKOUT trading are follws good risk reward
please dont use more than one percentage of your capitalfollow risk reward and tradeing rules
that will help you to to become a bettertrader
thank you
GOLD FUTURES (mcx) update price is in side ways phase on medium time frame
which mean on lower time frame price will react as buy on low and sell or rise
the range is 59050 resistance and 58280
currently the price is trading at resistance level
on 15m triangle pattern is forming , which is in between of medium time frame pattern , on medium time frame there is bearish flag so im keeping my bias on sell side
and predicting that price we make breakout from triangle pattern and then form a fake out
and price will try to go back at support of 58500-58250
this is my pov dont trade blindly on it use it as a confluence for your own analysis
