XAUUSD Short | 15m |Gold revisited the upper band of the intraday structure and showed clear signs of weakening momentum. Price failed to sustain above the model’s trailing zone, indicating a shift from short-term accumulation to distribution.
The short entry was executed as price broke back below the cloud, supported by a clean loss of intrabalance strength.
Stop is placed above the most recent structural failure.
Primary target sits near the liquidity cluster around 4175.
Goldplan

Chumtrades XAUUSD Weekly Key Levels
Bias: Still favor BUY with the primary trend, watching for pullbacks to lower levels.
Support zones
4307 – 4300 (near-term support, key area to watch)
4260 – 4255 – 4250 (intermediate support)
4178 – 4168 (deep support, strong demand)
Resistance zones
4404 – 4413
4445 – 4465
4500 (ATH)
Weekly / Intraday scenario
Market is likely to trade in a range today.
Expected range:
Lower bound: 4300
Upper bound: 4513
👉 Overall strategy: Monitor price reaction at support zones, especially 4300 and below.

Chumtrades XAUUSD | ATH Is Not a Reason to ShortMacro bias:
US CPI cooled, while expectations for Fed easing in 2026 remain intact. Japanese bond yields surged, signaling capital rotation away from speculative assets and into safe havens like gold. The macro backdrop continues to support gold.
Structure:
Gold has broken above ATH, with the previous high around 438x now acting as support. Short-term high is forming near 4420. The uptrend remains dominant on H1 & M30.
Bias:
👉 Prefer BUYs in line with the trend
❌ Avoid FOMO chasing
⚠️ SELL only for short-term scalps after lower-timeframe structure breaks
BUY zones:
438x (previous ATH)
4350–4353
4336–4330
Invalidation:
A clear close below 4320 opens a move toward 4310 / 4300
In this case, the H1–M30 bullish structure is invalidated
Risk note:
Momentum is very steep → sudden pullbacks are possible. Manage risk tightly and focus on buying at key zones, not emotions.

XAUUSD is ranging before CPI direction comes after the news.Gold is currently consolidating sideways near the upper zone around 434x as the market awaits inflation data and updates from the BOJ. Short-term volatility may occur, but the overall structure remains intact, with no clear breakout signal seen in the previous session.
Before the news, the preferred strategy is to trade within the range. Traders can look for reaction setups when price approaches 4346–4348, with a mandatory stop-loss, as this area has been tested multiple times.
After the news is released, the market is expected to choose a new direction. If price breaks and holds firmly above the 435x zone, the bullish trend will be confirmed. In that case, the focus shifts to buying the breakout, with targets toward the previous high and potentially a new ATH.
👉 Before the news: trade the range – react at key levels.
👉 After the news: wait for confirmation – follow the trend.

Chumtrades XAUUSD Sideway Trading PlanMarket View
Gold is currently moving within a clear sideway structure, with no confirmed signal for a new trend. Price action suggests accumulation and rotation inside defined ranges.
Sideway Structure
Small H4 Box (inner range):
Upper boundary: 4335
Lower boundary: 4290
This is the main short-term trading box where price is reacting most frequently.
Large Sideway Box (outer range):
Upper boundary: 435X
Pay attention to 434X (around 4340–4342)
Lower boundary: 4270
A deeper extension may reach 4256
Intraday Expectation
Sideway behavior remains the primary scenario.
Trading approach:
Sell near the top of the range
Buy near the bottom of the range
No major news today, no clear breakout catalyst.
Risk Note
Manage risk carefully and stay alert for false breakouts.
If price closes decisively outside the larger box, reassess the structure.

Chumtrades XAUUSD Trading PlanMarket Context
During Friday’s session, after the previous range breakout, the market saw strong profit-taking pressure from buyers.
Large capital exits triggered a sharp sell-off of ~96 prices, while the 426X base zone supported price very well.
Overall structure remains bullish.
👉 Session Expectation
Price is likely to move in a sideways range, with the upper–lower boundary around 423X – 428X (personal expectation).
🟢 Key Support Zones
• 4280 – 4282
• 4264 – 4266
• 4255 – 4257
• Deeper support: 424X
🔴 Key Resistance Zones
• 4330 – 4336
• 4347 – 4351 (±4353)
Good day, traders 🤝

Chumtrades XAUUSD Outlook – Will Gold Continue Sideways Today?🎯 XAUUSD – Sideway Day Before FOMC
1️⃣ Market Context
H4 is clearly moving sideways: small candle bodies – long upper and lower wicks, indicating hesitation before FOMC (occurring the night of the 11th into the morning of the 12th).
The price is currently locked in the H4 range:
Lower boundary: 4176–4180
Upper boundary: 4215–4218
Today I am observing the price moving sideways within this range.
2️⃣ Intraday Trading Strategy
🟢 BUY low – priority
Watch for reactions at the zones:
4180 – 4182
4174 – 4178 (bottom of H4 range)
4155 – 415X (most attractive BUY zone)
→ Short target: 4200 – 4210
→ SL below support zone by 100 pips
🔻 SELL high – priority
Watch for reactions at:
4212 – 4218 (top of H4 range)
4230 – 4233 (strong resistance – most attractive sell zone)
→ Target: return to mid-range 4190 → bottom of range 417X
→ SL above resistance zone by 100 pips
The nearest zone is 4202-4198, this entry can be considered
3️⃣ Expected Movement
Today → Sideways within H4 box 4176 ⇆ 4212.
Just trade according to the range: buy low – sell high.
Expected daily fluctuation range is 50-55 prices.
A true breakout may occur tomorrow or the day after, as the market prepares for this week's FOMC.
📌 Note
Prioritize candle reactions at price zones.
Avoid FOMO in the middle of the range.
Divide positions smaller than usual as the market tightens before major news.
Find this analysis useful?
Press Follow to update the plan daily before trading hours and discuss more effective strategies!
Wishing everyone a day of total victory in trading!

Will gold stay sideways before the rate announcement?WILL GOLD CONTINUE TO SIDEWAY BEFORE INTEREST RATE ANNOUNCEMENT? WHAT DO YOU THINK
2 projected scenarios THIS WEEK.
Scenario 1 – Gold moves sideways below 4,200 until close to FOMC
If the price stubbornly stays below 4,200, unable to break through → when FOMC erupts, there's a high chance gold will break through 4,200.
Target falls to: 4,000 – 4,050 → this is the beautiful zone to Buy swing
The nearest zone 409x might have a reaction, pay attention (this zone is for today before fedfundrate)
Scenario 2 – Early week gold strengthens back to 4,200
If early in the week gold recovers well, touching 4,200 → FOMC at this time will become a push to propel gold back up.
Near target: 4,360, returning to test the previous peak.
THE MOST IMPORTANT FACTOR: FED'S TONE.
A 0.25% reduction is almost certain.
But the story lies in what Powell will say.
If Powell is HAWKISH like:
“Only reducing this time, economy is strong, not considering QE yet…”
→ This is strong bad news for gold and the entire asset market.
Gold drops, coins drop, stocks drop...
If the FED softens a bit:
Just a little dovish → gold will bounce extremely fast, no time to react.
In summary for this week
Gold is compressing very strongly around 4,200
FOMC will decide the direction
Major volatility will definitely appear
Just wait for the price to react before taking action — follow the strategy, follow the discipline.
Trade well, everyone.

what do you think about today's gold price?Hello Traders, what do you think about today's gold price?
Today the market will have news related to Unemployment Benefits, so I expect the trading range to be slightly narrow and liquidity relatively low. Please be more cautious in placing orders and managing capital.
Below are the important support – resistance zones I am monitoring today:
🔵 BUY ZONE (Support)
4180 – 4184
4160 – 4165
4150 – 4155
4130 – 4133
➡️ These are strong support zones – prioritize watching for Buy in the Sideway range.
🔴 SELL ZONE (Resistance)
4240 – 4244
4250 – 4255
➡️ These are the upper resistance zones – suitable for watching for Sell when the price rebounds to the range.
👀 NEAREST OBSERVATION ZONE
4217 – 4220
➡️ This is the directional zone, observe price reactions to determine continuation or adjustment forces.
🎯 Trading orientation for the day
Personal style: SL10 price – TP10 price.
Trade within the Sideway range, Buy low – Sell high.
Break any zone, trade that zone, avoid holding orders against the trend.
Low liquidity → trade lightly & manage capital tightly.
⚠️ Note: This is a personal trading plan, not investment advice. Please consider it as reference material.
Wishing you a successful trading day – enter and win! 💹✨

Gold Maintains Bullish Momentum,Watching for Breakout Above 4150📊 Market Overview:
Gold is currently trading around 4140. Market sentiment remains tilted toward buying due to expectations of an upcoming Fed rate cut, while the USD shows mild weakening during the session.
📉 Technical Analysis:
• Key resistance: 4150 – 4162
• Nearest support: 4125 – 4130
• EMA: Price is above the EMA-09, indicating the bullish trend is still intact.
• Candlestick / Momentum:
– The 4150 zone is forming a strong resistance; H1 candles show upper wicks → short-term profit-taking pressure.
– If H1 closes above 4150 → gold may extend to 4175 – 4190.
– If it fails, price may retest 4130.
📌 Outlook:
Gold may continue rising if it breaks above 4150 with a confirmed candle.
Otherwise, if it cannot break 4150 in the next 2–3 H1 candles, the market could retrace to 4130 before rising again.
________________________________________
💡 Suggested Trading Strategy:
🔺 BUY XAU/USD
Entry: 4128 – 4132
🎯 TP: 40 / 80 / 200 pips
❌ SL: 4125

XAUUSD – Reading the Market’s Secret IntentionsH1 Outlook – 24 November 2025
🌐 MARKET CONTEXT
Gold enters the new week with a controlled, slow-paced volatility environment, as the market continues to balance between inflation expectations, shifting USD flows, and cautious positioning ahead of major U.S. data.
Recently, price has shown repeated rejection from premium zones, forming a mild bearish intraday bias across the H1 structure. The market is still operating inside a liquidity-rich environment where institutions are engineering both upside and downside sweeps before choosing a clear direction.
Recent Drivers
USD holds moderate strength after last week’s hawkish Fed commentary
Market remains in “wait-and-watch” mode ahead of mid-week data
No strong risk-off sentiment → gold lacks solid fundamental support
Session Expectations
London: Early liquidity sweeps above premium levels expected
New York: Higher probability of real trend expansion
Bias: Mild bearish unless deep discount zones trigger CHoCH on H1
Price is currently mid-range → only extreme liquidity areas provide safe, high-probability setups.
📉 TECHNICAL ANALYSIS (SMC + LIQUIDITY)
Market Structure
H1 structure forming: Lower Highs → Lower Lows
Equilibrium zone: 4070–4090
Strong inducement layers above 4146 and 4071
Liquidity Map
Buy-side Liquidity (BSL): Above 4146, 4071
Sell-side Liquidity (SSL): Below 4030 and 3994
Market forming engineered wicks at both ends → ideal for SMC traders
Imbalance Zones
Bearish FVG: 4146–4148 → prime area for premium sells
Minor Imbalance: 4068–4071 → intraday scalp reversal potential
Discount Imbalances: 4032 and 3996 → clean reaction zones for buys
🔑 KEY PRICE ZONES
(Clear explanations linked directly to your entries)
4148–4146 ▶️ Premium Sell Zone – High Manipulation Area
Unmitigated supply zone + major BSL buildup.
Smart money usually induces breakout buyers here before reversing sharply.
4068–4071 ▶️ Secondary Premium Pool – Scalp Rejection
A mini-liquidity pocket above equilibrium.
Perfect for quick stop-hunt sweeps during London session.
4032–4030 ▶️ Discount Reaction Zone – Strong Scalping Demand
A small OB + SSL cluster.
Expect fast, technical bounces with low drawdown.
3996–3994 ▶️ Deep Discount Zone – High-Value Reversal
Highly reactive zone where institutions accumulate long positions.
A strong candidate for structural shifts if tapped.
⚙️ TRADE SETUPS (SMC-Driven Execution)
✔️ SELL SETUP 1 – Premium Rejection
Entry: 4148–4146
Stoploss: 4154
TP1: 4135
TP2: 4120
TP3: 4090
Logic: Sweep of BSL + FVG fill → high confidence bearish rejection.
✔️ SELL SETUP 2 – Intraday Scalp Sell
Entry: 4068–4071
Stoploss: 4077
TP1: 4055
TP2: 4043
TP3: 4032
Logic: Engineered liquidity sweep above mid-range → fast downside move.
✔️ BUY SETUP 1 – Scalping Rebound
Entry: 4032–4030
Stoploss: 4024
TP1: 4048
TP2: 4068
Logic: SSL sweep → immediate bounce expected from discount zone.
✔️ BUY SETUP 2 – Deep Discount Buy
Entry: 3996–3994
Stoploss: 3988
TP1: 4010
TP2: 4035
TP3: 4068
Logic: A strong institutional accumulation area → ideal for reversal setups.
🧠 SESSION PLAN & NOTES
Do not trade inside the mid-range
Stick strictly to liquidity extremes for precision entries
Expect London fake-outs → wait for confirmation
NY session more likely to deliver the real move
Use M5/M15 CHoCH + displacement for entry confirmation
🏁 CONCLUSION
XAUUSD is currently holding a mild bearish structure on H1, with premium zones at 4146 and 4071 offering the best sell opportunities.
Discount areas at 4030 and 3994 remain the highest-probability zones for intraday reversals or continuation buys.
Trade with patience. Let the liquidity traps form—then strike with precision.

Strong news chain could push gold to retest 4300🟡 XAU/USD – Weekly Trading Plan (Nov 23–29)
SMC – FVG – Supply/Demand – High-Impact News Week
1. Market Context
Gold is sideways in the H4 accumulation structure, forming higher lows along the trendline.
Above are 3 important supply layers:
OLD FVG 1
OLD FVG 2
Large FVG 4220–4300
the price needs to sweep liquidity & hit the supply zone before creating a new direction.
2. Strong News Schedule for the Week
This week has a lot of USD news directly affecting gold:
Tuesday (Nov 25)
Core PPI – Retail Sales – PPI (4 consecutive red news) → strong volatility.
Wednesday (Nov 26)
Unemployment Claims
Durable Goods → Core Durable Goods
GDP q/q – GDP Price Index
Core PCE (most important inflation news of the week)
➡️ This is the decisive day for the trend for the rest of the week.
Friday (Nov 28)
German CPI (affects EUR → USD indirectly)
🎯 News Conclusion:
→ Gold likely to fake move – sweep liquidity before running correctly.
→ Thin SL zones will be continuously hunted.
3. Key Levels (from the chart you sent)
🔻 SELL Zone (Supply – FVG)
4189 – 4191 (Main Sell)
SL: 4195
This is a strong reaction zone for the week.
4132 – 4134 (Sell scalp)
SL: 4138
🔵 BUY Zone (Demand – Trendline – SMC)
4906 – 4904 (main BUY scalp zone in the chart)
SL: 3999
→ This is the only zone clearly marked as BUY in the chart.
Psychological level: 4000 – 3985
If the price falls → strong reaction to form the weekly low.
4. Weekly Trading Scenarios
🅰️ Scenario 1 – Price retraces to supply zone before dropping (most likely)
Price is forecasted to retest 4132–4134 → 4189–4191
After hitting 4190 ± → potential appearance of:
Bearish BOS H1/H4
Strong reversal to 4050 – 4000
🔻 SELL Plan
Sell 4132–4134 (scalp) SL 4138
Main Sell 4189–4191 SL 4195
TP targets:
TP1: 4090
TP2: 4050
TP3: 4000
🅱️ Scenario 2 – Price dips before news then surges (kill liquidity)
If gold is pushed down before PPI/GDP news:
Best BUY zone: 4000 – 3985
Form a low → surge back up to test supply.
🔵 BUY Plan
BUY 4000–3985
SL: 3975
TP:
4050
4100
4130
🅾️ Scenario 3 – If 4200 breaks
If 4200 is broken by a large-bodied H4 candle:
➡️ High probability gold will move up to test large FVG 4250–4300
→ At that point, only look for BUY pullbacks, no more SELL.

XAUUSD – Where Smart Money Strikes Today🌐 MARKET CONTEXT
Gold enters today’s session after a period of controlled volatility, with price repeatedly reacting around key liquidity pockets but failing to produce a clean breakout. The M30 structure remains bearish, with price rejecting premium levels and forming consistent lower highs.
Recent Drivers
USD stays firm as markets maintain expectations of a slightly hawkish Federal Reserve
Traders await upcoming mid-week data → low conviction, cautious positioning
Overall sentiment remains neutral — no strong safe-haven pressures
Session Outlook
London Session: Likely to engineer early sweeps into premium supply zones
New York Session: Higher chance of real directional expansion
Bias: Bearish intraday until discount zones trigger a CHoCH (shift of character)
Price is currently inside mid-range, so the safest setups remain at extremes where liquidity is concentrated.
📉 TECHNICAL ANALYSIS (SMC + LIQUIDITY)
Market Structure
M30 Trend: Lower High → Lower Low sequence
Equilibrium zone: 4068–4085
Inducement layers resting above 4147 and 4081
Liquidity Levels
BSL: Above 4147 & 4081
SSL: Below 4033 & deep liquidity at 3993
Market continues printing engineered wicks, trapping impulsive traders
Imbalances
Bearish FVG: 4147–4148 → perfect for premium scalp sells
Minor imbalance: 4081
Discount inefficiencies near 4033 and 3993 → ideal buy setups
🔑 KEY PRICE ZONES (Strong Logic + Clear Explanation)
4148–4147 ▶️ Premium Liquidity Trap – High-Quality Sell Zone
This area holds an unmitigated bearish order block combined with buy-side liquidity.
Smart Money typically uses this zone to trap breakout buyers before reversing sharply.
4079–4081 ▶️ Secondary Premium Sweep Zone – Fast Rejection Expected
A mini liquidity pool just above equilibrium, designed for early-session stop hunts.
Often triggers sharp intraday reversals.
4035–4033 ▶️ Discount Reaction Zone – Clean Scalping Demand
This zone holds micro-demand + SSL resting below.
Expect low-drawdown reactions ideal for quick intraday buys.
3995–3993 ▶️ Deep Discount Liquidity Pool – High-Probability Reversal Base
A rich accumulation of Sell-Side Liquidity combined with HTF discount structure.
Strong reversal potential if price reaches this level.
⚙️ TRADE SETUPS (High-Precision SMC Execution)
✔️ SELL SETUP 1 – Premium Rejection Sell
Entry: 4148–4147
Stoploss: 4126
TP1: 4135
TP2: 4120
TP3: 4085
Logic: BSL sweep + bearish imbalance fill → sharp sell-off expected.
✔️ SELL SETUP 2 – Mid-Range Liquidity Sweep
Entry: 4079–4081
Stoploss: 4087
TP1: 4065
TP2: 4048
TP3: 4033
Logic: Quick liquidity hunt above equilibrium followed by displacement.
✔️ BUY SETUP 1 – Intraday Scalping Rebound
Entry: 4035–4033
Stoploss: 4027
TP1: 4048
TP2: 4070
Logic: SSL sweep → micro CHoCH → ideal for fast bullish reaction.
✔️ BUY SETUP 2 – Deep Discount Reversal
Entry: 3995–3993
Stoploss: 3987
TP1: 4010
TP2: 4040
TP3: 4070
Logic: Major discount zone + liquidity buildup → strong reversal potential.
🧠 NOTES / SESSION PLAN
Avoid mid-range trading — only trade at liquidity extremities
Expect London fake-outs; real movement likely in NY
Always wait for M5/M15 confirmation (CHoCH + BOS)
Avoid buying in premium areas; avoid selling in deep discount zones
Follow strict risk management — volatility may spike unexpectedly
🏁 CONCLUSION
Gold continues to hold a bearish intraday structure, favouring premium sell setups at 4147 and 4081.
Discount zones at 4033 and 3993 offer high-probability buy reactions and possible deeper reversals.
Trade with patience. Execute only at liquidity extremes.
Let Smart Money show its trap — then strike with precision.

Gold Drops to 4050 – Testing a Key Support Zone📊 Market Overview:
Gold continues to fall toward the 4050 region as the US Dollar strengthens and US bond yields edge higher, reducing safe-haven demand. The market is now awaiting clearer signals from the Fed minutes and upcoming US economic data, causing bullish momentum to weaken.
________________________________________
📉 Technical Analysis:
Key Resistance: 4072 – 4085
Stronger Resistance: 4095 – 4105
Nearest Support: 4055
Stronger Support: 4045 – 4040
EMA09: Price is trading below the EMA09 on the H1 chart → short-term bearish signal.
Candlestick / Momentum:
H1 candles continue forming lower highs, showing sellers are in control. Volume is gradually decreasing, indicating the market is waiting for a reaction at the 4050 support zone.
________________________________________
📌 Outlook:
• Gold may continue to decline in the short term if price breaks below 4045.
• Conversely, if gold bounces strongly from 4050 with a clear reversal candle, price could retrace toward 4072–4085, and may extend to 4095 if buying pressure strengthens.
________________________________________
💡 Suggested Trading Strategy:
🔻 SELL XAU/USD at: 4082 – 4085
🎯 TP: 40 / 80 / 200 pips
❌ SL: 4088
🔺 BUY XAU/USD at: 4040 – 4037
🎯 TP: 40 / 80 / 200 pips
❌ SL: 4035

Gold NY Session Strategy 11/19: Will up to 4162Gold Daily Plan – SMC Outlook (Nov 20)
Framework: CHoCH – BOS – FVG – POI – Premium/Discount Model
1. Market Context
Gold continues to recover after the sharp drop earlier this week. Price is now approaching the Premium zone of the current bullish swing and tapping into H1 supply. The market shows:
Buyers still in short-term control
Momentum weakening as price reaches resistance
A corrective pullback into Discount is likely before any further expansion
2. Structural Overview (SMC Logic)
🔻 Overall Market Structure
A key BOS formed around 4090–4100 → confirms short-term bullish structure
Follow-up CHoCH signals continuation of the intraday uptrend
Price is moving toward the upper FVG + Supply Zone (4160–4162)
🔸 Orderflow Notes
Strong reaction at the 4140 area → clear presence of passive Sell Limit absorption
Demand POI at 4091–4089 held exceptionally well → main bullish mitigation zone
3. Trading Zones (POI)
✅ BUY Zone (Discount Area)
4091 – 4089
Demand + previous CHoCH + fib 1.272 confluence
Ideal low-risk long setup within Discount
Suggested SL: 4087
BUY Scenario:
Price retraces to POI → shows bullish reaction → long toward Premium.
❗️ SELL Zones (Premium Area)
Aggressive Sell Zone:
4143 – 4145
SL: 4147
Optimal Sell Zone:
4160 – 4162
Major supply + imbalance + fib 2.618 extension
Highest probability for reversal
SL: 4165
4. Trade Scenarios
📌 Primary Scenario (High Probability)
Price retraces into 4091–4089 Demand
Look for CHoCH/BOS confirmation on lower timeframe
Enter BUY → target 4143 → 4160
→ Classic SMC model: Buy from Discount → Sell from Premium.
📌 Alternative Scenario
If price rallies straight into 4143–4162 without retracement:
ONLY enter SELL when a clear bearish CHoCH or strong rejection forms
Target: 4100 → 4090
5. Intraday Bias
→ Bullish in Discount zones – Bearish in Premium zones.
Trade based on orderflow → Do not chase price in the middle range.
6. Summary
BUY: 4091–4089 (SL 4087) → TP: 4140 – 4160
SELL:
• 4143–4145 (SL 4147)
• 4160–4162 (SL 4165)
Wait for confirmation at each POI; avoid mid-range entries.

XAUUSD – Intraday H1 Plan: Liquidity Sweep or Reversal Base?Date: November 4, 2025
Timeframe: H1
🌐 MARKET CONTEXT
Gold is consolidating between $3,976 and $4,006 after a volatile session yesterday.
Market sentiment remains mixed, as traders weigh the rebound in U.S. Treasury yields against ongoing geopolitical and inflation concerns.
Recent move: Gold rebounded from the $3,975 low after a minor liquidity sweep below last week’s range.
Sentiment: Neutral-to-bullish in the short term — safe-haven demand still provides a soft floor.
Sessions to watch:
London session: Expect retracement and liquidity grab below intraday lows.
New York session: Possible expansion to the upside if $4,000 zone holds as support.
Macro Bias: Mildly bullish if price maintains structure above $3,980–$3,985; potential liquidity sweep downside before reversal.
📉 TECHNICAL ANALYSIS (SMC + LIQUIDITY STRUCTURE)
Market Structure:
H1 is forming a short-term accumulation range with liquidity resting below $3,976 (SSL) and above $4,006 (BSL).
A break and close above $4,005.5 may trigger a short-term BOS → potential push toward $4,015–$4,020.
Key SMC Confluences:
$4,200–4,230 Extended Resistance – higher untested supply if momentum returns.
Demand Zone: $3,978–$3,980 → aligned with FVG + previous sweep low.
Supply Zone: $4,004–$4,006 → previous OB + high liquidity.
🔑 KEY PRICE ZONES
Price Zone Type Explanation
4,006–4,004 🔴 Supply Previous high + BSL liquidity
3,996–3,994 🟡 Resistance Equilibrium rejection zone
3,986–3,984 🟢 Demand OB + CHoCH base support
3,980–3,978 🟢 Strong Demand SSL sweep + FVG confluence
3,976–3,974 ⚠️ Liquidity Sweep Deep liquidity / stop-hunt zone
⚙️ TRADE SETUPS
✅ BUY SCENARIO 1– Deep Sweep Recovery
Entry: 3,968–3,966
Stoploss: 3,960
TP1: 3,988
TP2: 3,996
TP3: 4,004
Logic: SSL sweep below the range + FVG mitigation → bullish reaction expected during London open.
🚫 SELL SCENARIO – Supply Rejection
Entry: 4,010–4,008
Stoploss: 4,016
TP1: 3,994
TP2: 3,986
TP3: 3,980
Logic: Price sweeps the previous BSL liquidity above $4,006 → look for bearish CHoCH + confirmation candle M5 before entry.
⚠️ SCALPING SELL – Aggressive Short
Entry: 4,008–4,009
Stoploss: 4,012
TP: 3,998 – 3,990 – Open
Logic: High-risk scalp at liquidity spike above day’s high; confirm rejection with volume drop.
🧠 NOTES / SESSION PLAN
Prioritize long setups near $3,980–3,984 zone during London open.
Look for liquidity sweep before entering — avoid premature entries.
During NY session, re-evaluate if gold re-tests the $4,004–$4,006 supply zone.
Avoid overtrading; use smaller position sizing due to narrow range ($30).
Always wait for H1 close confirmation before committing.
🏁 CONCLUSION
Gold remains range-bound within $3,976–$4,006, but the structure hints at a potential bullish bias if liquidity below $3,978 is swept first.
The preferred buy zones are $3,984–$3,986 and $3,978–$3,980, while sell reactions may occur near $4,004–$4,006.
Expect whipsaw volatility between London and NY overlap; trade only with clear SMC confirmations and proper risk control.
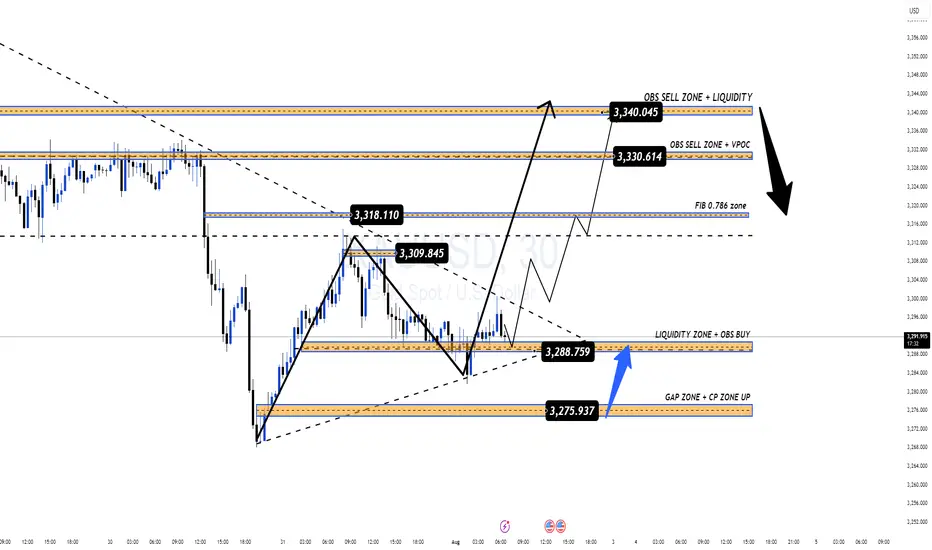
PROACHING LIQUIDITY ZONE – WAITING FOR CPI TO DECIDE NEXT MOVE📌 MARKET RECAP
Gold kicked off the week with a sharp $50 drop, breaking through key trendlines and nearby support zones.
The selling pressure came from:
Profit-taking after the recent strong rally.
USD strength expectations ahead of CPI data (forecast ~0.1% better than the previous reading).
Geopolitical factor: Ukraine–Russia ceasefire talks moving towards a conclusion, fueling risk-off sentiment.
🧐 WHAT’S NEXT?
If CPI beats expectations → USD strengthens → Gold could drop further into the Liquidity Zone 333x – 330x.
If CPI disappoints → USD weakens → Gold may quickly bounce back toward key level 337x (previous breakdown zone) for a retest before deciding direction.
🎯 MMFLOW GAME PLAN
1️⃣ BUY SCALP
📌 Entry: 3331 – 3329
📌 SL: 3325
📌 TP: 3335 – 3340 – 3345 – 3350 – 3360 – 3370 – 3380
2️⃣ BUY ZONE
📌 Entry: 3310 – 3308
📌 SL: 3304
📌 TP: 3314 – 3318 – 3322 – 3326 – 3330 – 3335 – 3340 – 3350 – 3360 – ???
3️⃣ SELL SCALP
📌 Entry: 3363 – 3365
📌 SL: 3370
📌 TP: 3360 – 3356 – 3352 – 3348 – 3344 – 3340
4️⃣ SELL ZONE
📌 Entry: 3376 – 3378
📌 SL: 3382
📌 TP: 3372 – 3368 – 3364 – 3360 – 3355 – 3350 – 3340
⚠️ RISK NOTE
CPI is the market’s dice roll – even a small deviation could trigger massive stop hunts.
Always watch the KeyLevels marked on the chart before entering trades.
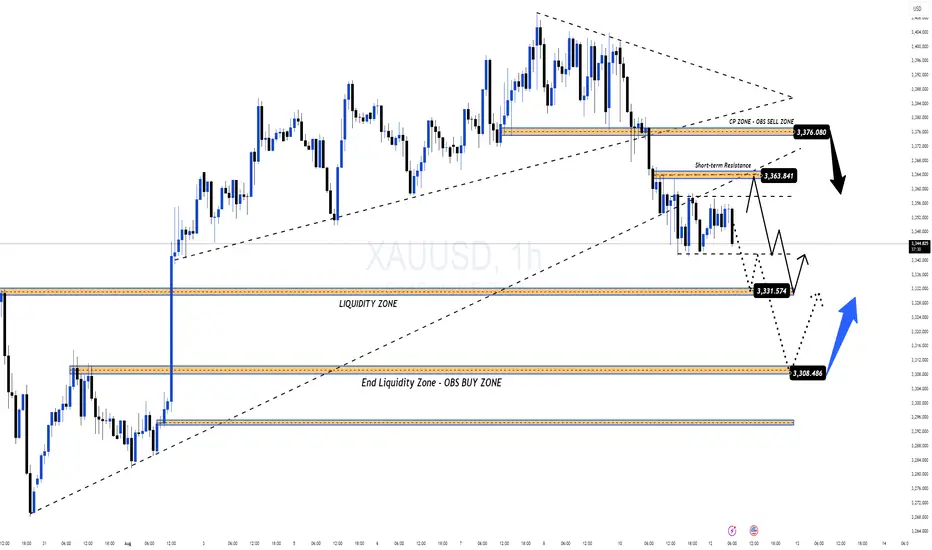
XAUUSD Weekly Plan Final Bullish Push Before a Liquidity Sweep?XAUUSD Weekly Plan – Final Bullish Push Before a Liquidity Sweep?
1. Market Context
Last week, Gold kept moving inside the H2–H4 bullish channel, pushing into the FVG High Zone and approaching the major resistance at 3426–3428 (OBS Sell Zone).
Momentum is fading – candles are compressing, and volume is dropping – signaling potential distribution.
2. Macro Outlook (High-Impact USD Data Ahead)
CPI – Aug 12 → Primary driver.
PPI – Aug 14 → Usually a leading signal for CPI.
Unemployment Claims – Aug 14 → Short-term impact.
Expectations:
CPI & PPI likely better than previous month → USD strength → Gold correction (liquidity sweep to the downside).
Weaker-than-expected CPI/PPI → USD weakness → Gold could spike for one last bullish leg before reversing.
3. Technical Overview
H2 bullish channel top aligns with FVG High Zone → big players’ sell limit & profit-taking area.
Main scenario: Test 3426–3428 → Bearish reaction → Channel breakdown → Retest 3395–3400 (VPOC) → Drop toward liquidity pools below.
4. Key Levels
SELL Zone: 3426 – 3428
SL: 3434
TP: 3420 → 3415 → 3410 → 3405 → 3400 → 3395 → 3390 → 3380 → 3370 → 3360
BUY Zone: 3330 – 3328
SL: 3322
TP: 3335 → 3340 → 3350 → 3360 → 3370 → 3380
5. Trading Plan
🔹 Primary SELL Setup:
Wait for price to reach 3426–3428 with H1/H2 bearish candle confirmation.
Take profits gradually at each downside target.
🔹 Counter-trend BUY:
Enter only if price sweeps liquidity into 3330–3328 with strong bullish reaction.
6. Trader’s Notes
Gold may still push $30–$40 higher early next week before hitting OBS Sell Zone.
Expect large SELL volume once in this zone (profit-taking + top-picking by big players).
This should be a short-term correction, not a full trend reversal.
Best to SELL from highs and hold after a confirmed channel breakdown.
7. Risk Note
High-impact week → Possible false breaks before/after CPI & PPI.
Avoid oversized positions during news releases.
A break & hold above 3434 with strong volume invalidates SELL scenario → wait for new structure.
📌 Summary:
Bias: SELL from 3426–3428 → Target liquidity pools down to 3360.
Backup Plan: BUY from 3330–3328 if liquidity grab confirmed.
Manage risk tightly, especially during high-volatility events.
— MMFlow Trading

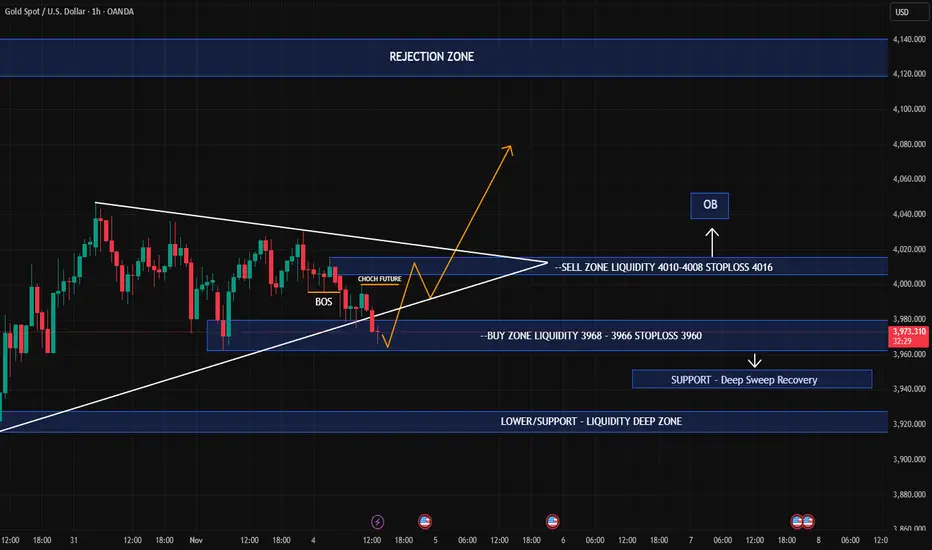
GOLD NFP Plan – Waiting for Breakout & Riding the Bullish Wave – GOLD NFP Plan – Waiting for Breakout & Riding the Bullish Wave
Gold is currently trading inside a large sideways triangle pattern, with price compressing toward the apex. However, based on recent candle structure and yesterday’s reaction at the key level, there’s strong momentum building for bullish continuation—likely forming a Wave 3 breakout if price can decisively break above the current descending trendline.
🔎 Technical Breakdown:
✅ BUY ZONE: 3276 – 3274 (confluence of CP ZONE + GAP + OBS BUY from yesterday)
📈 Price already reacted with +160 PIPS profit from this zone, confirming buyer control
⛓️ Descending trendline is compressing price – a breakout above it could unleash strong bullish momentum
🔄 SELL ZONE: 3339 – 3341 marked by OBS SELL ZONE + liquidity layer
📰 Fundamental Focus:
Today is Nonfarm Payrolls (NFP) day. With current forecasts pointing toward weaker-than-expected U.S. job data, the dollar could face pressure—creating the perfect scenario for gold to spike higher on BUY-side FOMO.
📌 Trade Plan:
🎯 BUY ZONE: 3276 – 3274
❌ Stop Loss: 3270
🎯 Take Profits:
3280 – 3284 – 3290 – 3294 – 3300 – 3305 – 3310 – 3320 – 3330 – 3340 – 3350
⚠️ SELL ZONE (counter-trend): 3339 – 3341
❌ Stop Loss: 3345
🎯 Take Profits:
3335 – 3330 – 3325 – 3320 – 3315 – 3310 – 3305 – 3300
📌 Key Notes:
Favor BUY setups in line with the trend—focus on reaction zones outlined on the chart.
If NFP data is bearish for the dollar, wait for strong confluences before entering any SELL, and avoid shorting prematurely against bullish momentum.
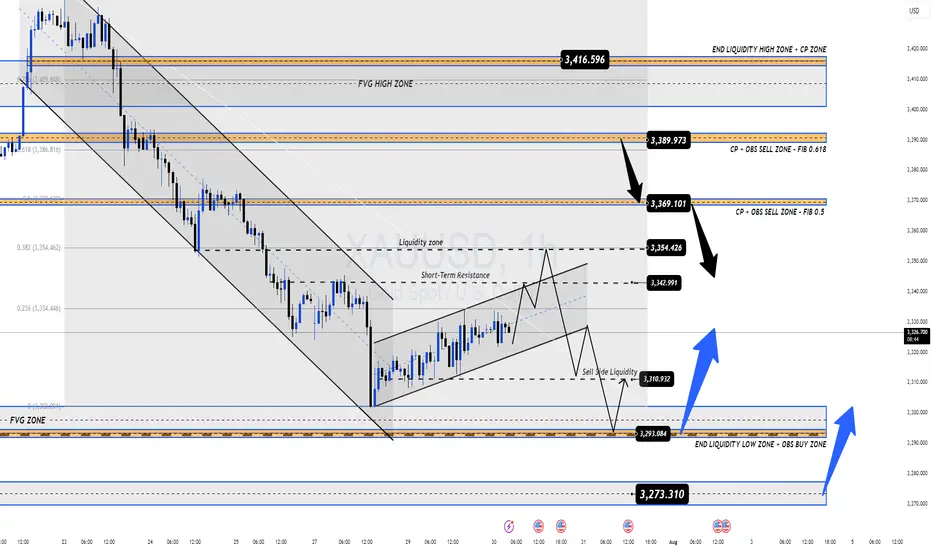
GOLD: Is This a Bottom or the Calm Before the Storm?🌐 Fundamental & Macro Landscape
The recent US–EU trade and defense pact has temporarily reduced gold’s appeal as a safe haven.
The US Dollar and stock markets remain strong thanks to positive macroeconomic data.
Current sentiment is risk-on, which typically shifts capital away from metals and into riskier assets.
But the real volatility could come later this week:
📅 High-Impact Events to Watch:
US ADP Employment Report
FOMC Statement + Nonfarm Payrolls (NFP)
These will likely decide whether gold resumes its uptrend or continues sliding lower.
📊 Technical Outlook (H1–H4)
Gold is currently trading within a parallel bullish channel after rebounding from local lows.
However, price is now approaching a key resistance zone around 3342, where we might see either a breakout or a rejection, depending on market sentiment during the upcoming data releases.
🔍 Key Price Zones
🔺 Short-Term Resistance: 3342
🔺 Major Supply Zone: 3369–3388 (Order Block + FVG + Fib 0.5–0.618)
🔻 High-Liquidity Demand Area: 3293–3290
🔻 Deep Demand Zone (FVG): 3275–3273
🔺 Long-Term Resistance Target: 3416
📈 Trade Plan – Based on Price Reaction, Not Prediction
The best trades come from waiting for the right reaction at key zones. No chasing. No guessing.
✅ Scenario 1 – Buy the Dip (Scalp Setup)
Entry: 3293 – 3291
Stop Loss: 3286
Targets: 3296 → 3300 → 3304 → 3308 → 3312 → 3315 → 3320 → 3330
🟢 Works well in high-liquidity zones for quick short-term gains.
✅ Scenario 2 – Buy from Deeper Support (Swing Setup)
Entry: 3275 – 3273
Stop Loss: 3269
Targets: 3280 → 3284 → 3288 → 3292 → 3300 → 3305 → 3310 → 3320 → 3330
🟢 Great setup if price absorbs selling pressure and reverses from FVG demand.
❌ Scenario 3 – Short from Short-Term Resistance
Entry: 3340 – 3342
Stop Loss: 3346
Targets: 3335 → 3330 → 3325 → 3320 → 3310
🔴 Valid only if price fails to reclaim above 3342.
❌ Scenario 4 – Short from Major Supply Zone
Entry: 3369 – 3372
Stop Loss: 3376
Targets: 3365 → 3360 → 3355 → 3350 → 3345 → 3340 → 3330 → 3320
🔴 Higher risk – only act after confirmation (e.g., rejection wicks or bearish candle pattern).
⚠️ Risk Management Tips
Avoid entering right at London or New York opens – too much volatility and false breakouts.
Always wait for confirmation (candle rejection, pin bars, engulfing, etc.).
Use strict stop-loss rules – FOMC + NFP can spike price in both directions.
💡 Final Tips for Indian Traders
Trade with patience – the best setups often appear when others are panicking.
Respect your capital – don’t overleverage during high-volatility news events.
Focus on price action – not emotions or fixed bias.
📌 If you found this gold analysis helpful, feel free to drop your thoughts in the comments or follow for daily updates on XAU/USD.
Let’s grow and trade smarter, one setup at a time.
Namaste 🙏 | Trade safe, trade with clarity.
GOLD: Is This Just the Calm Before a Bigger Move? – GOLD: Is This Just the Calm Before a Bigger Move?
Gold has dropped nearly $50 in the last 4 sessions — showing strong bearish momentum, but is the downside exhausted? Or is this just a pause before continuation?
🔍 Macro Drivers:
Recent US–EU defense and trade agreements have weighed on gold's safe-haven appeal.
Strong US economic data has pushed USD and equities higher, redirecting flows out of precious metals.
Market sentiment is leaning short-term risk-on, which is bearish for gold – but key technical levels are approaching.
📊 Technical Context – H12 Structure:
Price broke below 3,342 key support, retested it and rejected — validating short-term supply zone.
Price is now consolidating between Sell-side liquidity (3,301–3,292) and deeper FVG/OBS zone around 3,270.
Above, multiple sell zones align at Fib 0.5–0.618 retracement with order blocks and fair value gaps.
🔧 Trade Scenarios (Plan for Reaction – Not Prediction):
🟢 BUY SCALP – Quick bounce off demand zone
Entry: 3,292 – 3,290
SL: 3,285
TPs: 3,296 → 3,300 → 3,305 → 3,310 → 3,315 → 3,320 → 3,325 → 3,330
📍Low-risk intraday bounce play from liquidity pocket
🟢 BUY SWING – Deeper test of FVG/OBS zone
Entry: 3,272 – 3,270
SL: 3,265
TPs: 3,276 → 3,280 → 3,284 → 3,288 → 3,292 → 3,294 → 3,300 → open
📍Higher R:R setup if price sweeps final liquidity zone
🔴 SELL SCALP – Rejection from short-term resistance
Entry: 3,340 – 3,342
SL: 3,346
TPs: 3,335 → 3,330 → 3,325 → 3,320 → 3,310
📍Reaction-based trade if price fails to reclaim the zone
🔴 SELL SWING – Deeper pullback into macro zone
Entry: 3,370 – 3,372
SL: 3,376
TPs: 3,365 → 3,360 → 3,355 → 3,350 → 3,345 → 3,340 → 3,330 → 3,320
📍FVG + CP zone overlap with strong OB; ideal for patient sellers
⚠️ Risk Notes:
Watch for false breakouts/liquidity traps near session opens.
Wait for price confirmation; reaction over prediction.
Maintain disciplined risk management – this is a volatile area.
🧭 I’ll be tracking price behavior at these zones closely.
If this approach to mapping price action resonates with you —
Feel free to stay connected or share your bias in the comments.

Watch for a Potential Pullback (July 23) - GOLD PLAN XAUUSD – Is the Bullish Wave Losing Steam? Watch for a Potential Pullback (July 23)
📰 Market Overview
Gold made a strong rally last night, fueled by:
Fed Chair Powell’s speech, which avoided any controversial remarks or hints about stepping down.
Rising geopolitical tensions between the US, China, and the EU, with August 1st looming as a critical deadline.
A dip in US bond yields and the dollar, giving risk assets — including gold — room to rise.
While there’s no major news on today’s calendar, the market could remain volatile within a wide range.
📉 Technical Outlook
Gold seems to be wrapping up its bullish wave as seen on the H4 chart. On the H1 and M30 timeframes, reversal candles are starting to form — an early signal of potential correction.
The short-term support at 3412 – 3410 is the key zone to watch. If that breaks and we get a clean breakdown from the trendline, a deeper pullback could be underway — possibly heading toward liquidity zones lower down.
Two main Fair Value Gap (FVG) areas on H1 are also in play as high-probability liquidity targets.
Down at the 335x region, we have a confluence of FIB 0.618 retracement and historical buying interest — making it an attractive zone for long setups if the price reacts properly.
📌 Trade Setups for Today
🔻 SELL ZONE: 3469 – 3471
Stop Loss: 3475
Take Profits: 3465, 3460, 3455, 3450, 3445, 3440, 3430, 3420
→ Ideal zone to look for bearish setups after a retest.
🔸 BUY SCALP: 3385 – 3383
Stop Loss: 3379
Take Profits: 3390, 3394, 3398, 3402, 3406, 3410
→ Short-term buy for intraday traders catching the pullback.
🔹 LONG-TERM BUY ZONE: 3356 – 3354
Stop Loss: 3350
Take Profits: 3360, 3364, 3368, 3372, 3376, 3380, 3390, 3400
→ This is the deep liquidity zone worth watching for high-conviction buy entries.
⚠️ Risk Reminder
With fewer news catalysts, gold may trap traders by sweeping liquidity in both directions.
Stick to your plan, follow TP/SL strictly, and avoid chasing price. Let the market come to you.
💬 Sometimes the best trade is waiting for the right level. Stay patient, stay sharp.

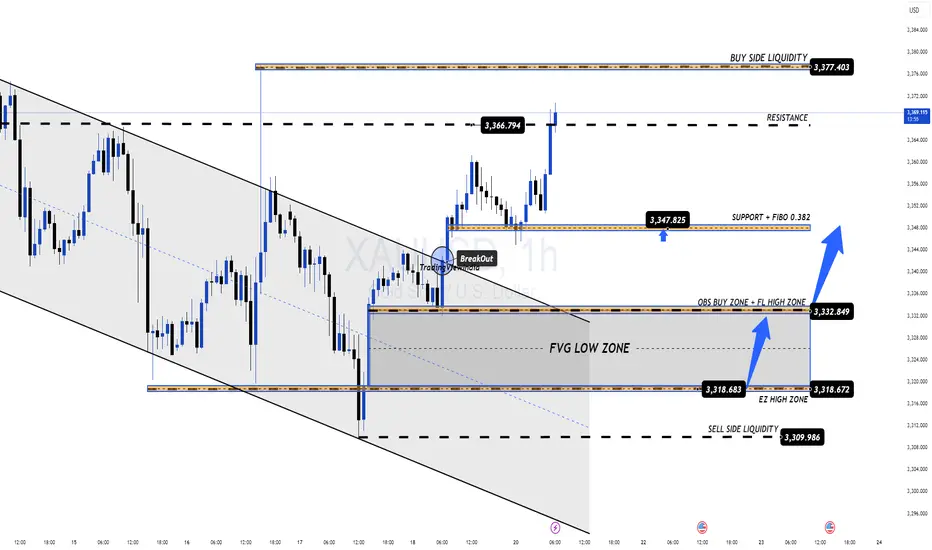
GOLD PLAN 21/07 – START OF THE WEEK FACES STRONG RESISTANCE GOLD PLAN 21/07 – START OF THE WEEK FACES STRONG RESISTANCE – WAIT FOR CONFIRMATION!
Market Overview:
Gold rebounded swiftly after a minor correction late last week, mainly fueled by ongoing geopolitical tensions. While there are no major economic events scheduled this week, macro headlines and global conflicts will likely drive volatility and direction for gold prices in the coming sessions.
Technical Outlook:
Price is quickly approaching a key resistance zone and may retest the Buy Side Liquidity area around 3377 – 3380.
A short-term reaction from sellers is possible, aiming to fill the Fair Value Gaps (FVG) below.
⚠️ Selling at current levels carries higher risk unless clear reversal signals appear. Patience is key!
Trading Plan for Today:
🔹 BUY ZONE: 3331 – 3329
SL: 3325
TP Targets:
3335 – 3340 – 3344 – 3348 – 3352 – 3358 – 3364 – 3370
🔹 SELL ZONE (risky – confirmation needed): 3377 – 3379
SL: 3383
TP Targets:
3372 – 3368 – 3364 – 3360 – 3350
Key Notes:
The 3347 zone currently acts as short-term support for bulls. If this breaks, gold may slide back to fill lower FVG zones.
Watch closely for volume activity during the London session to confirm intraday bias.
Always respect your SL/TP levels to protect your capital, especially early in the week when volatility can spike unpredictably.
💬 Stay patient, trust the structure, and let price come to your zones. Trading is a game of waiting, not chasing!
Good luck, traders!