GOLD (XAU/USD) – Bullish Continuation Toward Higher Highs🔍 Technical Analysis (H1):
Market Structure:
Gold remains in a strong bullish structure with clear higher highs & higher lows ✔️, firmly respecting the ascending trendline 📈.
Breakout & Momentum:
Multiple clean breakouts above previous resistance zones confirm strong buying pressure 💪. Each breakout is followed by healthy pullbacks, showing controlled bullish momentum.
POI → Pivot Support:
Previous POI zones have successfully flipped into support 🔄, and price is currently holding above the Pivot Point zone, which strengthens bullish continuation bias 🟢.
Current Price Action:
Price is consolidating above the pivot area, suggesting a brief pause before the next impulsive move higher ⏳➡️⬆️.
🎯 Upside Targets:
Target 1: 5,300 🎯
Target 2: 5,330 🎯🎯
Extended Target: 5,360+ 🚀 (if bullish momentum accelerates)
🛡️ Invalidation / Support to Watch:
Bullish bias remains valid as long as price holds above the Pivot Point zone. A break below may trigger a deeper pullback, not trend reversal ⚠️.
📌 Conclusion:
Overall trend is bullish, structure is healthy, and price action favors a continuation toward the marked target zone after minor consolidation 📦➡️🚀.
✨ Trade with the trend & manage risk wisely! 💼📊
Goldprediction

GOLD (XAU/USD) – Bullish Continuation Toward Premium Zone🔍 Technical Analysis Breakdown
Market Structure: Clear bullish structure with higher highs & higher lows intact ✔️
Trendline: Price continues to respect the ascending trendline, confirming strong upside momentum 📈
Breakouts: Multiple confirmed bullish breakouts from consolidation and range zones 🔓
Volume: Strong bullish volume expansion during impulsive moves, validating institutional participation 💥
POI (Point of Interest): Repeated reactions from POI zones, acting as reliable demand areas 🎯
Pivot Point: The green pivot zone is holding as dynamic support after the pullback 🟩
Pullback: Current retracement is corrective and healthy, indicating accumulation before continuation 🔄
🎯 Targets & Trade Projection
Primary Target (TP1): 🟢 4,850 – 4,860
Extended Target (TP2): 🟢 4,890 – 4,920 (premium supply / liquidity zone)
Bullish Continuation Zone: Grey consolidation box → expected higher-low formation then expansion ⬆️
🛑 Invalidation / Risk Level
Bias invalidated below: ❌ 4,740 – 4,720 (High Pivot / trendline break)
✨ Trade Bias: Bullish Continuation
📍 Strategy: Buy pullbacks above pivot | Hold longs while trendline holds
📌 Key Message:
As long as GOLD holds above the pivot point + rising trendline, the path of least resistance remains upward toward the marked targets 🚀💰

Bear active in BTCIt may be a opportunity to short for btc as per priceaction but everything is guess only and taking risk consider money management
I am only a learner plz don't trade on my analysis do your learn price action go for practice

XAUUSD (Gold) | Bullish vs Bearish Scenario | Trading SetupBullish vs Bearish View
Bullish Scenario (Primary Bias – Trend Continuation)
Trend remains strongly bullish as long as price holds above the pivot zone (4858–4845).
Buyers are in control, supported by ADX strength, MACD momentum, and moving average
alignment.
Break and hold above 4888 opens the door for further upside expansion.
Bearish Scenario (Corrective Pullback Only)
Bearish moves are considered corrective, not trend-reversing, unless price falls below 4800.
Overbought conditions may trigger short-term profit booking, but trend remains bullish
above key supports.
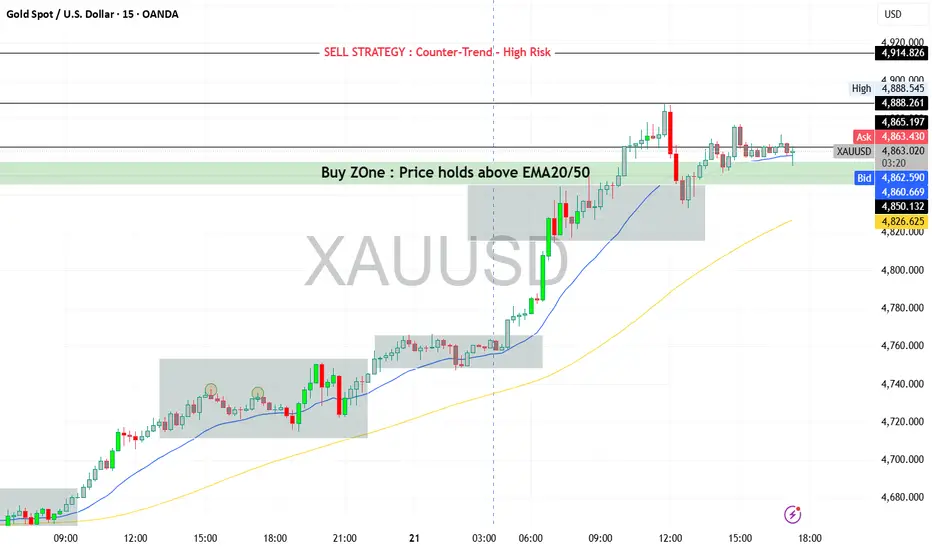
Key Levels to Watch
Resistance Levels
4888 – 4895 (Day high / breakout zone)
4914
4939 – 4950 (extension zone)
Support Levels
4858 – Pivot
4845
4829
4803
4773 (strong trend support)
Intraday Trading Strategy (Day Trading Plan)
Strategy Type:
Trend Continuation Buy-on-Dips
Buy Setup
Buy Zone: 4858 – 4845 (pivot support / minor pullback)
Confirmation:
Price holds above EMA20 / EMA50
Bullish rejection candle or continuation pattern on M15–M30
Targets
Target 1: 4888
Target 2: 4914
Target 3 (extension): 4939
Stop Loss
Intraday SL: Below 4825
Aggressive SL: Below 4800 (trend invalidation zone)
Alternative Sell Strategy (Counter-Trend – High Risk)
⚠️Only for experienced traders
Sell Zone: 4914 – 4940
Condition: Clear rejection + bearish divergence on M15/M30
Target: 4880 → 4858
Stop Loss: Above 4955
Preferred Trading Style Today
✔️Buy on dips
❌Avoid chasing price at highs
❌Avoid heavy counter-trend sells
XAU/USD – Bullish Range Breakout with Pivot Support | Target in Technical Analysis (H1):
📊 Market Structure:
Gold maintains a strong bullish structure with clear Higher Highs & Higher Lows ✅, perfectly aligned with the ascending trendline 📈.
📦 Range → Breakout:
Price consolidated inside a range 🔄 and then delivered a clean bullish breakout 💥, signaling accumulation and continuation strength.
🎯 POI (Point of Interest):
Multiple POI reactions 🟢 confirm aggressive buyer interest at demand zones, reinforcing bullish conviction.
🔁 Pivot Point Flip:
The marked pivot zone has flipped from resistance into strong support 🟩 — a textbook bullish continuation signal.
🕯️ Current Price Action:
Price is holding above the pivot point and consolidating bullishly, indicating acceptance at higher levels 📌.
🎯 Upside Target Projection
🎯 Primary Target: 4,750 – 4,760
(Liquidity zone & projected resistance)
🔄 Expected Path:
Minor pullbacks inside the grey zone 🔍 ➝ continuation toward the target 🚀
❌ Invalidation Level
⚠️ A strong H1 close below the pivot support (~4,690–4,700) would weaken the bullish bias and signal possible range re-entry.
Bias: 📈 Bullish Continuation
Trade Idea: 🧠 Buy pullbacks above pivot 🟢 | Aim for liquidity at highs 🎯🚀

Gold Rotating After CHoCH – Liquidity Controls the FlowGold is currently trading in a post-impulse, post-breakout environment.
After the earlier expansion and BOS, price did not continue trending cleanly.
Instead, it transitioned into sideways consolidation, signaling Smart Money rebalancing rather than continuation.
This is not indecision — this is liquidity management.
Market Structure & Liquidity Context
• Higher-timeframe structure shows a breakout followed by hesitation, a classic sign of distribution and absorption.
• Price spent time ranging, engineering liquidity on both sides before expansion.
• A clear CHoCH formed after the sell-off, confirming the shift from expansion into controlled rotation.
• The 4610–4608 zone aligns with prior structure and demand, where Smart Money defended price aggressively.
• From this discount reaction, price expanded strongly, targeting upper liquidity.
This confirms that rotation → expansion was liquidity-driven, not emotional buying.
Key Trading Scenarios
🟢 Buy Reaction at Discount (Already Played)
The 4610–4608 demand zone acted as a protected discount area.
Strong rejection here confirmed Smart Money defense and initiated upside expansion.
🔴 Sell Reaction at Premium (Next Focus)
If price revisits 4742–4744, this premium zone aligns with:
• Prior expansion highs
• Buy-side liquidity resting above range
• Potential distribution area
Weak acceGold is currently trading in a post-impulse, post-breakout environment.
After the earlier expansion and BOS, price did not continue trending cleanly.
Instead, it transitioned into sideways consolidation, signaling Smart Money rebalancing rather than continuation.
This is not indecision — this is liquidity management.
Market Structure & Liquidity Context
• Higher-timeframe structure shows a breakout followed by hesitation, a classic sign of distribution and absorption.
• Price spent time ranging, engineering liquidity on both sides before expansion.
• A clear CHoCH formed after the sell-off, confirming the shift from expansion into controlled rotation.
• The 4610–4608 zone aligns with prior structure and demand, where Smart Money defended price aggressively.
• From this discount reaction, price expanded strongly, targeting upper liquidity.
This confirms that rotation → expansion was liquidity-driven, not emotional buying.
Key Trading Scenarios
🟢 Buy Reaction at Discount (Already Played)
The 4610–4608 demand zone acted as a protected discount area.
Strong rejection here confirmed Smart Money defense and initiated upside expansion.
🔴 Sell Reaction at Premium (Next Focus)
If price revisits 4742–4744, this premium zone aligns with:
• Prior expansion highs
• Buy-side liquidity resting above range
• Potential distribution area
Weak acceptance or rejection here would signal that buy-side liquidity has been delivered, opening room for rotation or consolidation.
Expectation & Bias
This is not a chase market.
• Expansion only follows liquidity delivery
• Continuation requires acceptance above premium
• Failure to accept favors rotation back toward equilibrium
Until then:
Liquidity > Indicators
Reaction > Prediction
Structure > Emotion
Let price confirm intent — Smart Money always shows its hand first.
💬 Do you expect acceptance above premium, or another rotation back to discount?ptance or rejection here would signal that buy-side liquidity has been delivered, opening room for rotation or consolidation.
Expectation & Bias
This is not a chase market.
• Expansion only follows liquidity delivery
• Continuation requires acceptance above premium
• Failure to accept favors rotation back toward equilibrium
Until then:
Liquidity > Indicators
Reaction > Prediction
Structure > Emotion
Let price confirm intent — Smart Money always shows its hand first.
💬 Do you expect acceptance above premium, or another rotation back to discount?

“Liquidity Grab → Pivot Support Holds → Next Bullish Leg Loading🔍 Market Structure & Key Observations
Overall market structure remains bullish with clear higher highs & higher lows ✔️
Price is respecting the upward trendline, confirming ongoing bullish momentum 📈
The recent sharp drop was a liquidity sweep into the Pivot Point / Demand zone, followed by a strong bullish reaction → Smart Money accumulation 💼💰
Multiple POI (Point of Interest) reactions below show buyers are active on dips
Current consolidation above the Pivot Point zone suggests preparation for the next impulsive move up, not distribution
🎯 Suitable Target Zones (High Probability)
🎯 Primary Target (TP1)
➤ 4,615 – 4,625 🎯
Prior resistance / range high
Liquidity resting above recent consolidation highs
Most realistic short-term objective
🚀 Extended Target (TP2)
➤ 4,650 – 4,670 🚀💸
Measured move from the last bullish impulse
Upper expansion of the ascending structure
Valid if bullish momentum accelerates
📌 Optional BUY Trade Idea (Trend-Following)
🟢 Buy Zone (on pullback):
➤ 4,560 – 4,580
(confluence of Pivot Point + trendline support)
❌ Stop-Loss (invalidation):
➤ Below 4,540
🎯 Take Profit:
TP1: 4,620 🎯
TP2: 4,660 🚀
📊 Risk–Reward: approx. 1:2.5 – 1:3+
🧭 Market Outlook Summary
Factor Bias
Trend Bullish 📈
Momentum Buyers in control 💪
Structure Continuation pattern ✅
Liquidity Upside targets active 💧

Gold Trapped in Liquidity Range – Expansion PendingGold is currently trading in a post-impulse environment after completing a clear Elliott Wave advance. With the higher-timeframe impulse exhausted, price action has transitioned into a controlled consolidation driven by liquidity, rather than trend continuation.
At this stage, the market is not trending — it is preparing.
Market Structure & Liquidity Context
Price is now boxed between a well-defined Equal High and Equal Low, forming a classic liquidity range. This structure suggests that Smart Money is engineering both sides of liquidity before committing to the next directional move.
The upper range aligns with premium pricing, where buy-side liquidity is resting.
The lower range sits in discount territory, overlapping with higher-timeframe demand.
This environment favors rotation and stop-hunt behavior, not impulsive expansion.
Key Trading Scenarios
🔴 Sell reaction at the highs
If price pushes above the Equal High and taps into the 4688–4690 premium zone , this area is expected to attract sell-side interest. A clear rejection or hesitation here would signal that buy-side liquidity has been taken, opening the door for a rotation back into the range.
🟢 Buy reaction at the lows
If price drops and reaches the 4388–4390 discount zone , this level becomes a key area to watch for support. Strong rejection or stabilization would suggest Smart Money defense, favoring a bounce back toward equilibrium.
Expectation & Bias
This is a rotation market, not a trend market.
Directional continuation should only be expected after a clear break and acceptance outside the range.
Until then:
Patience > prediction
Liquidity > indicators
Reaction > anticipation
Let price show its hand.
💬 Do you expect expansion to come from the highs or the lows first?
Your perspective matters — share your view.

Gold weekly rotation between 4682 supply and 4420 demand🟡 XAUUSD – Weekly Smart Money Plan | by Ryan_TitanTrader (17/01)
📈 Market Context
Gold remains structurally bullish on the higher timeframe, but weekly price action has clearly transitioned into a controlled Smart Money rotation. After delivering buy-side liquidity into premium, continuation has stalled.
This week’s hot drivers — USD volatility, U.S. yield repricing, and renewed Fed rate-cut expectations amid sticky inflation data and geopolitical hedging flows — are creating ideal conditions for inducement and liquidity engineering rather than clean trend expansion.
With risk sentiment fragile and positioning crowded, Gold is behaving typically at extremes: sweeps, fake breaks, and mean reversion, not impulsive continuation.
🔎 Technical Framework – Smart Money Structure (H4–H1)
Current Phase:
HTF bullish bias remains valid, but internal structure shows distribution from premium after liquidity delivery.
Key Idea:
Sell reactions from premium supply, or wait patiently for a deeper pullback into HTF demand to reload longs.
Structural Notes:
• HTF BOS confirms bullish dominance
• Buy-side liquidity already taken above highs
• Clear rotation channel forming
• Liquidity shortage zone acting as magnet
• Discount demand aligns with prior OB + channel support
💧 Liquidity Zones & Key Levels
• 🔴 SELL GOLD 4680 – 4682 | SL 4690
• 🟢 OB BUY GOLD 4420 – 4418 | SL 4410
🧠 Institutional Flow Expectation
Liquidity sweep → MSS / CHoCH → BOS → displacement → OB / FVG retest → expansion or deeper rotation
🎯 Execution Rules
🔴 SELL GOLD 4680 – 4682 | SL 4690
Rules:
✔ Price taps premium channel supply
✔ Buy-side liquidity taken above recent highs
✔ Bearish MSS / CHoCH on H1–M15
✔ Downside BOS confirms distribution
✔ Entry via bearish FVG or supply OB
Targets:
• 4620 — internal reaction
• 4560 — liquidity shortage
• 4480 — deeper weekly rotation
• Trail aggressively (distribution play)
🟢 OB BUY GOLD 4420 – 4418 | SL 4410
Rules:
✔ Sweep into weekly discount zone
✔ Strong confluence: HTF OB + channel support
✔ Bullish MSS / CHoCH on M15–H1
✔ Impulsive BOS with displacement
✔ Entry via refined bullish OB
Targets:
• 4560 — first reaction
• 4620 — mid-range liquidity
• 4680+ — continuation if expansion resumes
⚠️ Risk Notes
• Premium zones = liquidity traps
• Expect false breaks during macro headlines
• No entry without MSS + BOS
• Reduce risk near HTF extremes
📍 Summary
Gold is bullish by structure, but this week is about precision execution, not prediction:
• Premium may deliver a Smart Money sell from 4680–4682, or
• Discount at 4420–4418 may reload longs for the next impulsive leg.
Let liquidity move first.
Let structure confirm second.
Smart Money controls — patience pays. ⚡️
📌 Follow @Ryan_TitanTrader for weekly Smart Money gold breakdowns.

Gold fluctuates between 4672 resistance and 4560 support.🟡 XAUUSD – Intraday Smart Money Plan | by Ryan_TitanTrader (16/01)
📈 Market Context
Gold remains structurally bullish on the higher timeframe, but intraday price action has shifted into controlled rotation. With today’s hot drivers — USD volatility, U.S. yield fluctuations, and ongoing Fed rate-cut speculation — Smart Money is no longer pushing continuation. Instead, liquidity is being engineered around premium and discount zones.
Ahead of U.S. macro headlines and inflation-linked expectations, Gold is behaving typically at extremes: inducement, stop-hunts, and mean reversion rather than impulsive trend extension.
🔎 Technical Framework – Smart Money Structure (H1–M15)
Current Phase:
HTF bullish bias intact, while intraday structure shows corrective rotation after buy-side liquidity was taken.
Key Idea:
Look for distribution from premium supply or a deeper pullback into discount demand for buying/entry reloads.
Structural Notes:
• HTF BOS confirms bullish dominance
• Buy-side liquidity already delivered
• Price rotating, not expanding impulsively
• Internal FVG acting as downside magnet
• Discount demand aligns with prior OB support
💧 Liquidity Zones & Triggers
• 🔴 SELL GOLD 4670 – 4672 | SL 4680
• 🟢 BUY GOLD 4561 – 4559 | SL 4551
🧠 Institutional Flow Expectation
Liquidity sweep → MSS / CHoCH → BOS → displacement → OB/FVG retest → expansion
🎯 Execution Rules
🔴 SELL GOLD 4670 – 4672 | SL 4680
Rules:
✔ Price taps premium supply
✔ Buy-side liquidity taken above highs
✔ Bearish MSS / CHoCH on M5–M15
✔ Clear downside BOS
✔ Entry via bearish FVG or supply OB
Targets:
• 4620 — internal reaction
• 4585 — liquidity pool
• Trail aggressively (distribution play)
🟢 BUY GOLD 4561 – 4559 | SL 4551
Rules:
✔ Sweep into discount demand
✔ Confluence with OB + FVG
✔ Bullish MSS / CHoCH on M5–M15
✔ Strong upside BOS with displacement
✔ Entry via refined bullish OB
Targets:
• 4620 — first reaction
• 4670 — internal liquidity
• 4700+ — continuation if expansion resumes
⚠️ Risk Notes
• Premium zones = liquidity traps
• Expect fake breaks during news volatility
• No entry without MSS + BOS
• Reduce size near extremes
📍 Summary
Gold is bullish by structure, but today is about execution, not prediction:
• Premium may deliver a Smart Money sell from 4670–4672, or
• Discount at 4561–4559 may reload buying/entry for the next leg higher.
Let liquidity move first.
Let structure confirm second.
Smart Money controls — patience pays. ⚡️
📌 Follow @Ryan_TitanTrader for daily Smart Money gold breakdowns.

Technical Analysis on goldGold has recently experienced a strong upside move, primarily driven by heightened geopolitical tensions, which fueled safe-haven demand. This aggressive move resulted in a gap-up opening, leaving an unfilled gap around the 4508 level, which remains an important technical magnet.
From a technical perspective, price is currently trading within an ascending structure but is showing signs of compression near the upper boundary, suggesting potential exhaustion. A short-term triangle / consolidation structure is forming, indicating that a decisive move may be imminent.
The key level to watch is 4565.
A sustained break and acceptance below 4565 would confirm a shift in momentum and strengthen the bearish case.
If the rising trendline is broken, it would signal bearish continuation, with increased downside momentum likely to follow. In such a scenario, price could retrace further to fill the unfilled gap near 4508, which aligns with prior demand and liquidity.
From a fundamental standpoint, while gold initially rallied on geopolitical stress, recent developments suggest some easing in risk sentiment. Reduced escalation and a softer geopolitical tone have slightly cooled safe-haven flows, supporting a short-term bearish bias unless new risk catalysts emerge.
That said, the bullish scenario remains valid if geopolitical tensions escalate again. In such a case, renewed safe-haven demand could push gold higher, with a potential breakout above the previous ATH and extension toward the 4670 zone.
Summary
Bullish above trendline & resistance break → potential ATH continuation toward 4670
Bearish below 4565 & trendline break → downside continuation toward 4508 gap fill
Market currently at a decision point, awaiting confirmation
⚠️ As always, wait for confirmation and manage risk accordingly.

XAUUSD (Gold) | Technical Outlook | 15th Jan'2026XAU/USD – Gold Technical Analysis
Price: 4,604 | Intraday: -0.47%
Gold is trading near 4,600 after a minor pullback. While short-term momentum shows selling pressure on lower timeframes, the overall trend remains strongly bullish on Daily, Weekly, and Monthly charts. Price continues to hold well above key moving averages (20, 50, 100, 200), keeping the broader uptrend intact.
Key Levels
Resistance: 4,616 → 4,632 → 4,648
Support: 4,598 → 4,586 → 4,551
Pivot: 4,599
Bullish Scenario
Above 4,600, buyers may push Gold toward 4,616–4,632. A strong breakout can extend gains toward 4,648.
Bearish Scenario
Below 4,586, selling pressure may increase, dragging price toward 4,566–4,551 (intraday correction).
Intraday Trading Strategy
Buy on dips: 4,590–4,600 | SL: below 4,566 | Targets: 4,616 / 4,632
Sell below: 4,586 (confirmation) | SL: 4,616 | Targets: 4,566 / 4,551
Bias: Bullish trend with short-term volatility.

GOLD (XAU/USD) – Bullish Continuation After Breakout🔍 Market Structure & Key Observations
Price is respecting a clean upward trendline, confirming a strong bullish structure 📈
Multiple POI (Point of Interest) reactions show consistent buying interest → Smart Money accumulation 💼
Clear Breakouts + BOS (Break of Structure) validate trend continuation ✔️
The former resistance at the High Pivot Point has flipped into strong support 🟢
Current consolidation above support suggests bullish continuation, not distribution
🎯 Suitable Target Zones (High Probability)
🎯 Primary Target (TP1)
➤ 4,640 – 4,655 🎯
Aligns with the upper channel resistance
Matches measured move from the recent impulse
High-probability target while price holds above support
🚀 Extended Target (TP2)
➤ 4,680 – 4,700 🚀💰
Channel expansion target
Liquidity resting above recent highs
Valid if bullish momentum accelerates
📌 Bullish Trade Idea (Optional Setup)
🟢 Buy on Pullback Zone:
➤ 4,590 – 4,605
(confluence of support level + trendline)
❌ Invalidation / Stop-Loss:
➤ Below 4,565
🎯 Take Profit Levels:
TP1: 4,650 🎯
TP2: 4,690 🚀
📊 Risk–Reward Ratio: ~ 1:2.5 to 1:3+
🧭 Overall Market Outlook
Factor Bias
Trend Strong Bullish 📈
Momentum Buyers in control 💪
Structure Higher Highs & Higher Lows ✅
Liquidity Target Above recent highs 💧

GOLD (XAUUSD) – 4H Technical Analysis GOLD (XAUUSD) – 4H
Price broke previous trendline and now pulling back inside rising channel.
Current zone: 4590 area.
Levels
Resistance: 4630–4650
Support: 4578 / 4550
Bias
Above 4578 = bullish structure intact.
Plan
Buy on dips: 4578–4600
Targets: 4635 → 4700
SL: Below 4550
Below 4550 → trend weak, expect 4500 zone.

Gold oscillates between 4690 supply and 4576 demand.🟡 XAUUSD – Intraday Smart Money Plan | by Ryan_TitanTrader (14/01)
📈 Market Context
Gold remains structurally bullish after printing fresh ATH territory, but price action has clearly slowed into rotation. With markets reacting to today’s hot drivers — U.S. inflation expectations, USD volatility, and shifting Treasury yields — Smart Money is no longer chasing upside. Instead, liquidity is being engineered around premium and discount zones.
Ahead of key U.S. data and rate-cut speculation, Gold is behaving exactly as expected at extremes: stop hunts, inducement, and controlled rebalancing rather than clean continuation.
🔎 Technical Framework – Smart Money Structure (H1–M15)
Current Phase:
HTF bullish bias intact, while intraday structure shows corrective rotation after buy-side liquidity was delivered near ATH.
Key Idea:
Expect distribution from premium supply near ATH, or a deeper pullback into discount demand to reload longs.
Structural Notes:
• HTF BOS confirms bullish dominance
• ATH zone has delivered buy-side liquidity
• Price rotating, not expanding impulsively
• Internal FVG acting as downside magnet
• Discount demand aligns with HTF EMA support
💧 Liquidity Zones & Triggers
• 🔴 SELL GOLD 4688 – 4690 | SL 4700
• 🟢 BUY GOLD 4578 – 4576 | SL 4568
🧠 Institutional Flow Expectation
Liquidity sweep → MSS / CHoCH → BOS → displacement → OB/FVG retest → expansion
🎯 Execution Rules
🔴 SELL GOLD 4688 – 4690 | SL 4700
Rules:
✔ Price taps premium ATH supply
✔ Buy-side liquidity taken above highs
✔ Bearish MSS / CHoCH on M5–M15
✔ Clear downside BOS
✔ Entry via bearish FVG or supply OB
Targets:
• 4635 — internal reaction
• 4600 — liquidity pool
• Trail aggressively (distribution play)
🟢 BUY GOLD 4578 – 4576 | SL 4568
Rules:
✔ Sweep into discount demand
✔ Confluence with OB + FVG
✔ Bullish MSS / CHoCH on M5–M15
✔ Strong upside BOS with displacement
✔ Entry via refined bullish OB
Targets:
• 4620 — first reaction
• 4680 — internal liquidity
• 4720+ — ATH extension if expansion resumes
⚠️ Risk Notes
• ATH zones are liquidity traps
• Expect false breaks during news volatility
• No entry without MSS + BOS
• Reduce size near ATH — range expansion risk
📍 Summary
Gold is bullish by structure, but today is about execution, not prediction:
• Premium may deliver a Smart Money sell from 4688–4690, or
• Discount at 4578–4576 may reload longs for the next ATH push.
Let liquidity move first.
Let structure confirm second.
Smart Money controls — patience pays. ⚡️
📌 Follow @Ryan_TitanTrader for daily Smart Money gold breakdowns.

“Bullish Momentum Accelerates → Trendline Support Holding for ?🟡 GOLD (XAU/USD) – Strong Bullish Continuation After Breakout 🚀📈
🔍 Market Structure & Key Observations
Price is respecting a clean upward trendline, confirming a strong bullish structure 📈
Multiple POI (Point of Interest) reactions show consistent buyer absorption → Smart Money accumulation 💼
A clear Breakout + BOS (Break of Structure) has occurred above the previous range ✔️
Price is now holding above the High Pivot Point, which has flipped into support 🟢
Current consolidation above support signals bullish momentum continuation, not exhaustion
🎯 Suitable Target Zones (High Probability)
🎯 Primary Target (TP1)
➤ 4,620 – 4,635 🎯
Aligned with projected bullish leg
Matches upper continuation structure
High probability if price holds above support
🚀 Extended Target (TP2)
➤ 4,660 – 4,680 🚀💰
Channel expansion target
Liquidity resting above recent highs
Valid if momentum accelerates
📌 Bullish Trade Scenario (Optional Setup)
🟢 Buy on Pullback Zone:
➤ 4,565 – 4,585 (trendline + support confluence)
🎯 Take Profit Levels:
TP1: 4,630 🎯
TP2: 4,675 🚀
📊 Risk–Reward: ~1:2.5 to 1:3+
🧭 Market Outlook
Factor Bias
Trend Strong Bullish 📈
Momentum Buyers in control 💪
Structure Higher highs & higher lows ✅
Liquidity Target Above highs 💧

Gold reaches new ATH — Smart Money rotates.🟡 XAUUSD – Intraday Smart Money Plan | by Ryan_TitanTrader (13/01)
📈 Market Context
Gold has officially printed a new All-Time High (ATH), confirming higher-timeframe bullish dominance. However, after delivering buy-side liquidity into premium, price action is no longer impulsive. Instead, Smart Money is transitioning into controlled distribution and rotation, engineering liquidity rather than chasing continuation.
With price stretched deep into premium and resting above prior structure, today’s environment favors liquidity sweeps, inducement, and mean reversion, not blind breakout trading. Execution must be precise, level-based, and confirmation-driven.
🔎 Technical Framework – Smart Money Structure (H1–M15)
Current Phase:
HTF bullish structure intact, but intraday corrective rotation active from premium after ATH print.
Key Idea:
Expect Smart Money to distribute near ATH supply (4630–4632), or rebalance deeply into discount (4492–4490) before the next expansion leg.
Structural Notes:
• Clear HTF BOS confirms bullish dominance
• New ATH delivered buy-side liquidity
• Price reacting from premium with corrective characteristics
• Internal FVG + liquidity pocket acting as magnet below
• Discount OB zone aligns with higher-timeframe demand
💧 Liquidity Zones & Triggers
• 🔴 SELL GOLD 4630 – 4632 | SL 4640
• 🟢 BUY GOLD 4492 – 4490 | SL 4482
🧠 Institutional Flow Expectation
Liquidity sweep → MSS / CHoCH → BOS → displacement → OB/FVG retest → expansion
🎯 Execution Rules
🔴 SELL GOLD 4630 – 4632 | SL 4640
Rules:
✔ Price taps ATH premium supply
✔ Buy-side liquidity taken above highs
✔ Bearish MSS / CHoCH on M5–M15
✔ Clear downside BOS confirming distribution
✔ Entry via bearish FVG refill or supply OB
Targets:
• 4588 — internal reaction
• 4560 — FVG mitigation
• Trail aggressively (intraday distribution play)
🟢 BUY GOLD 4492 – 4490 | SL 4482
Rules:
✔ Liquidity sweep into discount demand
✔ Confluence with OB + FVG + strong liquidity pool
✔ Bullish MSS / CHoCH on M5–M15
✔ Strong upside BOS with displacement
✔ Entry via refined bullish OB or FVG mitigation
Targets:
• 4520 — first reaction
• 4580 — internal liquidity
• 4630+ — ATH retest if expansion resumes
⚠️ Risk Notes
• New ATH zones are liquidity traps by nature
• Expect false breakouts and aggressive stop hunts
• No trades without MSS + BOS confirmation
• Size down near ATH — volatility can expand rapidly
📍 Summary
Gold is bullish by structure, but today is about rotation, not continuation:
• A reaction at 4630–4632 may deliver a Smart Money sell back into liquidity, or
• A sweep into 4492–4490 may reload longs for the next ATH extension.
Let liquidity move first.
Let structure confirm second.
Smart Money engineers — patience profits. ⚡️
📌 Follow Ryan_TitanTrader for daily Smart Money gold breakdowns.

How does today’s gold top compare to the 1980 and 2011 peaks?Gold is not just at a nominal high — it is trading at the highest real (inflation-adjusted) price in modern history.
How does today’s gold top compare to the 1980 and 2011 peaks?
1️⃣ GOLD MAJOR TOPS — NOMINAL vs REAL (TODAY’S MONEY)
🔴 1980 GOLD TOP (true panic peak)
Nominal price (1980): ~$850/oz
Inflation-adjusted to today: ~$3,200–3,400/oz
What the world looked like:
Double-digit inflation
Oil crisis
Cold War escalation
Dollar confidence collapse
Real rates deeply negative
Monetary panic
Meaning: This was a once-in-a-generation monetary crisis peak.
🟠 2011 GOLD TOP (QE / crisis fear)
Nominal price (2011) : ~$1,920/oz
Inflation-adjusted to today : ~$2,600–2,700/oz
What the world looked like:
Global Financial Crisis aftermath
QE everywhere
Eurozone debt crisis
Fear of currency debasement
Inflation still relatively controlled
Meaning: This was a financial-system fear peak, not a currency collapse.
🟡 TODAY (2025–26) GOLD ~ $4,584
Nominal price : ~$4,584/oz (new high)
Inflation-adjusted: $4,584 (today’s dollars by definition)
Compared to past real peaks:
~35–45% above the 1980 real peak (~$3,300 mid-range)
~70–75% above the 2011 real peak (~$2,650 mid-range)
This is extremely important : today’s gold price is already the highest real gold price in modern history.
2️⃣ TABLE SUMMARY
| Gold Peak | Nominal Then | Real Value Today |
| 1980 panic | ~$850 | ~$3,200–3,400 |
| 2011 QE | ~$1,920 | ~$2,600–2,700 |
| Today | ~$4,584 | $4,584 |
3️⃣ WHAT MAKES TODAY DIFFERENT FROM 1980 & 2011
Today:
Inflation already happened
Debt far higher than 1980 or 2011
Central banks trapped
Geopolitical fragmentation
De-dollarization pressure
Central banks buying gold aggressively
Takeaway: Today’s price reflects structural distrust , not just panic.
4️⃣ WHAT A REAL GOLD TOP USUALLY MEANS NEXT
Historically, after gold peaks in real terms:
Nominal price may still go higher briefly
Then:
Long consolidation
Sharp correction
Or years of underperformance vs inflation
Gold doesn’t crash like silver — it bleeds purchasing power over time . That’s how tops resolve.
Disclaimer:
This post is for educational and informational purposes only and does not constitute financial, investment, or trading advice. Readers should conduct their own research or consult a professional before making any financial decisions.

Gold (XAUUSD) — Bullish Trend Test Near Support Before BreakoutWhat are your thoughts on GOLD?
Gold recently break resistance of range-bound consolidation phase successfully.
After breakout of resistance it is now forming pullback after the resistance.
Here our momentum is bullish
Recent events (e.g., U.S.–Venezuela crisis and broader political instability) have pushed investors into gold as a safe asset — lifting prices toward record highs. Gold traditionally rises when global risks increase because traders and institutions want to protect capital.
📌 Plan A — Bullish (Main Idea)
• Wait for pullback to trendline/support area — a good entry spot for a long (buy).
• Entry: near trendline/support check (price shows bounce pattern).
• Stop Loss: just below the trendline/support (risk control).
• Target: near the top resistance zone — move higher if breakout happens.
📌 Plan B — Breakout Buy
• If price breaks above the resistance zone with strength, enter on the breakout candle close.
• Stop Loss: just below breakout level.
• Targets: next resistance levels higher.

“Bullish Pullback → Trendline Support Holding for Next Rally🔍 Key Technical Analysis
Price previously formed a strong bearish breakout, followed by a price rebound from a high pivot demand zone (POI) 🔄
Market has established a clear upward channel, confirming a medium-term bullish structure 📈
Break of Structure (BOS) to the upside signals a shift from bearish to bullish momentum ✅
Price is currently pulling back toward the upward trendline & horizontal support, indicating a healthy retracement, not a reversal 🟦
Bullish momentum remains valid as long as price holds above the support zone around 4,440 – 4,450 💪
Liquidity is resting above recent highs near the resistance trendline 🎯
🎯 Potential Price Targets (with stickers)
Target Type Price Area Sticker
TP1 → Recent High Retest 4,490 – 4,500 🎯
TP2 → Trendline Resistance 4,520 – 4,540 🚀💰
📌 TP1 = Conservative & high-probability target
📌 TP2 = Extended bullish move if momentum accelerates
📌 Trade Setup Idea
🟢 Buy Zone:
➤ 4,440 – 4,455 (trendline + support confluence)
🎯 Take Profit:
➤ TP1: 4,500 🎯
➤ TP2: 4,535 🚀
🧭 Overall Market Bias
Factor Bias
Market Structure Bullish 📈
Trend Upward Channel Holding ✅
Momentum Buyers in control 💹
Liquidity Target Above highs 💧

Gold pauses; rotation, not continuation.🟡 XAUUSD – Intraday Smart Money Plan | by Ryan_TitanTrader (07/01)
📈 Market Context
Gold remains structurally bullish on higher timeframes, following a strong impulsive expansion that delivered price deep into premium. However, recent price action signals a transition from expansion into distribution, with Smart Money beginning to engineer corrective rotations rather than chasing continuation.
As the market digests USD flows, U.S. yield sensitivity, and positioning ahead of upcoming U.S. data, Gold is currently rotating between internal liquidity zones. This environment typically favors liquidity sweeps, inducement, and mean reversion, rather than clean directional breakouts.
Today’s session is best approached with level-based execution, patience, and confirmation — not prediction.
🔎 Technical Framework – Smart Money Structure (1H)
Current Phase:
HTF bullish structure with an active intraday corrective leg from premium.
Key Idea:
Expect Smart Money to react at internal supply (4428–4430) for short-term distribution, or at discount demand (4412–4410) for re-accumulation before the next leg.
Structural Notes:
• HTF bullish structure remains intact
• Clear BOS printed during the upside expansion
• Price rejected from premium and is rotating lower
• Internal supply at 4428–4430 acts as sell-sensitive zone
• Demand at 4412–4410 aligns with OB + EMA support + liquidity pocket
💧 Liquidity Zones & Triggers
• 🟢 BUY GOLD 4412 – 4410 | SL 4402
• 🔴 SELL SCALP 4428 – 4430 | SL 4438
🧠 Institutional Flow Expectation
Liquidity sweep → MSS / CHoCH → BOS → displacement → OB/FVG retest → expansion
🎯 Execution Rules
🟢 BUY GOLD 4412 – 4410 | SL 4402
Rules:
✔ Liquidity sweep into discount demand
✔ Bullish MSS / CHoCH on M5–M15
✔ Strong upside BOS with displacement
✔ Entry via refined bullish OB or FVG mitigation
Targets:
• 4425 — initial reaction
• 4435 — internal liquidity
• 4480–4500 — premium retest if momentum expands
🔴 SELL SCALP 4428 – 4430 | SL 4438
Rules:
✔ Price taps internal supply / EMA resistance
✔ Bearish MSS / CHoCH on lower timeframe
✔ Clear downside BOS confirming distribution
✔ Entry via bearish FVG refill or supply OB
Targets:
• 4418 — first imbalance
• 4410 — demand interaction
• Trail aggressively (scalp setup)
⚠️ Risk Notes
• Premium zones favor stop hunts and fake continuations
• Volatility may expand during U.S. session
• No entries without MSS + BOS confirmation
• Scalp sells require strict risk control
📍 Summary
Gold remains structurally bullish, but today’s edge lies in Smart Money’s intraday rotation:
• A sweep into 4412–4410 may reload longs toward premium, or
• A reaction at 4428–4430 offers a controlled scalp sell back into demand.
Let liquidity move first.
Let structure confirm second.
Smart Money engineers — patience profits. ⚡️
📌 Follow Ryan_TitanTrader for daily Smart Money gold breakdowns.

XAUUSD Smart Money Levels: Demand 4325, Supply 4494🟡 XAUUSD – Intraday Smart Money Plan | by Ryan_TitanTrader (05/01)
📈 Market Context
Gold remains structurally bullish on higher timeframes, but current price action reflects a premium-side liquidity operation rather than clean continuation. After a strong upside leg, price is now rotating inside premium where Smart Money typically distributes positions before initiating corrective delivery.
Today’s focus revolves around USD strength, U.S. yield sensitivity, and ongoing Fed rate path speculation, with traders positioning ahead of upcoming U.S. macro releases and Fed commentary. As real yields fluctuate and risk sentiment remains fragile, Gold continues to attract safe-haven flows — but not without engineered pullbacks.
This environment favors liquidity sweeps, false continuation, and inducement above highs, rather than impulsive breakout buying.
🔎 Technical Framework – Smart Money Structure (1H)
Current Phase:
Higher-timeframe bullish structure with an active short-term corrective leg from premium.
Key Idea:
Expect Smart Money interaction either at internal supply (4492–4494) for distribution, or HTF demand (4327–4325) for re-accumulation before the next expansion.
Structural Notes:
• HTF bullish structure remains valid
• Recent CHoCH confirms corrective rotation
• Buy-side liquidity above highs has been partially tapped
• Supply cluster at 4492–4494 acts as distribution zone
• Demand zone at 4327–4325 aligns with OB + liquidity pool
💧 Liquidity Zones & Triggers
• 🟢 BUY GOLD 4327 – 4325 | SL 4317
• 🔴 SELL GOLD 4492 – 4494 | SL 4500
🧠 Institutional Flow Expectation
Liquidity sweep → MSS / CHoCH → BOS → displacement → OB/FVG retest → expansion
🎯 Execution Rules
🟢 BUY GOLD 4327 – 4325 | SL 4317
Rules:
✔ Liquidity sweep into HTF demand
✔ Bullish MSS / CHoCH confirmation on M5–M30
✔ Strong upside BOS with impulsive candles
✔ Entry via refined bullish OB or FVG mitigation
Targets:
• 4390 — initial displacement
• 4450 — internal liquidity
• 4490+ — premium retest if USD weakens
🔴 SELL GOLD 4492 – 4494 | SL 4500
Rules:
✔ Reaction into premium supply zone
✔ Bearish MSS / CHoCH on lower timeframe
✔ Clear downside BOS confirming distribution
✔ Entry via bearish FVG refill or supply OB
Targets:
• 4455 — first imbalance fill
• 4395 — internal discount
• 4327 — HTF demand sweep
⚠️ Risk Notes
• Premium zones favor fake breakouts and stop hunts
• Volatility may spike around U.S. data and Fed remarks
• No entries without MSS + BOS confirmation
• Stops often triggered before real displacement
📍 Summary
Gold remains structurally bullish, but today’s edge lies in trading Smart Money’s range:
• A sweep into 4327–4325 may reload longs toward 4450–4490, or
• A reaction at 4492–4494 offers a sell opportunity back into discount.
Let liquidity move first.
Let structure confirm second.
Smart Money engineers — patience profits. ⚡️
📌 Follow Ryan_TitanTrader for daily Smart Money gold breakdowns.

XAUUSD Smart Money Levels: Demand 4312, Supply 4436XAUUSD – Intraday Smart Money Plan | by Ryan_TitanTrader (05/01)
Market Context
Gold remains structurally bullish on higher timeframes, yet short-term price action shows pullback pressure after premium liquidity was elected near 4440. As markets brace for ongoing USD direction from macro catalysts (Fed commentary, U.S. jobs data, Treasury yields), institutional participation is oscillating between liquidity hunts and controlled re-accumulation.
Global risk sentiment and safe-haven bids are intensifying as traders weigh inflation trajectory with central bank pivot expectations — leading Gold to exhibit rotational distribution behavior rather than clean continuation. Controlled swings and sweep-driven moves dominate price progression.
This environment favors engineered liquidity access and inducement, not blind breakout chasing.
Technical Framework – Smart Money Structure (1H)
Current Phase:
Higher-timeframe bullish bias with short-term corrective displacement.
Key Idea:
Expect structural engagement near HTF demand (~4312–4314) or internal supply liquidity (~4434–4436) before meaningful displacement sequences.
Structural Notes:
• HTF bullish structure remains intact
• Recent CHoCH confirms corrective leg
• Buy-side liquidity above recent highs is targeted
• Supply cluster near 4436 acts as engineered lure
• Demand confluence aligns with institutional accumulation
Liquidity Zones & Triggers
• BUY GOLD 4314 – 4312 | SL 4304
• SELL GOLD 4434 – 4436 | SL 4444
Institutional Flow Expectation
Liquidity sweep → MSS / CHoCH → BOS → displacement → internal supply retest → expansion
Execution Rules
BUY GOLD 4314 – 4312 | SL 4304
Rules:
✔ Liquidity sweep into HTF demand
✔ Bullish MSS / CHoCH confirmation on M5–M30
✔ Clear upside BOS with impulse candles
✔ Entry via refined demand OB or FVG fill
Targets:
• 4370 — initial displacement
• 4410 — internal supply test
• 4440+ — extended run if USD weakens
SELL GOLD 4434 – 4436 | SL 4444
Rules:
✔ Reaction into internal supply cluster
✔ Bearish MSS / CHoCH confluence
✔ Downside BOS with momentum shift
✔ Entry via bearish FVG refill or supply OB
Targets:
• 4390 — first discount zone
• 4350 — deeper pullback
• 4314 — HTF demand scan
Risk Notes
• False breaks favored near thin Asian session volume
• Macro catalysts (U.S. data, Fed speakers) may spike volatility
• Avoid entries without MSS + BOS confirmations
• Stops triggered by engineered liquidity hunts
Summary
Gold remains structurally bullish, but today’s edge lies in disciplined entries and liquidity awareness:
• A sweep into 4312–4314 may reload longs with targets up to 4410–4440, or
• A reaction near 4434–4436 provides a fade opportunity back into discount.
Let liquidity initiate the move. Let structure confirm.
Smart Money sets traps — retail chases them.
Follow Ryan_TitanTrader for daily Smart Money gold breakdowns.
