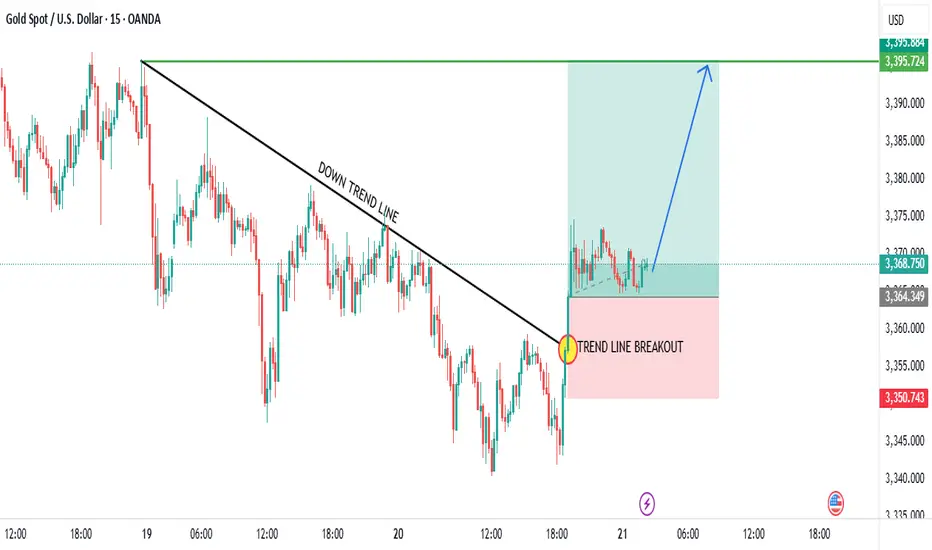
Analysis of Gold Spot / U.S. Dollar (XAU/USD) 15-Minute Chart
Historical Trend: The chart displays the Gold Spot / U.S. Dollar (XAU/USD) price movement on a 15-minute timeframe from June 19 to June 22, 2025. The price was in a clear downtrend, defined by a descending trendline, until a recent shift.
Key Levels:
Resistance: The $3,395.724 level (green line) has emerged as a significant resistance following the breakout. A break above this could confirm further upside.
Support: The $3,350.743 level (red line) acted as a major support during the downtrend and was recently breached upward.
Recent Price Action: The price broke above the downtrend line (highlighted with a yellow circle and labeled "TREND LINE BREAKOUT" in red), indicating a potential reversal. This breakout occurred around 12:00 on June 21, followed by a sharp upward move into a consolidation zone (light green).
Projected Movement: The upward projection (blue arrow) suggests the price could target levels around $3,380.00-$3,400.00 if the breakout momentum continues. The consolidation above $3,350.743 supports the bullish outlook.
Volume and Indicators: The chart includes Bollinger Bands (O3,368.320 H3,369.500 L3,367.660 C3,368.750) with a -0.360 (-0.01%) change, indicating low volatility. The breakout suggests increasing buying interest, though specific volume data is not detailed.
Outlook: The trend line breakout signals a potential shift from bearish to bullish momentum. Maintaining above $3,350.743 is crucial for the uptrend to continue. A failure to hold this level could see the price retest the downtrend line or lower supports. Monitor for confirmation of sustained momentum above resistance.
Goldprediction
Sell Area for Short Position on XAU/USD Based on Trading AnalysiBased on the trading analysis chart published by NaviPips on TradingView.com on June 20, 2025, at 23:09 UTC+5:30, here’s a recommendation for a sell area to take a short position on XAU/USD (Gold Spot / U.S. Dollar) as of 11:17 PM IST on June 20, 2025. The chart provides a 4-hour timeframe with key support and resistance levels, aligned with recent price action and technical patterns.
Context and Technical Analysis
Current Price: The chart shows XAU/USD with an open of $3,371.525, a high of $3,371.790, a low of $3,368.065, and a close of $3,369.115, reflecting a slight decline of -0.07% for the period. This suggests a consolidation phase near the current level of approximately $3,369–$3,371.
Resistance Zone: A significant resistance zone is identified between $3,425.000 and $3,457.047, marked by a red shaded area where price has previously faced rejection. This aligns with a potential triple top formation, indicating strong selling pressure at these levels.
Support Zones: Multiple support levels are outlined:
Support 1: $3,250.000–$3,275.000, a key area where price may find initial buying interest.
Support 2: $3,150.000–$3,169.121, a deeper support zone if the decline accelerates.
Support 3: $3,100.000, a psychological and technical level for a potential bottom.
Trend and Pattern: The chart features a descending triangle pattern, with a downward-sloping trendline connecting recent highs (e.g., around $3,425) and a horizontal support near $3,250–$3,275. A break below this support could confirm a bearish move.
Volume and Momentum: The chart includes volume bars and a momentum indicator (not fully detailed), but the price rejection at higher levels suggests fading bullish momentum, supporting a short opportunity.
Sell Area for Short Position
The optimal sell area for a short position on XAU/USD is in the $3,425–$3,457 resistance zone. This recommendation is based on:
Resistance Confirmation: The red shaded area on the chart indicates a strong resistance where XAU/USD has repeatedly failed to break through, forming a triple top. A retest of this zone (e.g., after a bounce from current levels) offers a high-probability entry for a short.
Trendline Rejection: The descending trendline intersecting near $3,425 suggests that a rejection here would reinforce bearish momentum.
Current Price Context: With XAU/USD currently at $3,369–$3,371, a move back toward $3,425–$3,457 (potentially driven by short-term profit-taking or a weaker dollar pause) would align with the chart’s resistance setup.
Trading Strategy
Entry Zone: Sell XAU/USD on a 4-hour candle close below $3,425 or after a clear rejection (e.g., a bearish candlestick pattern) at $3,435–$3,457. This confirms resistance holding and initiates the downward move.
Target Levels:
Target 1: $3,250–$3,275 (first support zone, as marked on the chart).
Target 2: $3,150–$3,169 (secondary support for a deeper correction).
Target 3: $3,100 (final support if bearish momentum strengthens).
Stop Loss: Place above $3,460 (just above the resistance high) or $3,470 (tighter risk management) to protect against a breakout above the triangle.
Risk Management: Use a risk-reward ratio of at least 1:2. For example, risking 15–25 pips ($3,435–$3,460 stop loss) to target 50–75 pips ($3,250–$3,275). Adjust lot size based on your risk tolerance (e.g., 1% of account per trade).
Confirmation: Wait for a 4-hour candle close below $3,425 or a rejection signal (e.g., shooting star or bearish engulfing) at $3,435–$3,457 to avoid false breakouts. Monitor volume for increased selling pressure.
Rationale
Powell’s Speech Impact: Following Jerome Powell’s June 18, 2025, speech, where he projected only two 0.25% rate cuts for 2025 with a data-dependent stance, the U.S. dollar may remain supported, pressuring gold downward from resistance levels like $3,425–$3,457.
Technical Setup: The descending triangle and triple top at $3,425–$3,457 indicate a high likelihood of a reversal, with support targets at $3,250–$3,275 aligning with the chart’s levels.
Market Context: The slight decline to $3,369 and consolidation suggest a pause before a potential retest of resistance, offering a strategic short entry.
Risks and Considerations
Breakout Risk: A strong bullish candle above $3,457 could invalidate the short setup, potentially targeting higher levels. Tight stop losses are critical.
Geopolitical Factors: Ongoing Middle East tensions could drive safe-haven buying, pushing XAU/USD above resistance. Monitor news for sudden spikes.
Data Events: Upcoming U.S. economic data (e.g., retail sales) could influence dollar strength and gold prices, requiring real-time adjustments.
Conclusion
The recommended sell area for a short position on XAU/USD on June 20, 2025, is $3,425–$3,457, with a 4-hour candle close below $3,425 or rejection at $3,435–$3,457 as confirmation. Target $3,250–$3,275, $3,150–$3,169, and $3,100, with a stop loss above $3,460. This strategy leverages the chart’s resistance zone and Powell’s cautious rate cut outlook. Practice proper risk management due to gold’s volatility.
If you’d like a chart to visualize these levels further or additional analysis, let me know!

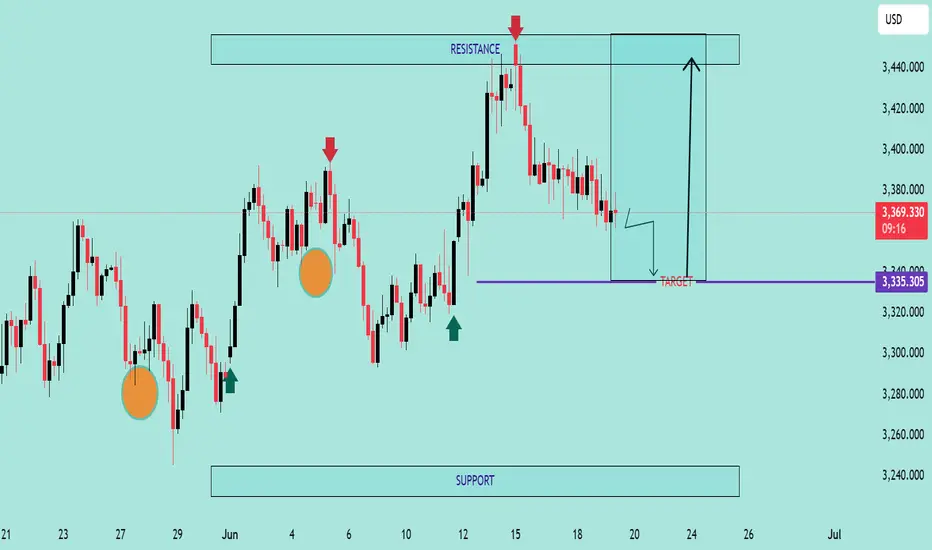
GOLD/USD Support Retest & Breakdown SetupGOLD/USD Support Retest & Breakdown Setup 📉🔍
🔹 Overview:
The chart indicates a potential bearish continuation pattern on GOLD/USD as the price is approaching a key support level at 3,335.305. Previous price action shows multiple rejections from the resistance zone (~3,435), followed by lower highs – a sign of weakening bullish momentum.
📊 Technical Analysis:
🔺 Resistance Zone (~3,435)
Multiple rejections (🔴 red arrows) indicate strong supply pressure.
Price has failed to break above this area thrice, forming a clear ceiling.
🔻 Support Zone (~3,335)
Marked as the target for a short setup.
Price is testing this level again after forming a minor consolidation below lower highs.
A clean break below this purple zone may trigger a continuation to the downside, targeting the broader support range below (~3,240).
🟠 Bearish Structure:
Series of lower highs (highlighted with circles).
Breakdown pattern is developing with declining bullish momentum.
📈 Potential Play:
A confirmed breakdown below 3,335 could lead to a drop toward the next major support.
If support holds, short-term bounce is possible but limited by the dominant resistance.
📌 Conclusion:
GOLD/USD is currently in a bearish setup, with the market eyeing a potential breakdown below a critical support zone. If this level fails to hold, we could see accelerated bearish momentum toward the lower support range.
💡 Caution: Wait for a confirmed close below support before entering any short trades.
GOLD/USD Bearish Rejection at ResistanceGOLD/USD Bearish Rejection at Resistance 📉🟥
🔍 Technical Analysis Overview:
The GOLD/USD chart shows a clear bearish rejection pattern forming near the resistance zone around $3,450, marked with red arrows. After price tested this level twice, strong selling pressure appeared, resulting in a sharp decline.
📌 Key Observations:
🔴 Resistance Zone:
Price was rejected from the resistance area around $3,450 twice, indicating strong seller presence.
Double top-like behavior seen with lower highs confirming weakening bullish momentum.
🟠 Support Zone:
A well-respected support level near $3,250 has been identified based on past reaction (highlighted with orange circles).
Price previously bounced twice from this zone, validating it as a strong support level.
🎯 Target Level:
A near-term target of $3,305.586 is marked, which aligns with previous reaction zones and short-term structure support.
If momentum continues, a deeper push toward $3,250 support is probable.
📉 Bearish Bias Justified By:
Clear rejection from resistance
Lower high formation
Current consolidation with downward bias
Possible breakout to downside if $3,305 fails to hold
⚠️ Risk Note:
If price retraces and breaks back above $3,400 with volume, the bearish setup will be invalidated.
📊 Conclusion:
The chart favors bearish continuation with a primary target around $3,305, and extended downside to $3,250 if bearish pressure sustains. Traders should watch for bearish confirmation patterns below current price before engaging.
🔽 Resistance: $3,450
🔼 Support: $3,250
🎯 Target: $3,305

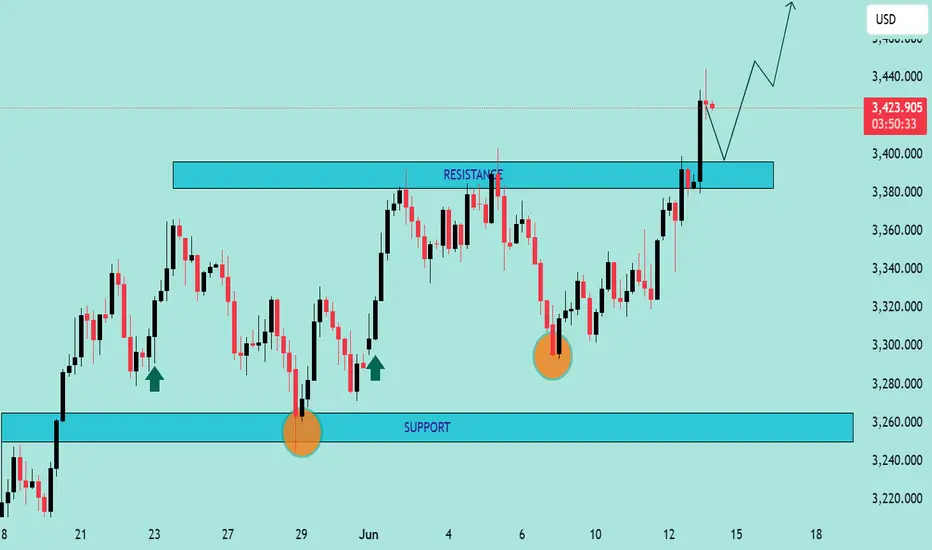
Gold on the Rise! – Bullish Setup in Focus The chart shows a repeating consolidation‑then‑breakout pattern, with Gold forming ascending swing structures, consolidating in rectangles (green), then riding higher along a rising trendline (purple). Price has just bounced off that trendline again, signaling a possible new leg up—potentially targeting the upper range near $3,448–3,450. A clear breakout above that level could open the door toward $3,500+.
📍 Trading Plan
🎯 Entry
Long on breakout above recent consolidation highs (~$3,440–3,448).
Alternatively, buy the dip near the purple trendline (~$3,385–3,390), with confirmation (hammer candle, bounce).
🛑 Stop‑Loss
For breakout: just below the top of the rectangle consolidation (~$3,389).
For trendline entry: slightly below recent swing low (~$3,358–3,360).
🎯 Profit Targets
Primary: upper rectangle level (~$3,448–3,450).
Extension: historic all‑time high region (~$3,500) → next major zone.
🎥 Path
Potential minor pullback toward trendline.
Bounce establishes support.
Surge toward top of range.
Breakout with trend continuation to new highs.
📊 Trade Risk & Reward
Target ~60–100 pts above entry, stop ~50 pts below → ideal Risk:Reward ≥ 1:1.2.
📌 Key Levels to Monitor
Level Role
$3,360 Swift dip support (green base line)
$3,390–3,400 Trendline confluence zone
$3,440–3,450 Breakout area & top of rectangle
$3,500 Next major resistance/all‑time high
🧭 Market Context & Drivers
Broad uptrend remains intact amid geopolitical tensions, especially the Israel–Iran situation, which continues to support safe-haven flows
investing.com
+15
reuters.com
+15
barrons.com
+15
forex24.pro
+1
goldpredictors.com
+1
.
Markets are positioning ahead of Fed’s June 18 decision; dovish signals could fuel continuation toward new highs (~$3,500+)
fxempire.com
.
Technical structure reflects bullish momentum—ascending wedge patterns with shallow dips and strong trendline bounces
fxstreet.com
.
✅ Summary
Bias: Bullish – uptrend intact.
Strategy: Go long on dip near trendline or on breakout above $3,445.
Stop‑Loss: Just below last swing low ($3,360).
Targets:
Near-term: $3,448–3,450
Medium-term: $3,500+
Stay tuned for Fed statements and Middle East headlines—they’ll be catalysts.

GOLD/USD Bearish Rejection at Resistance ZoneGOLD/USD Bearish Rejection at Resistance Zone 📉🟥
📊 Technical Overview:
The chart for GOLD/USD shows a clear price action behavior between a well-defined resistance zone (~3,480–3,510) and a support zone (~3,260–3,280).
🔻 Bearish Signals:
The price has tested the resistance zone multiple times (highlighted with red arrows and orange circles) but failed to break above it, indicating strong selling pressure.
The current price action suggests another lower high formation, which is a bearish signal 📉.
Recent candles are rejecting the upward move, pointing to potential downside movement.
🟩 Support Confirmation:
Previous reactions from the support zone (green arrows) show that buyers have consistently stepped in near the 3,260–3,280 range.
This level remains a key demand zone where a bounce might be expected.
🔁 Outlook:
If the price continues to reject the resistance and follows the pattern, we might see another drop towards the support area.
A break below the support zone would confirm a bearish breakout and could open the door to deeper downside targets.
📌 Conclusion:
GOLD/USD is trading within a range, but the repeated failures at resistance suggest bearish momentum might take control in the short term. A move back toward the support zone is likely unless a breakout above resistance occurs.
📉 Resistance: 3,480–3,510
🟩 Support: 3,260–3,280
🔍 Bias: Short-term Bearish unless resistance breaks

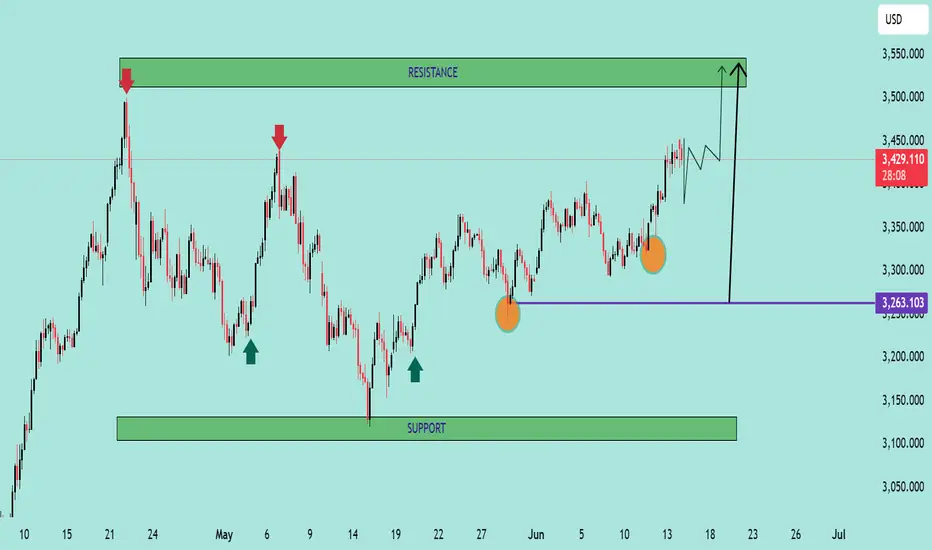
GOLD/USD – Bullish Reversal Pattern ForminGOLD/USD – Bullish Reversal Pattern Forming 🟢📈
📊 Chart Analysis:
The chart shows a strong Inverse Head and Shoulders pattern forming, which is a classic bullish reversal signal:
🔹 Left Shoulder and Right Shoulder – Marked with orange circles, both found support near the 3,263 level (purple line), suggesting strong buying interest at this zone.
🔹 Head – The lowest point in between the shoulders, also bouncing from support.
🔹 Resistance Zone – Marked with red arrows around 3,500–3,520. This zone has rejected price action multiple times in the past.
🔹 Support Zone – Marked below 3,200, where previous consolidation and buying took place.
📈 Projected Move:
The neckline breakout suggests a potential move toward the 3,520+ level. A minor pullback is expected before continuation. If price breaks above resistance, we could see a strong bullish rally.
📌 Key Levels:
Support: 3,263 🟩
Resistance: 3,500–3,520 🟥
Potential Target After Breakout: 3,550+ 🎯
✅ Bias: Bullish above 3,263 support
⚠️ Invalidation: A break below the neckline would cancel the bullish setup
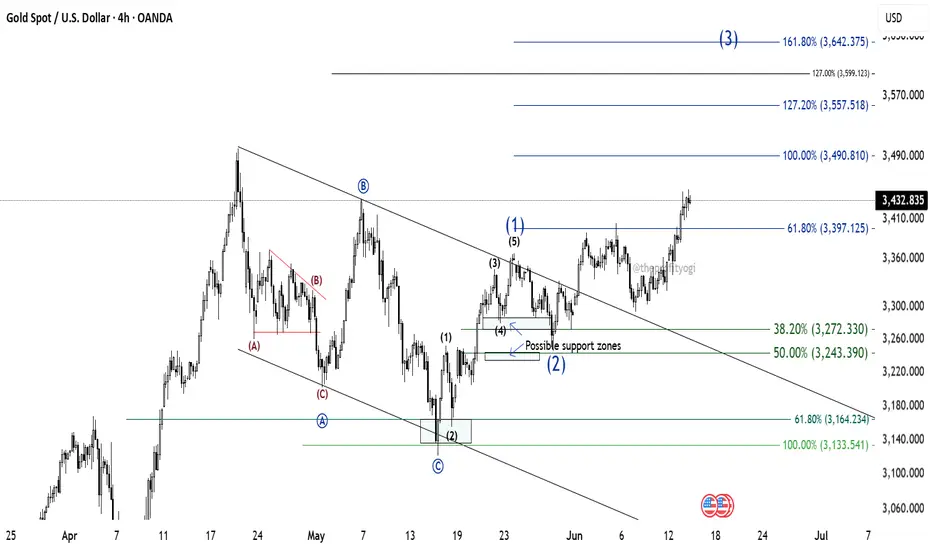
GOLD: Further levels using Elliott Wave TheoryWe successfully forecasted the path of gold in our post on May 12th.
Now, GOLD is looking like it's entering an impulse wave.
Wave (1) of this impulse was completed on 23rd May. The price then falls between the zone 38.2% and 50% to form wave (2). This was also predicted by us.
Currently, GOLD is in wave (3).
Now, to get the targets of wave (3), we have two possibilities.
1. Wave (3) goes to 100% and then reverses. This case is of the Terminal impulse. And the further path of GOLD can be predicted later.
2. Wave (3) goes to 161.8% (minimum). This is the case of Trending or normal impulse. And further path of GOLD can be predicted accordingly.
For now, GOLD is looking like going to touch at least the 100% (3490.81) level.
This analysis is based on Elliott Wave theory and Fibonacci.
This analysis is for educational purposes only.
This is not any buying recommendations.
GOLD PRICES STEADY AHEAD OF US CPI & TRADE TALKSSymbol - XAUUSD
CMP - 3324
Gold is currently testing the liquidity zone during the Asian trading session, exhibiting signs of a potential false breakout. While the metal is showing signs of recovery, the broader fundamental backdrop remains uncertain.
As of Monday, gold is trading steadily around the 3300 level, supported by a weaker US dollar and cautious sentiment among market participants ahead of upcoming US-China discussions and the release of US Consumer Price Index (CPI) data scheduled for Wednesday. Robust Non-Farm Payroll (NFP) figures for May have strengthened the dollar and diminished expectations for a near term FED rate cut. Nonetheless, ongoing domestic challenges in the US are exerting downward pressure on the currency. Investors are repositioning ahead of the CPI release.
From a technical standpoint, the trend remains bullish. Although the price previously breached structural support, it has rebounded during the Asian session following a false breakdown of both the order block and the 3300 liquidity zone. Price action in the near term will be influenced by the 3300–3335 range.
Resistance levels: 3325, 3343, 3375
Support levels: 3303, 3275
Gold appears to be approaching the 3325–3335 zone for a potential retest. Should the dollar continue to weaken and gold sustain a move above the 3340 level, the bullish momentum may persist. However, caution is warranted-a false breakout within the 3325–3335 area could signal a breakdown of the bullish structure and result in a renewed downward move.

GOLD SPOT (XAU/USD) 4H Analysis – Bullish Momentum Breakout🔔 GOLD SPOT (XAU/USD) 4H Analysis – Bullish Momentum Breakout 💥📈
📊 Overview:
Gold has confirmed a strong bullish breakout from the consolidation zone, driven by sustained support and recent upward pressure. After rebounding from the MAIN SUPPORT zone around $3,200, price action has surged and successfully touched the 1st Take Profit (TP1) zone at $3,429.
🔍 Key Levels:
🟩 Main Support: $3,200 zone — held firm and acted as a launchpad for the bullish reversal.
📌 1st TP (Touched): $3,429 — resistance level has been tested and price is currently hovering near it.
🎯 Next Target (TP2): $3,504 — price is expected to approach this zone as bullish momentum continues.
📈 Technical Outlook:
Price structure shows a clear higher low formation followed by a strong impulse breakout.
Current momentum suggests bulls are in control, with volume and volatility increasing on the upward leg.
As long as the price remains above the $3,366 short-term support, the bias remains bullish.
🛑 Risk Note:
Watch for possible rejection near TP2.
A failure to hold above $3,366 may trigger a pullback to retest lower zones.
✅ Conclusion:
The bullish continuation scenario remains valid with potential to hit the $3,504 mark. Traders may look for long opportunities on pullbacks while maintaining tight risk management. 🔐📊

GOLD/USD Bullish Breakout Confirmation GOLD/USD Bullish Breakout Confirmation 🚀📈
📊 Technical Analysis Overview:
The chart illustrates a bullish breakout above a well-defined resistance zone around $3,390–$3,400. Price action has decisively closed above this resistance, suggesting strong bullish momentum.
🔍 Key Observations:
🟦 Support Zone:
Marked clearly between $3,250–$3,280, this level has held firm multiple times (highlighted with green arrows and orange circles), confirming buyer interest and market structure.
🟦 Resistance Turned Support:
The previous resistance zone around $3,390–$3,400 has now potentially turned into a new support. Price retesting this zone and holding would further validate the breakout.
📈 Future Projections:
The chart anticipates a retest-pullback-continuation scenario:
Pullback to new support 📉
Bullish continuation toward $3,460+ 🎯 if support holds.
✅ Bias:
Bullish as long as price remains above the $3,390 zone. Break and hold below would invalidate the bullish setup.
📌 Strategy Tip:
Look for confirmation on the lower timeframes (e.g., bullish engulfing or pin bar) on the retest before entering long.
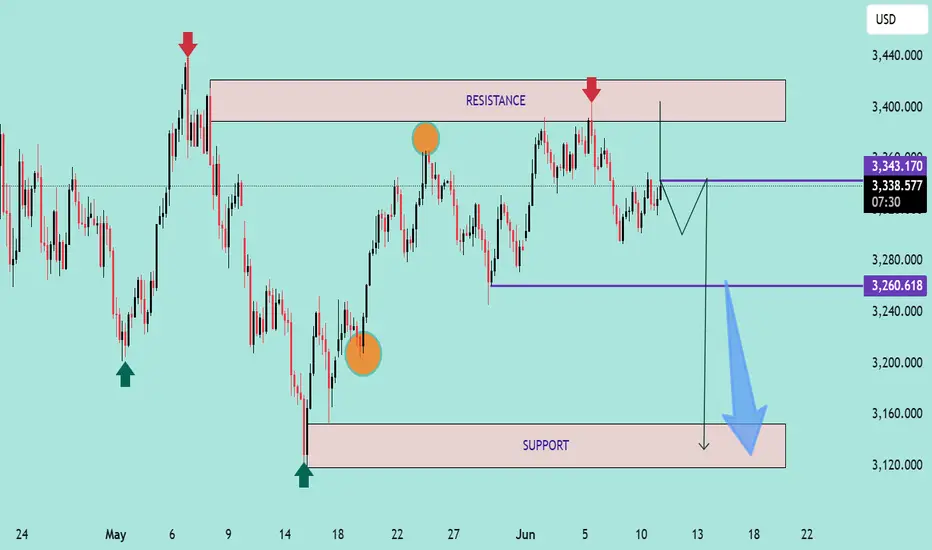
GOLD PRICE ACTION ANALYSIS – June 11, 2025 GOLD PRICE ACTION ANALYSIS – June 11, 2025 🟡
Technical Breakdown & Bearish Scenario Ahead ⚠️📉
🔍 Overview:
The chart presents a clear range-bound structure with strong horizontal resistance around the $3,400–$3,420 zone and support around the $3,120–$3,160 level. Price is currently trading near the upper range of the consolidation.
📊 Key Technical Levels:
🔴 Resistance Zone: $3,400 – $3,420
➤ Price has been rejected here multiple times (highlighted by red arrows and orange circles), showing strong supply pressure.
🟣 Intermediate Support: $3,260.618
➤ This level acted as a minor support and could be tested again if the current pullback deepens.
🟤 Major Support Zone: $3,120 – $3,160
➤ A key demand area where price previously bounced significantly.
📉 Bearish Setup:
A potential lower high is forming just below the resistance zone.
The projected path suggests a minor pullback to form a bearish retest, followed by a potential breakdown below $3,260.
If the $3,260 support is broken decisively, further downside toward the $3,120–$3,160 support is likely (blue arrow projection).
🔄 Bullish Scenario (Invalidation):
A breakout and strong close above $3,420 could invalidate the bearish structure.
In that case, price might attempt to target higher resistance levels beyond $3,440.
📌 Conclusion:
Gold remains in a range with a bearish bias unless the $3,420 resistance is breached.
🔽 Watch for confirmation below $3,260 for bearish continuation.
✅ For bulls, wait for a strong breakout above resistance with volume.
XAUUSD | Technical Analysis 9 June 2025Hi,
I have shared my view on how gold can follow the levels which I have shown in video. In long term view gold is in downtrend, but for short term in 1hr and 15mini it can retrace back upside.
Disclaimer: This is only for educational purpose.
Thanks

Potential Breakdown with Retest or Reversal Zone This chart represents a classic Double Top pattern, a bearish reversal signal indicating strong resistance around the 3,380 - 3,390 USD zone (marked with two white circles).
🔍 Key Zones and Levels:
1. Resistance Zone (~3,380 - 3,390 USD):
Price was rejected twice here.
Suggests strong selling pressure and buyer exhaustion.
2. Mid Support/Retest Zone (~3,337.857 USD):
Marked with a horizontal white line.
Could act as a short-term resistance if price retraces.
3. Demand Zone (~3,330 - 3,337 USD):
Highlighted green box: potential reversal/retest zone.
Bullish scenario: price bounces from here and heads back to retest resistance.
4. Current Price (~3,309.980 USD):
Price has broken below the demand zone and is approaching strong horizontal support.
5. Lower Support (~3,265 - 3,270 USD):
Highlighted with blue horizontal lines and purple arrows.
Could be the next bearish target if breakdown is confirmed.
🔄 Two Possible Scenarios:
📉 Bearish Continuation:
Price retests the broken demand zone (now resistance).
Rejects and forms a lower high.
Falls toward the lower support around 3,265–3,270 USD.
📈 Bullish Reversal:
Price reclaims the green demand zone.
Pushes above 3,337.857 USD level.
Heads back to retest the double top area (~3,380
✅ Conclusion:
The bias is currently bearish, supported by:
Double top formation.
Breakdown below key demand zone.
Momentum favoring further downside
However, a bullish reversal is possible if price reclaims the 3,337 USD zone and shows strong bullish structure.

GOLD NEW HIGH!!!! BULLISH As per my view , today or tomorrow is the last chance for price to take off.
If the price takes off ,then in one or two weeks , it will reach new all time high.
If today or tomorrow is firm bearish means then, it will fall for sometime.
Former is likely to happen. I am going to a trade in XAUUSD today( buy).
take a trade in 1 hour timeframe and do a big swing trade today.
I feel a opportunity to swing gold.
Comment your thoughts and like if you likes.

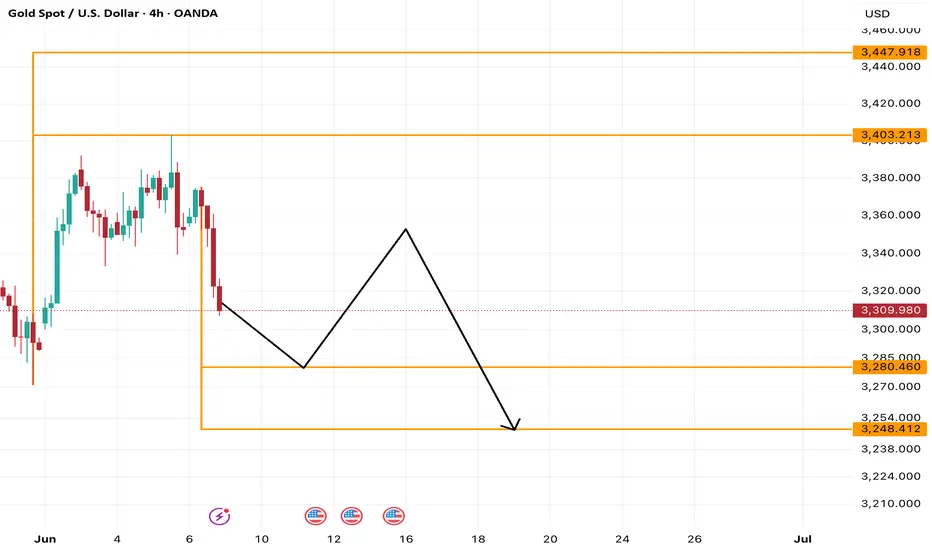
XAUUSD | Weekly Analysis for Week 9 - 13 June 2025Hi,
I am sharing my view on gold movement for coming week. It can go downside upto 3280 and 3248 levels.
Disclaimer: This is only for educational purpose.
Thanks
Gold Uptrend Continues June 6, 2025As yesterday Gold made high of 3403, I was expecting to cross upto 3430 but it dropped sharply. News was strong and as it made cautious to investors and safe heaven asset declines moved back to riskers market to 3340.
Now today you can check a pattern and gold is moving in that support and resistance, expecting it to move upward. Currently the situation is unexpected as gold may come down to 3340 and then move upward or directly upward from 3358. Our target is 3375-3389-3400.
Key point.
Resistance - 3360, 3375, 3389, 3400
Support - 3340, 3354
Any Query Reach Us or comment down
Rudra Vasaikar Wishes You A Great And Very Amazing Trading Life. Trade Safe, Trade Right.
RISK WARNING 🔴 🔴 🔴
There is high risk of loss in Trading Forex, Crypto, Indices, CFDs, Features and Stocks. Choose your trade wisely and confidently, please see if such trading is appropriate for you or not. Past performance is not indicative of future results. Highly recommended - Information provided by Pro Trading Point are for Educational purpose only. Do your investment according to your own risk. Any type of loss is not our responsibility.
HAPPY TRADING.
#gold #xauusd #xauusdtrading #goldtrading #goldanalysis #forextrading #forex #trendline #goldsignals #goldnews goldlatestanalysis #xauusdtradesetup #forextradingguide #fxgold

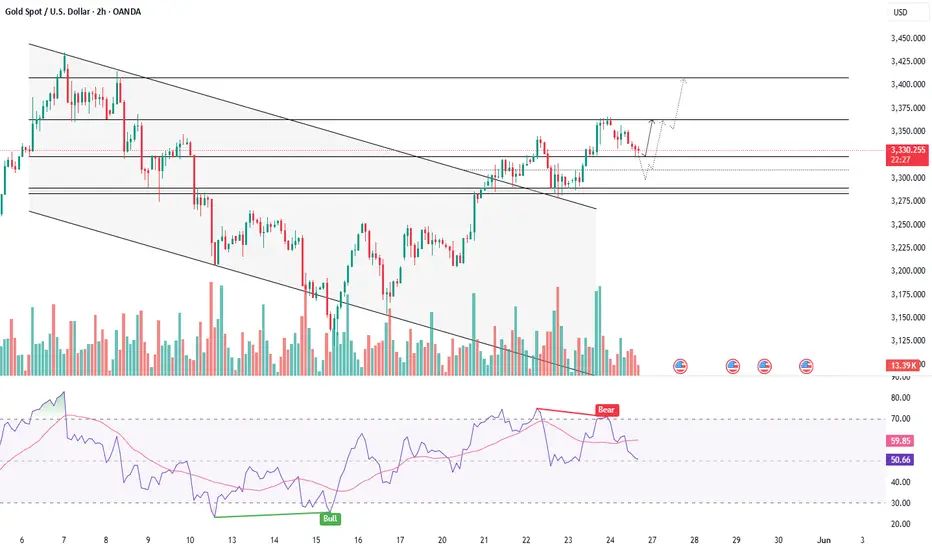
Chart Overview Instrument: Gold Spot (XAU/USD)🔍 Chart Overview
Instrument: Gold Spot (XAU/USD)
Timeframe: 2H (2-hour candles)
Date/Time: Chart ends on June 5th, 2025, 19:14 UTC.
🟩 Support & Resistance Zones
✅ Resistance Zone
Level: Around 3,355 – 3,375 USD
📌 This zone has seen repeated tests and rejections, indicating strong selling pressure.
✅ Support Zone
Level: Around 3,160 – 3,180 USD
🛡️ Price bounced from this zone previously, confirming it as a strong support area.
⚙️ Key Observations
📈 Range-Bound Trading
The price is currently trapped between the strong support and resistance zones.
Multiple rejections at the resistance zone suggest sellers are active above 3,355 USD.
💡 Horizontal Consolidation
Price has formed a horizontal range (sideways movement) in recent sessions.
This range-bound behavior signals market indecision or a buildup before a potential breakout.
📉 Previous Price Action
🔽 Sharp Reversal Drop
Around the middle of May, there was a strong rejection at resistance, followed by a rapid sell-off to the support zone.
This shows that the resistance zone is significant and that sellers are quick to act.
🔮 Potential Scenarios
✅ Bullish Breakout
If price closes above 3,375 USD with strong momentum, expect a potential bullish rally toward 3,400+ USD.
✅ Bearish Rejection
If price fails to close above 3,355 USD and shows rejection candles (like dojis or bearish engulfing patterns), price may retest 3,280 USD and even support at 3,160 USD.
🔔 Key Takeaway & Trader’s Tip
⚠️ Watch for breakout signals near resistance and support.
✅ Volume spikes and momentum indicators will help confirm true breakouts or fakeouts.
🔍 Neutral to Bearish Bias
Given repeated rejections at resistance, short-term bias is neutral to bearish unless a breakout occurs.
📝 Summary with Emojis
🔴 Resistance Zone: 🔝💪
🟩 Support Zone: 🛡️🟢
📉 Bearish Momentum likely below 3,355 USD
📈 Bullish Breakout above 3,375 USD
🕵️♂️ Watch for consolidation and breakout setups!

GOLD - BULLISH OUTLOOK WITH SHORT TERM PULLBACKSymbol - XAUUSD
Gold is currently testing the liquidity zone near the 3350 level, exhibiting signs of a potential false breakout above resistance within the prevailing upward trend. A short-term correction may occur before the continuation of the broader bullish movement.
The fundamental backdrop in the market remains complex and somewhat contradictory. Presently, attention is centered on geopolitical developments, particularly the heightened tensions between Russia and Ukraine following the recent weekend escalation. Market participants are closely monitoring diplomatic negotiations taking place in Turkiye. Additionally, the ongoing uncertainty surrounding international tariff policies continues to exert pressure on sentiment.
Since the session's open, gold has demonstrated strong upward momentum, approaching a key liquidity & resistance zone. A false breakout at resistance appears to be forming, which could prompt a corrective pullback toward a key area of interest. Simultaneously, the US dollar is testing a support level, potentially signaling a local correction before resuming its directional movement. This interplay may influence gold prices, which retain an overall bullish outlook.
Resistance levels: 3350, 3365, 3409
Support levels: 3303, 3264
The price has broken out from a consolidation phase, having tested resistance and triggered liquidity above the 3350 mark. Given the current positioning, a retracement toward support levels is plausible before the uptrend resumes.

XAUUSD | Technical Analysis 3rd June 2025Hi,
I am sharing my view on gold further movement.
Disclaimer: This is only for educational purpose.
Thanks

XAUUSD | Intraday Technical Analysis 2nd June 2025Hi,
Gold can go upto 3351 and 3400 on traday basis.
Disclaimer: This is only for educational purpose.
Thanks

XAUUSD Technical Analysis | Week 2nd - 7th JuneHi,
I am sharing my view on gold for week 2nd to 7th June.
Disclaimer: This is only for education purpose.
Thanks

GOLD - RETESTING SUPPORT BEFORE THE NEXT CLIMBSymbol - XAUUSD
CMP - 3327
Gold continues to strengthen, supported by a complex and evolving fundamental landscape.
A false breakdown below the 3285 support level has facilitated a move to a new local high at 3365
Despite a weaker US dollar, gold experienced a modest pullback from the 3365 high amid subdued market activity caused by US market holiday. Investor sentiment reflects profit-taking ahead of key US inflation data releases. Additional downward pressure is linked to optimism surrounding a potential trade agreement between the United States, Europe and Japan. Nonetheless, the decline in gold prices remains limited, as safe-haven demand persists in response to ongoing geopolitical tensions, US fiscal concerns, and instability in the Middle East.
Support levels: 3321, 3308, 3300
Resistance levels: 3363
From a technical perspective, gold appears to be executing a false breakout above consolidation resistance and is entering a corrective phase. During this correction, the price may target liquidity zones in the 3320-3303 range before resuming its upward trajectory.