XAUUSD Technical View 29 May 2025Hi,
I am sharing my view on gold for intraday.
Disclaimer: This is only for educational purpose.
Thanks
Goldprediction

Gold (XAUUSD) Technical Observation (XAUUSD):
If Gold (XAUUSD) breaks below the 3279.05 level on the 1-hour time frame, there is a possibility of a move towards the weekly support around the 3241 level. This is purely a technical observation based on current price action and support levels.
Disclaimer:
This is not a trade setup or a trading signal. The content shared is for informational and educational purposes only. It should not be considered as financial advice. Always conduct your own research or consult with a qualified financial advisor before making any trading decisions. Trading in financial markets involves significant risk and may not be suitable for all investors.

XAU/USD Technical Analysis – 4H Chart Overview🔍 Current Market Position
Price: $3,358.125
Currently near resistance zone ($3,420–$3,470)
Historical reaction in this zone shows multiple rejections 🛑
📌 Key Levels
🔺 Resistance Point: ~$3,420–$3,470
Rejected here 3 times ➡️ strong supply zone
🔻 Support Level: ~$3,150
Past price bounced here multiple times 🟠
💪 Strong Support: ~$2,950
Major bounce seen in early May 👊
🧭 Pattern Outlook
Repeated resistance test 🔁 ➡️ potential double/triple top
📉 Blue arrow suggests bearish projection towards $3,050–$2,950
If support at $3,150 fails 🔓, expect deeper drop to strong support
🔮 Forecast
🔽 Bearish Bias
High chance of reversal from resistance
Target: $3,050 and possibly $2,950 🎯
⚠️ Watch for
Price Action at Resistance: Rejection = short opportunity 🔧
Break of $3,150 Support: May accelerate bearish move 🧨
📌 Summary:
Market shows clear resistance rejection history. If it plays out again, we may see a strong drop toward lower support zones. Ideal for short setups 📉💼

XAUUSD/GOLD 4H BUY PROJECTION 25.05.25🟢 Overall Bias: BUY Projection
The chart suggests a bullish outlook, predicting that gold will rise significantly after a breakout and retest pattern.
🔍 Key Technical Elements:
Trendlines:
4H Downtrendline: This was a significant resistance trendline that has now been broken.
4H Uptrendline: Indicates a recent shift to bullish momentum.
Support & Resistance Zones:
Support S1: A solid demand zone around 3,275–3,300 USD.
Immediate Support: Zone around 3,325 USD.
Resistance R1, R2, and R3: Key resistance levels.
R1: ~3,375 USD
R2: ~3,425 USD
R3 & ATH (All-Time High): ~3,500+ USD
Breakout Confirmation:
The price broke above the 4H Downtrendline and Resistance, and then retested that area successfully, confirming it as new support (highlighted by the box labeled "BREAKER RESISTANCE RETESTED AND BROKE TRENDLINE").
Change of Character:
Marked in the zone labeled "CHANGE OF CHARACTER APPEARED HERE", indicating a shift from bearish to bullish market structure.
📈 Price Projection:
The price is projected to move upwards through multiple resistance zones, eventually targeting the 3,500 USD+ region.
Arrows indicate a bullish path with minor pullbacks, moving towards:
Resistance R1 → Resistance R2 → Resistance R3 (ATH).
🟥🟩 Risk Management:
Stop-Loss Zone (Red Area): Below 3,300 USD – in case the breakout fails and the price re-enters the downtrend.
Target Zone (Green Area): Extends to 3,500+ USD – aligning with historical highs.

Gold (XAU/USD) Bullish Breakout Trade Setup – Targeting $3,4201. Entry Point Zone (~3,302.88 - 3,317.09):
This is the area where a long position (buy) is suggested.
The price has already moved slightly above this zone, indicating the trade may have already been triggered.
2. Stop Loss (~3,260.41 - 3,299.02):
Positioned below the entry zone to limit downside risk.
Suggests that if the price drops below this support zone, the trade idea is invalidated.
3. Target Point (3,420.41):
A bullish target suggesting a potential upside move of ~117.62 points (or ~3.56%).
This zone acts as a take-profit level.
4. Technical Indicators:
Moving averages (possibly 50 EMA in red and 200 EMA in blue) show a bullish crossover recently, supporting the upward momentum.
5. Pattern Outlook:
The chart implies a possible cup-and-handle or bullish consolidation breakout pattern, anticipating continuation upward.
Summary:
The strategy depicted is a bullish breakout setup:
Buy near 3,302.88–3,317.09
Stop Loss near 3,260–3,299
Take Profit near 3,420
This setup favors buyers as long as the price remains above the stop-loss zone. If the market holds this structure, there's a good risk-reward ratio for a move to 3,420.41.

GOLD SHOWING A GOOD UP MOVE WITH 1:10 RISK REWARD GOLD SHOWING A GOOD UP MOVE WITH 1:10 RISK REWARD
DUE TO THESE REASON
A. its following a rectangle pattern that stocked the market
which preventing the market to move any one direction now it trying to break the strong resistant lable
B. after the break of this rectangle it will boost the market potential for break
C. also its resisting from a strong neckline the neckline also got weeker ald the price is ready to break in the outer region
all of these reason are indicating the same thing its ready for breakout BREAKOUT trading are follws good risk reward
please dont use more than one percentage of your capitalfollow risk reward and tradeing rules
that will help you to to become a bettertrader
thank you

XAU/USD) Buy Trade Setup – Entry, Target & Risk Management Plan Entry Point:
3,140.34 USD
This is the suggested level to enter a long (buy) trade.
Stop Loss (SL):
3,121.66 USD
A protective level to limit losses if the trade goes against the setup.
Target Point (Take Profit - TP):
3,251.33 USD
This is the EA target point — where profits are expected to be taken.
---
3. Risk/Reward Ratio:
Risk: From 3,140.34 to 3,121.66 = 18.68 points
Reward: From 3,140.34 to 3,251.33 = 110.99 points
Risk/Reward Ratio ≈ 1:6, which is very favorable.
4. Resistance Point:
Around 3,222.45 - 3,227.27
This area might act as a challenge for price movement, potentially leading to temporary retracements.
5. Indicators:
Moving Averages: Red (shorter period) and Blue (longer period) lines help indicate trends.
The price is moving above the short-term MA but currently under the long-term MA, which might suggest a short-term bullish move within a broader downtrend or sideways range.
Conclusion:
This is a bullish setup, anticipating a reversal or continuation to the upside after a pullback:
Buy Zone: 3,140.34
Stop Loss: 3,121.66
Take Profit: 3,251.33
If the price drops to the entry point zone

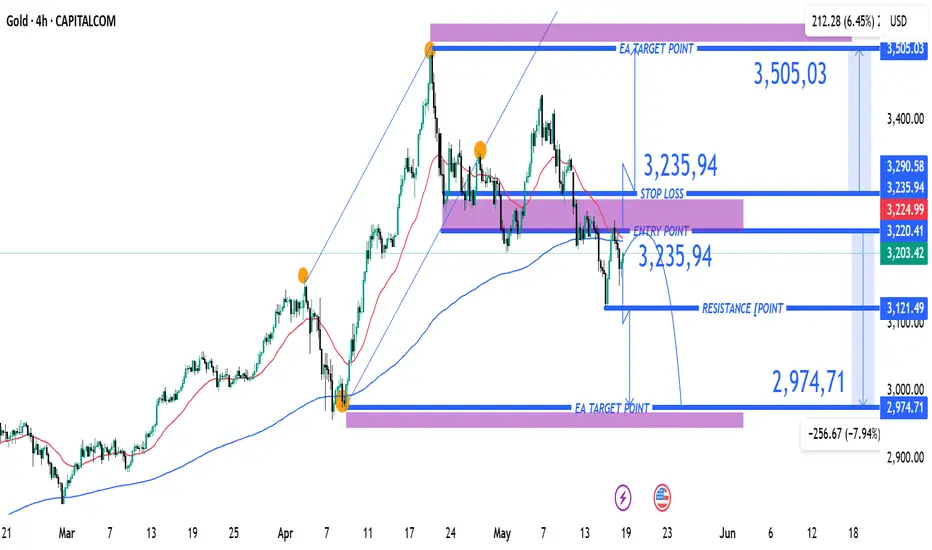
XAUUSD Bearish Setup with Key Entry, Stop Loss & Target LevelEntry Point: $3,235.94
Stop Loss: $3,235.94 (above current price, suggesting a SELL trade)
Target Points:
EA Target Point (Downside): $2,974.71 (Short target)
EA Target Point (Upside): $3,505.03 (Long target — likely alternate scenario)
Resistance Level: $3,121.49
Nearby Support Zone: Around $3,000–$2,975
📉 Trade Strategy Implied
This appears to be a short position setup:
Sell at: ~$3,220–$3,235
Stop Loss: $3,235.94
Take Profit: $2,974.71
Risk/Reward Ratio: ~1:3 (very favorable setup if thesis holds)
The upside target ($3,505.03) might be for a different scenario — if price reverses and breaks above resistance.
🧠 Market Structure Observations
Trend: A bearish break from a previous ascending channel.
Momentum: Price has bounced slightly after hitting support, but the moving averages suggest bearish momentum may persist.
Key Risk: If price breaks above $3,236 convincingly, it could invalidate the short setup and trigger a bullish run.
📌 Summary
Bias: Bearish (based on current setup)
Setup: Short with tight stop above resistance
Confirmation Needed: Watch for rejection at the $3,220–$3,236 zone and a breakdown below $3,200 for follow-through.
XAU/USD Technical Analysis for Next Week (May 18–23, 2025)
# The following technical analysis for XAU/USD (Gold/US Dollar) is based on current market conditions, recent price action, and insights, focusing on key levels, trends, and potential price movements for the upcoming week. This analysis integrates technical indicators, support/resistance levels, and market sentiment while critically examining the data for a balanced outlook.
# Current Market Overview
Price as of May 17, 2025 closed around $3,204
Recent Price Action: Gold has experienced a sharp decline from highs near $3,430–$3,500, dropping to a one-month low below $3,200. Unable to close below support level $3,163
A corrective bounce has occurred, with prices testing key support zones in 4 hour time frame.
# Market Sentiment: Mixed, with short-term bearish pressure due to fundamental factors (e.g., US-China tariff truce, Fed's hawkish stance) but potential bullish triggers from renewed dollar weakness or geopolitical shocks. Technical indicators show neutral to bearish signals, with some bullish setups emerging on lower timeframes. (4-Hour)
Key Support and Resistance Levels given in the chart for your reference

Bullish BAT on XAU/USDThere is a good chance for a prospective bullish BAT pattern on OANDA:XAUUSD if price touches around 3021.

XAU/USD) Bullish Trade Setup – Targeting $3,506.52 with Entry atEntry Point: $3,221.19
Stop Loss: $3,169.80
Resistance Zone: Around $3,277.98 to $3,280.64
Target (TP) Point: $3,506.52 (Approx. 9.05% upside)
📊 Technical Indicators and Markings:
Moving Averages:
Likely a 50-period (blue) and 200-period (red) moving average.
Price is currently below both MAs, signaling a short-term downtrend.
Support & Resistance Zones:
Strong support around $3,207.67–$3,221.19 (entry area).
Resistance at $3,244.25–$3,280.64.
Stop-loss is strategically placed below support to limit downside risk.
Target Area:
Projected upside target is $3,506.52, with a potential 9.05% gain from the entry.
This is marked as the EA (Expert Advisor) Target Point, possibly suggesting this is a strategy from an automated trading system.
Orange Circles:
Likely indicate swing highs and lows, used to identify trend patterns and potential reversal points.
📈 Trading Idea Summary:
Bullish Setup: Buying at support, aiming for breakout above resistance to reach target.
Risk-Reward Ratio: Favorable, assuming price holds above $3,207.
Watch for Confirmation: Price needs to break above resistance around $3,280 for momentum continuation

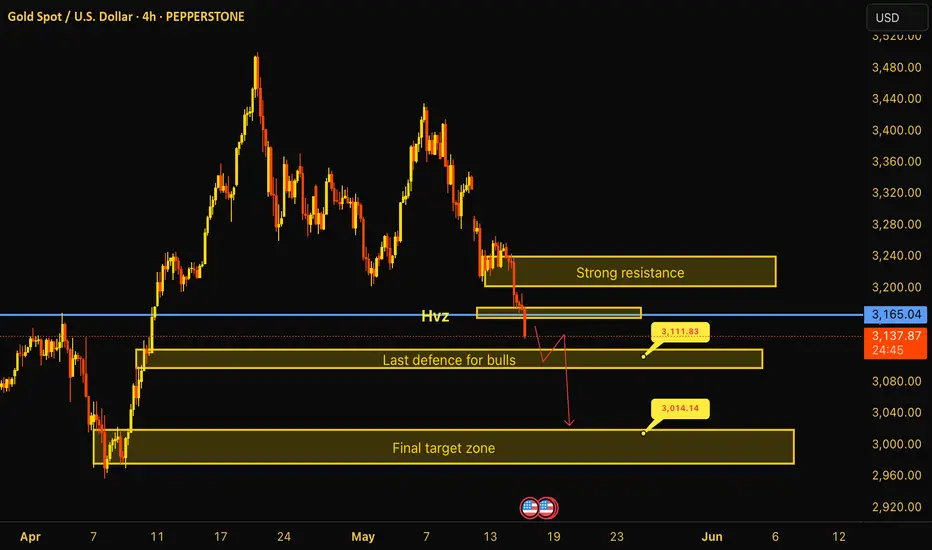
XAU/USD Medium-Term Breakdown: Market Structure Shift Confirmed!Gold has officially entered a bearish phase after decisively breaking below a key high-volume support zone around $3225, which now flips into a major resistance level. This wasn’t a minor flush — it was a clean structural break that reflects deeper underlying weakness.
⸻
Key Technical Highlights:
1. HVZ Breakdown – The Trend Flip Signal
The HVZ (High Volume Zone) at ~$3,165 was acting as a base where buyers previously absorbed sell pressure. But the recent breakdown with strong bearish candles confirms that buyers have lost control Still watch today close may15 -2025. Price attempted to hover above it for several sessions, but once it gave in, the breakdown was swift — signaling a shift in control from bulls to bears.
Now, any bounce back into the 3,150–3,165 range is likely to meet aggressive selling — this has now become a sell zone, not a support.
⸻
2. 3111 – The Last Stand for Bulls
The current trading region — around $3,111 —3120 is the final line of defense for buyers. This zone was an earlier demand pocket and acted as the origin of the strong April rally. If bulls can hold this, we may see short-term relief or a retest of HVZ.
But if this zone fails, especially on a candle close with volume, it would trigger another wave of liquidation, as this region is structurally thin and lacks strong historical support.
⸻
3. Projected Path – The Final Flush to $3,014–3,000
Once the 3111 level is broken, gold opens up downside space to the $3,014–3,000 zone — which is the final target as marked on the chart.
This zone is significant for three reasons:
• It marks the origin of the April bullish move.
• It’s a historical accumulation block.
• Psychological round number ($3,000) often acts as magnet for liquidity grabs or rebounds.
It’s also where institutional buyers may reappear to attempt a reversal, provided macro conditions align.
⸻
Momentum & Behavior:
The current momentum favors the bears:
• Lower highs, lower lows are in place.
• Failed breakout attempts above $3,240 only strengthened bearish intent.
• Breakdown below HVZ happened with conviction — not a fakeout.
Also, notice the slow grinding nature of the recent move. This isn’t panic selling, it’s a controlled liquidation, which often leads to a final flush, then sharp bounce — especially if macro triggers (like rate cuts or Fed dovishness) hit the news cycle.
⸻
Conclusion:
• Bias: Medium-term bearish
• Invalidation: Only above $3240 reclaim with volume
• Key Levels:
• Resistance: 3,165
• Pivot: 3,111
• Target: 3,014 / 3,000 zone
The safest approach now? Sell the bounces, not the dips — unless you’re playing the final drop scalps with tight risk.
XAUUSD SHOWING A GOOD DOWN MOVE WITH 1:10 RISK REWARD XAUUSD SHOWING A GOOD DOWN MOVE WITH 1:10 RISK REWARD
DUE TO THESE REASON
A. its following a rectangle pattern that stocked the market
which preventing the market to move any one direction now it trying to break the strong resistant lable
B. after the break of this rectangle it will boost the market potential for break
C. also its resisting from a strong neckline the neckline also got weeker ald the price is ready to break in the outer region
all of these reason are indicating the same thing its ready for breakout BREAKOUT trading are follws good risk reward
please dont use more than one percentage of your capitalfollow risk reward and tradeing rules
that will help you to to become a bettertrader
thank you

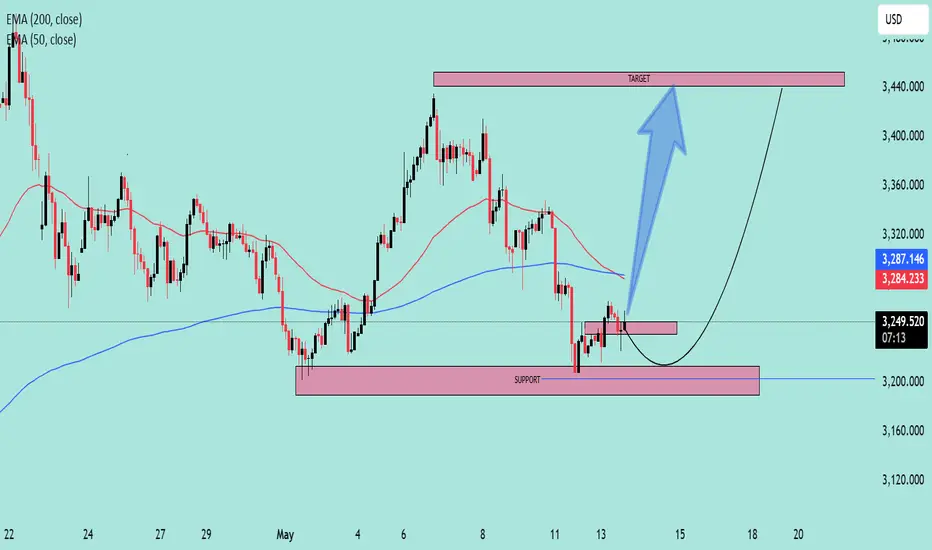
Bullish Reversal Forming at Key Support Zone – Targeting 3,450Instrument: Unspecified (likely XAU/USD or an index, judging by the price range)
Current Price: ~3,250.100
Indicators Used:
EMA 50 (Red): 3,284.255
EMA 200 (Blue): 3,287.152
🟣 Key Zones:
Support Zone: Around 3,200 – a strong demand zone where price previously bounced.
Target Zone: Around 3,450 – the last major resistance and recent high.
📉 Current Price Action:
Price recently tested the support zone and is forming a potential double bottom pattern.
EMAs are above the price, indicating a short-term bearish trend, but the price holding support may suggest a possible reversal.
A bullish trajectory is drawn, projecting a potential rise toward the target zone at 3,450.
📈 Potential Trade Idea (Hypothetical):
Entry: Near current price or on pullback to the small support box (~3,240)
Stop-loss: Below the major support (~3,190)
Take-profit: Around 3,450
⚠️ Key Considerations:
Price needs to break above the EMAs to confirm momentum shift.
Watch for confirmation with bullish candlesticks or volume spike.
Failure to hold the 3,200 support could invalidate this setup.
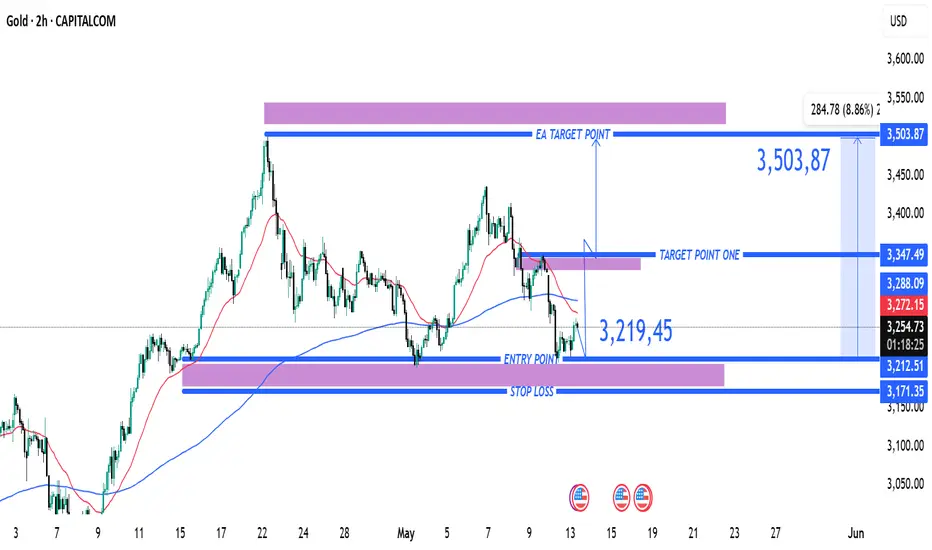
XAU/USD) 2H Trade Setup – Long Entry from Support with Targets aEntry Point: 3,219.45
Stop Loss: 3,171.35
Target Point One: 3,347.49
EA Target Point (Final Target): 3,503.87
Trade Plan:
Risk Zone: Between entry (3,219.45) and stop loss (3,171.35). The trader risks roughly 48.1 points.
Reward Zone: From entry to:
Target Point One: ~128 points.
Final Target (EA Target): ~284.4 points.
Risk-Reward Ratios:
To Target Point One: ~2.66:1
To EA Target Point: ~5.9:1
Indicators and Signals:
Price appears to be bouncing off a support zone near 3,212–3,219, indicating a potential reversal.
200 EMA (blue) and 50 EMA (red) are shown; price is slightly above the 200 EMA, suggesting long-term support.
There is a downtrend before the bounce, so this might be a counter-trend trade or the start of a new trend.
Summary:
This setup is a classic bounce from a demand/support zone with a clear upside potential. The risk is tightly managed, and the reward is significantly higher, aligning with favorable risk-reward principles. However, the position is speculative and relies on bullish follow-through from the support level. Watch price behavior near the 3,288 and 3,347 resistance zones to assess momentum.
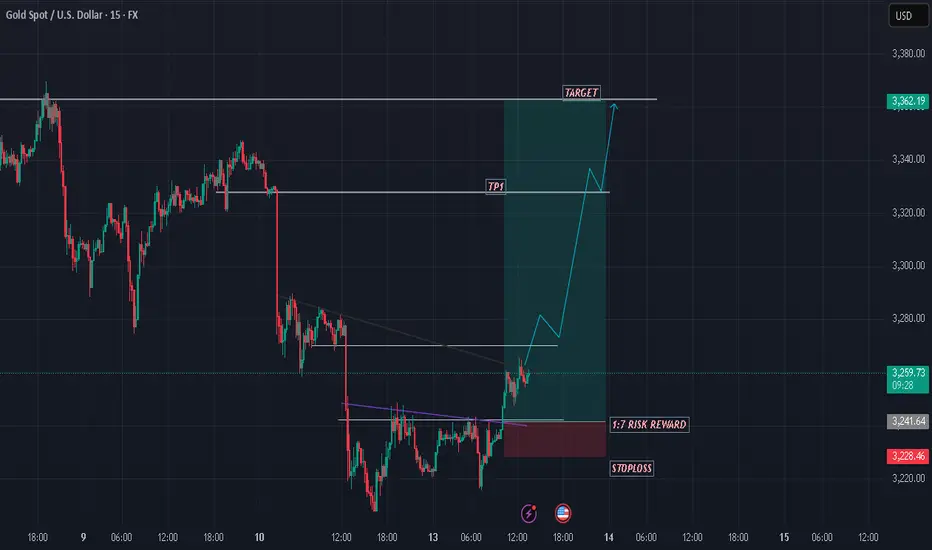
GOLD SHOWING A GOOD UP MOVE WITH 1:7 RISK REWARD GOLD SHOWING A GOOD UP MOVE WITH 1:7 RISK REWARD
DUE TO THESE REASON
A. its following a rectangle pattern that stocked the market
which preventing the market to move any one direction now it trying to break the strong resistant lable
B. after the break of this rectangle it will boost the market potential for break
C. also its resisting from a strong neckline the neckline also got weeker ald the price is ready to break in the outer region
all of these reason are indicating the same thing its ready for breakout BREAKOUT trading are follws good risk reward
please dont use more than one percentage of your capitalfollow risk reward and tradeing rules
that will help you to to become a bettertrader
thank you
XAU/USD Intraday Trade Signal**Date:** May 13, 2025
**Asset:** Gold (XAU/USD)
**Trade Type:** Intraday Buy
**Buy Zone:** 3240.00 - 3250.00
**Stop Loss:** 3207.00 (set below entry for risk management)
**Take Profit Levels:**
1st TP: 3260.00
2nd TP: 3278.00
3rd TP: 3294.74
4th TP: 3317.63
5th TP: 3347.38 (near potential high)
**Strategy:** Enter a buy position within the 3240.00–3250.00 range. Place stop loss at 3207.00 to limit downside risk. Target progressive take-profit levels, with the 5th TP at 3347.38 as a stretch goal near the daily high. Monitor price action closely and adjust trailing stops to lock in profits as targets are hit. Ensure risk-reward ratio aligns with your trading plan.

Gold Analysis >XAU/USD – 4H Chart 12/5/2025Gold is currently respecting the 3330–3350 zone as a strong supply region. This area has repeatedly acted as a ceiling where sellers have stepped in aggressively, preventing further upside momentum. The recent attempt to push higher was again met with selling pressure, confirming this level as a key short-term resistance.
Unless price decisively breaks above 3350 with strong volume, the bias remains mildly bearish. The downside targets the 3230 high volume zone, which is structurally important. This area has previously absorbed heavy orders and acted as a base for bullish continuation moves. If price approaches this level again, it could attract renewed buying interest.
For now, price seems caught in a range between strong sellers at the top and potential buyers waiting lower.

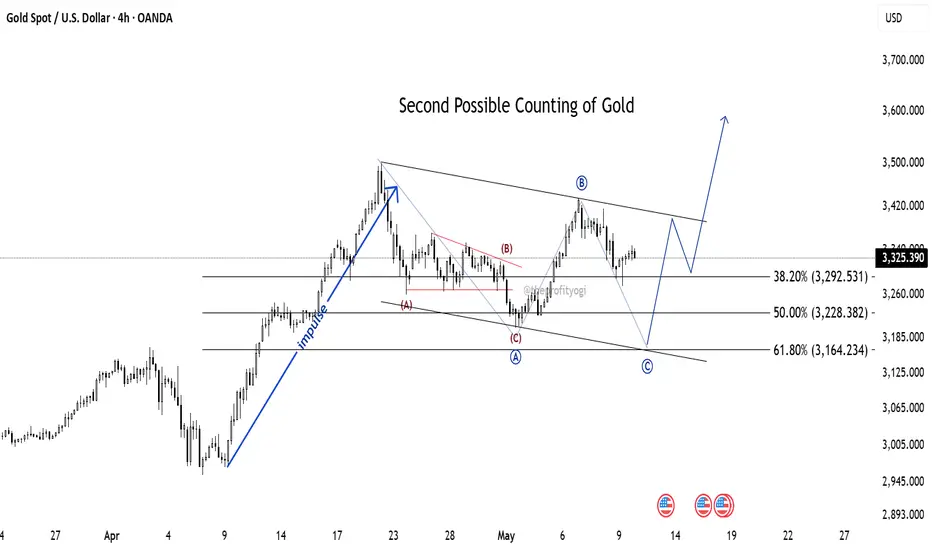
Another Possible Elliott Wave counting of GoldCounting 2:
Here, after an impulse, a Zig-zag correction is formed (marked in red ABC)
Here, I have assumed that this is just point (A) of further correction (in blue colour).
Then the price has gone to form wave (B), and currently the market is in wave (C).
This correction will complete near 61.8% (near 3164 level). And from here, a new impulse will start.
This analysis is based on Elliott Wave theory and Fibonacci study.
This analysis is for educational purposes only.
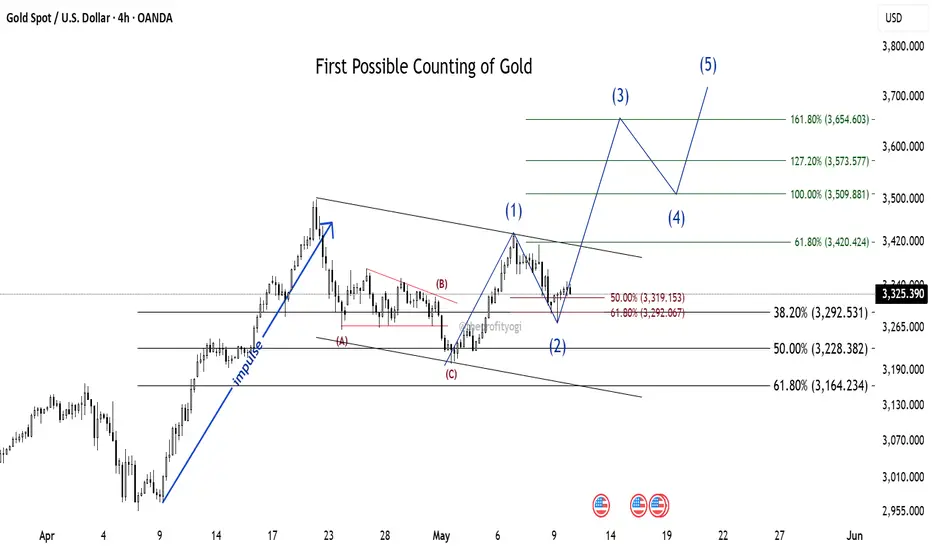
Possible Elliott Wave counting of GoldCounting 1:
After a clear impulse, the price formed a Zig-zag correction (marked in red ABC).
If the correction is completed near 50% (near 3228 level), then the recent upmove is a new impulse.
Of which wave 1 is completed, reaching a high of 3435. The market is currently in wave 2, and the next possible moves are marked as impulse counting (blue 12345).
This analysis is based on Elliott Wave theory and Fibonacci study.
This analysis is for educational purposes only.
(XAU/USD) Bearish Trade Setup – Targeting $3,222 with 1:6 Risk/R(Sell) setup.
Entry Point: Around 3,409.33 - 3,408.41 USD.
Stop Loss: 3,437.87 USD.
Target (Take Profit): 3,222.53 USD.
Risk/Reward Ratio: Approximately 1:6, which is favorable.
📉 Price Action & Trend Analysis:
A rising wedge (or channel) appears to have formed and broken to the downside — a bearish signal.
The current price at 3,341.47 has broken below a minor support zone (highlighted in purple), indicating bearish momentum.
Price is now approaching the 200 EMA, which is acting as potential dynamic support.
📌 Key Levels Highlighted:
Support Zones: Near 3,347.47 (previous minor support) and 3,222.53 (main target zone).
Resistance Zones: At the entry level and above, near 3,437.87 (Stop Loss zone).
🔄 Indicators:
Moving Averages (Red and Blue Lines): Shorter-term moving average (red) is below the longer-term (blue), indicating downward pressure.
Momentum Shift: The sharp drop suggests a likely continuation of the bearish trend.

XAU/USD) Bullish trand line analysis Read The ChaptianSMC Trading point update
Technical analysis of Gold Spot (XAUUSD) on the 4-hour timeframe, featuring key support and resistance levels, price action projections, and RSI for momentum evaluation. Here's a breakdown of the idea:
Key Points in the Analysis:
1. Support & Resistance Zones:
Big Support / Buying Zone: Around 3,222 – 3,240. This zone has seen previous bullish reversals and is supported by the 200 EMA.
Intermediate Support Level: Around 3,270–3,290, where price might bounce before attempting a breakout.
Key Resistance Level: Around 3,350–3,365. Price must break this area to move toward higher targets.
2. Price Action Projections:
The analysis shows two bullish potential scenarios:
Scenario 1: Price breaks above the resistance level directly and moves toward the target point at 3,535.83.
Scenario 2: A retracement to the lower support or even the big buying zone before a bullish rally to the same target.
3. RSI (Relative Strength Index):
Currently near the neutral zone (around 49), suggesting there's room for movement in either direction.
No extreme overbought/oversold signals right now.
4. EMA (200):
The price is currently hovering above the 200 EMA (3,222.01), which acts as a long-term support and trend indicator.
Mr SMC Trading point
Summary of the Trading Idea:
Bias: Bullish
Entry Zones: Look for long entries at either the support level (3,270–3,290) or lower buying zone (around 3,222).
Target: 3,435.05 initially, then 3,535.83.
Invalidation: A clear breakdown below the 3,222 support level could invalidate the bullish bias.
Pelas support boost 🚀 analysis follow)

Gold Weekly Technical Analysis As of May 10, 2025, technical analysis for gold (XAU/USD) shows a mixed outlook with bullish and bearish signals.
View the chart for a concise breakdown of gold's current technical outlook:
