GOLD IN PLAY - RISKY ROADS AHEAD BUT GOLD KEEPS SURGINGSymbol - XAUUSD
CMP - 3468
Gold continues to show strength, testing resistance within the established range, with bullish momentum persisting. The price has moved above the flat consolidation line and entered the buying zone, further progress now depends on the actions of the bulls.
The metal is advancing for a second consecutive session, supported by a weakening of US dollar, heightened demand for safe-haven assets, and intensifying geopolitical tensions in the Middle East and Eastern Europe.
Market sentiment remains fragile due to trade-related uncertainties and regional instability across Asia, as investors look ahead to forthcoming Federal Reserve decisions and remarks from Powell.
Gold is currently breaking out of its previous neutral range. Immediate attention is on the 3369 level and nearby resistance at 3381. The macroeconomic environment remains favorable for gold. If bullish positions are maintained above these key thresholds, upward continuation remains likely.
Resistance Levels: 3369, 3381, 3408
Support Levels: 3352, 3330
A potential retest of the local liquidity zone around 3352, possibly triggering a long squeeze, cannot be ruled out prior to a resumed upward move. For now, the focus remains on the 3369–3370 area, which currently serves as a critical support zone.
Goldprediction

Gold Hits 3382 – As Forecasted- Recap (04-05-2025 to 10-05-2025)Gold has successfully reached the 3382 level, aligning perfectly with our previous outlook.
📉 Technical Insight:
Our analysis identified 3382 as a key resistance zone based on Fibonacci extension levels and prior price structure. The move was supported by strong momentum, with price action forming a bullish continuation pattern before the breakout.
📊 Fundamental Drivers:
Gold's rally was fueled by persistent inflation concerns, escalating geopolitical tensions, and increasing central bank purchases — especially amid continued uncertainty in U.S. rate cut timelines. These macro factors strengthened gold's safe-haven appeal.
✅ Result: Market followed the script. Precise analysis — accurate results.

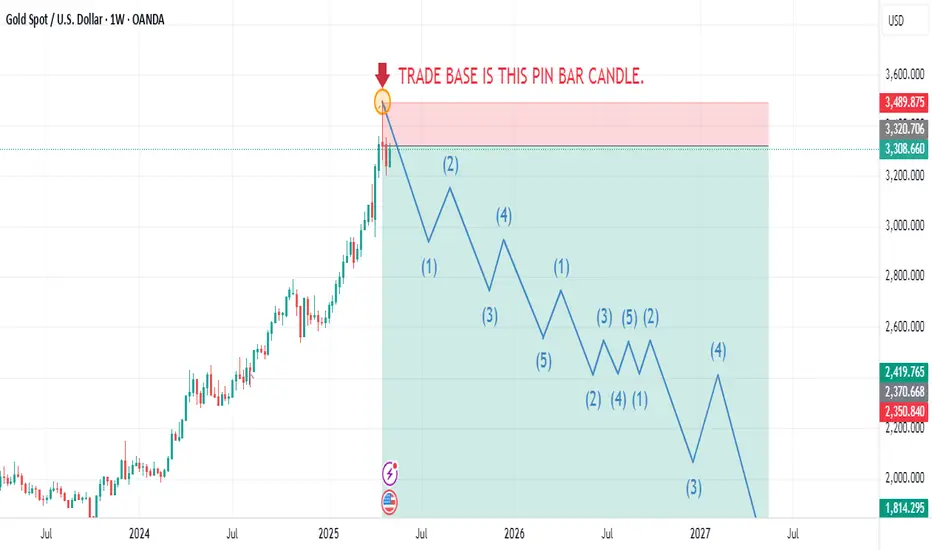
Gold Short Trade Analysis for Swing TradingMarket Overview
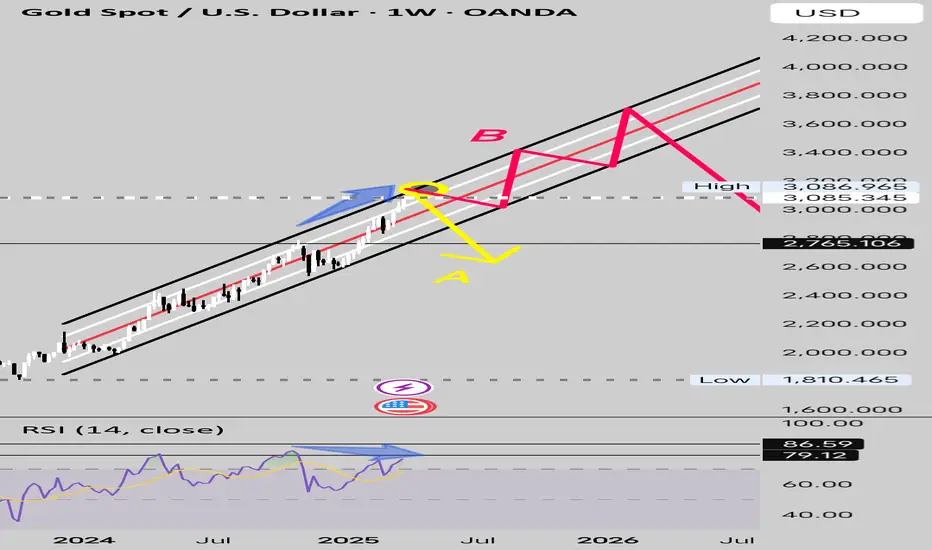
Gold (XAU/USD) has exhibited a bullish rally in recent times, but a recent pin bar formation on the weekly chart signals a potential reversal. With a 95% confidence level based on technical analysis, the market is poised for a significant downturn over the next two years. The current momentum remains slightly bullish, but failure to breach the $3,500.00 resistance level will likely trigger a substantial decline in gold prices, making it an opportune moment for swing traders to consider short positions.
Price Predictions
Based on the provided projections, the following key price levels are anticipated for gold over the next two years:
Mid-July 2025 : Gold prices are expected to peak near $3,000.00, marking a potential high for the year.
Mid-November 2025 : Prices are forecasted to decline to approximately $2,740.00.
End of March 2026 : A further drop is anticipated, with prices reaching around $2,560.00.
End of June 2026 : Gold is expected to form a low around $2,408.00.
June to September 2026 : The market is likely to trade in a range-bound pattern, with no significant directional movement.
End of September 2026 : A breakout from the range is expected, potentially setting the stage for further declines.
End of December 2026 : Gold prices are projected to fall to approximately $2,053.00.
April 2027 : The downtrend is expected to continue, with prices dropping to around $1,814.00.
Technical Analysis
The recent pin bar on the weekly chart is a strong bearish signal, indicating rejection at higher price levels. This suggests that the bullish rally may have exhausted its momentum. The critical resistance level to watch is $3,500.00. If gold fails to break above this level, it will likely confirm the bearish outlook, leading to a sustained decline. The projected price levels align with key support zones, reinforcing the potential for a prolonged downtrend.
Swing Trading Strategy
Swing traders can capitalize on this bearish outlook by initiating short positions at strategic price points. Below is a suggested approach:
Entry Point : Consider entering a short trade near $3,000.00 in mid-July 2025, as prices approach the projected peak. Alternatively, wait for a confirmation of rejection at $3,500.00 if prices rally higher.
Stop Loss : Place a stop loss above $3,500.00 to protect against an unexpected bullish breakout.
Take Profit Levels :
First target : $2,740.00 (mid-November 2025).
Second target : $2,560.00 (end of March 2026).
Long-term target : $2,053.00 (end of December 2026) or $1,814.00 (April 2027).
Position Sizing : Use proper risk management, risking no more than 1-2% of the trading account per trade.
Monitoring : Watch for range-bound movement between June and September 2026, as this may require adjusting positions or temporarily exiting the trade.
Risk Factors
While the bearish outlook is supported by technical signals, traders should remain cautious of the following risks:
Geopolitical Events: Sudden global events could drive safe-haven demand for gold, pushing prices higher.
Economic Data: Changes in interest rates or inflation could influence gold prices unexpectedly .
Market Sentiment: A shift in investor sentiment could delay or alter the projected downtrend.
Conclusion
The formation of a pin bar on the weekly chart, combined with the failure to break $3,500.00, suggests that gold’s bullish rally is likely over. Swing traders can take advantage of the anticipated downtrend by shorting gold at key resistance levels and targeting the projected price declines over the next two years. By employing disciplined risk management and closely monitoring market developments, traders can position themselves for significant returns as gold prices trend lower.
Gold (XAU/USD) 1-Hour Chart: Potential Bullish Reversal SetupOverview:
The market has recently shown a change of character (ChoCh), indicating a shift from a bearish to a potential bullish trend. After reaching key support levels, gold has started to consolidate, and we could be seeing the start of an upward movement.
Key Levels to Watch:
Support Zone: The price has bounced off the support at 3,222.38, which aligns with the 50% Fibonacci retracement.
Resistance Zone: The key resistance is at 3,294.87, which may act as a strong level for profit-taking if the price continues its upward move.
Potential Entry:
Buy Entry: Look for an entry around the current price of 3,240.40, after the price breaks through minor resistance or retraces slightly for confirmation.
Stop Loss: Set your stop loss at 3,222.38 (the recent swing low) for a controlled risk.
Take Profit: Aiming for the next resistance zone at 3,290.00 or 3,300.00.
Risk-to-Reward:
With a stop loss set at 3,222.38 and a take-profit target of 3,290.00, the trade offers a favorable risk-to-reward ratio of 1:2.
Market Sentiment:
The recent change of character suggests that the market may be reversing, so a bullish trend continuation is expected.
Keep an eye on volume and price action to confirm the breakout and ensure the setup is valid.
Trade Management:
Watch for any signs of a breakout at 3,294.87, as it would confirm the uptrend. Adjust your stops if the price moves in your favor.

XAU/USD) Bullish Trade Setup – Targeting $3,506.52 with Entry atEntry Point: $3,221.19
Stop Loss: $3,169.80
Resistance Zone: Around $3,277.98 to $3,280.64
Target (TP) Point: $3,506.52 (Approx. 9.05% upside)
📊 Technical Indicators and Markings:
Moving Averages:
Likely a 50-period (blue) and 200-period (red) moving average.
Price is currently below both MAs, signaling a short-term downtrend.
Support & Resistance Zones:
Strong support around $3,207.67–$3,221.19 (entry area).
Resistance at $3,244.25–$3,280.64.
Stop-loss is strategically placed below support to limit downside risk.
Target Area:
Projected upside target is $3,506.52, with a potential 9.05% gain from the entry.
This is marked as the EA (Expert Advisor) Target Point, possibly suggesting this is a strategy from an automated trading system.
Orange Circles:
Likely indicate swing highs and lows, used to identify trend patterns and potential reversal points.
📈 Trading Idea Summary:
Bullish Setup: Buying at support, aiming for breakout above resistance to reach target.
Risk-Reward Ratio: Favorable, assuming price holds above $3,207.
Watch for Confirmation: Price needs to break above resistance around $3,280 for momentum continuation.

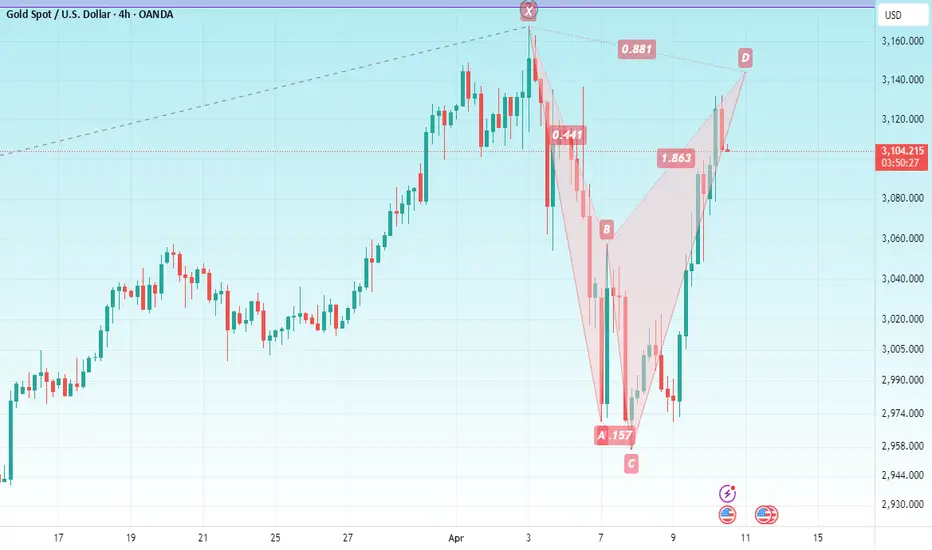
XAU/USD) Bullish reversal analysis Read The ChaptianSMC Trading point update
technical analysis of Gold Spot (XAU/USD) on the 4-hour timeframe, projecting a bullish outlook. Here's a breakdown of the main ideas conveyed:
1. Support Level & Double Bottom
A strong support level is marked around the 3,177 area, with the price bouncing from it twice (highlighted by two black dots), indicating a potential double bottom pattern, which is typically a bullish reversal signal.
2. EMA 200 Support
The 200 EMA (Exponential Moving Average) lies just below the current price (~3,177), acting as dynamic support. The fact that price is holding above it adds strength to the bullish argument.
3. Bullish Divergence on RSI
The RSI (Relative Strength Index) shows a bullish divergence, where the price made lower lows but RSI made higher lows—another potential reversal indicator.
4. Price Projection
If the bullish move plays out, the chart outlines two upward targets:
Target Point: ~3,501.67
Next Target Point: ~3,729.23
These are based on measured moves from previous impulse legs (shown by vertical blue projections).
5. Entry Setup
The chart suggests a break above the short-term consolidation could trigger the bullish run toward the first target, aligning with bullish price structure and support confirmation.
Mr SMC Trading point
---
Overall Idea: The chart expects a bullish reversal from support, confirmed by double bottom, EMA 200 support, and RSI divergence, targeting higher resistance zones.
Pales support boost 🚀 analysis follow)

Gold (XAU/USD) Trade Plan – Daily TimeframeGold ( FXOPEN:XAUUSD ) has finally broken below the lower boundary of the rising channel after a strong bullish rally that peaked above $3,450. Today's bearish candle closed below the trendline support, indicating potential short-term weakness.
🔍 Technical Highlights:
Breakdown from Rising Channel
Price has broken below the lower channel, hinting at a short-term reversal or deeper pullback.
Immediate Support Zones
Watch the horizontal zones around $3,194 and $3,168 – these could act as short-term supports.
Further Downside Targets
If these levels break, next major supports lie at $3,055 and $2,972.
💡 Trade Ideas:
Bearish Bias Below $3,220
Look for short entries if price retests and rejects the lower channel boundary.
Target Levels: $3,168 > $3,055 > $2,972
Invalidation: Daily close back above $3,250 would negate the bearish setup.
⚠️ Risk Management:
Always manage risk with stop-loss orders and proper position sizing. Volatility remains high, so wait for confirmation candles or retests.

Gold at the Edge: Range Compression Signals Brewing Breakdown !Gold (XAU/USD) has entered a critical phase on the daily timeframe, forming a tight range between ~$3,305 and ~$3,330 after a strong bullish rally. This price action resembles a distribution pattern — a phase where smart money offloads positions while retail gets trapped in volatility. Despite repeated intraday bounces, price has failed to break higher, indicating weakening bullish momentum and growing pressure from zones above.
According to price action this rectangular structure just above $3,300 is not just a pause — it’s a coiling range with heavy potential energy. The failure to push above recent highs shows exhaustion, while the support zone at $3,201.11 emerges as a decisive level. If this support gives way, it would confirm a range breakdown with an immediate target of ~$3,100 and a secondary potential target near $2,900 based on prior zones and volume gaps.
From a fundamental lens, the downside risk is justified. U.S. economic data continues to show resilience, which strengthens the dollar and fuels Neutral Fed sentiment. Sticky inflation and a robust labor market are forcing investors to reprice the probability of further rate cuts — delaying the Fed pivot narrative that previously propelled gold upward. On top of that, real yields are rising again, which historically applies downward pressure on non-yielding assets like gold. With trade wars easing off too this is a downwind for gold .
Geopolitical tensions, which previously supported gold’s safe-haven appeal, have shown signs of de-escalation in recent days, weakening bullish flows further. In short, unless a fresh global catalyst emerges, the fundamentals currently align with the bearish technical setup forming on the chart.
Key Level to Watch:
Breakout 3300 targeting 3210-20 sl above 3350
🔵 $3,201.11 — Decision point for bulls to hold and push back OR a trigger for bears to unleash further downside.
⚠️ Break below this level opens doors to 3,100 first and then 2,900 as liquidity unwinds.
Until a clear breakout or breakdown occurs, this range is a trap. Stay sharp and wait for confirmation — because when this range breaks, it won’t be silent.

Gold (XAU/USD) Intraday Buy Setup with High Reward-to-Risk Ratio1. Entry Point Zone: Around 3,271.79 USD
This is identified as a potential buy entry area, marked in purple.
2. Stop Loss: Below the entry point at 3,257.71 USD
Risk management level in case the trade moves against the setup.
3. Target Point One: Between 3,313.75 and 3,317.07 USD
A short-term take-profit level, likely based on previous resistance.
4. Final Target (EA Target Point): Around 3,373.04 USD
A more ambitious take-profit, possibly based on a major resistance level or Fibonacci extension.
5. Trade Range:
Risk: 3,271.79 - 3,257.71 = 14.08 USD
Reward to First Target: ~42 USD

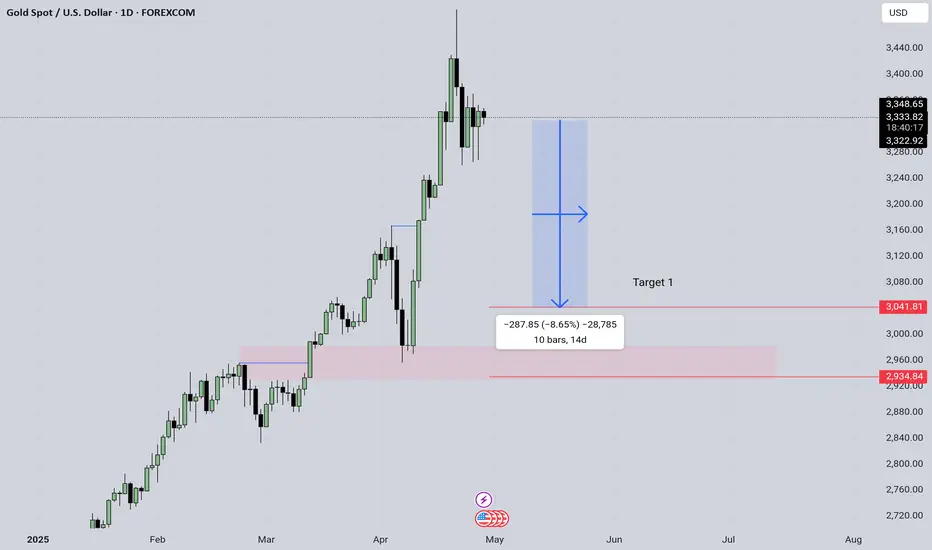
GOLD correction is coming (-8% fall)As per my analysis, gold is consolidating for days.
Even though currency move higher but gold didn't.
Trump tarriffs are cooling down , so gold will fall nearly -8% which is 3050 area.
Maybe it can fall below 3000 dollars per ounce.
Maybe next month dollar index may retrace a bit from the current fall.
So from all this information, I conclude GOLD may fall for couple of weeks.
This is for education purpose only.
Do your own research. Thanks for reading, leave your comment.
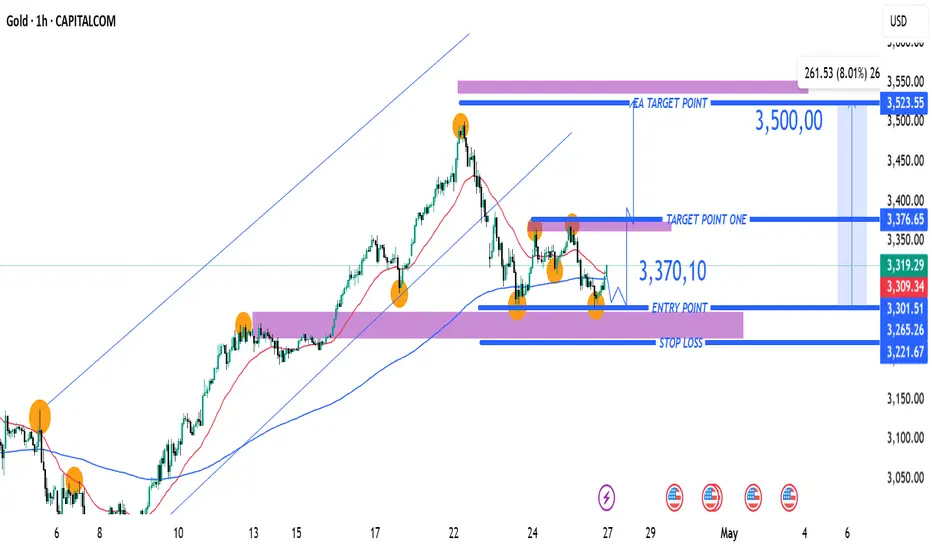
(XAU/USD) 1H Chart: Long Setup Targeting 3,500 with Key SupportEntry Point: Suggested near 3,301.51 USD (marked with the purple support zone).
Stop Loss Zone: Below 3,266.87 to 3,221.67 USD (marked in blue and purple). This is where you limit your loss if the trade goes wrong.
First Target (Target Point One): 3,376.65 USD.
Final Target (EA Target Point): 3,523.55 USD (~8.26% potential gain from entry).
Main Setup Idea:
The price is consolidating around the support zone.
There's a plan to buy (go long) at the purple zone (Entry Point) and aim for the two target points
GOLDHello & welcome to this analysis
GOLD is giving a hourly H&S breakdown suggesting targets of $3134 (Comex) / 91000 (MCX) with a pause near $3190 / 92750

Gold Near The Parallel Channel Resistance. What's Next?Gold has been Trading in the parallel channel ever since the breakout.
Hovering near the Psychological resistance at 3000 with Indicators suggesting Highly Overbought Conditions for Gold.
2 Scenarios are possible.
Scenario A - Gold breaks out of the Parallel Channel and Enters Correction.
Scenario B - Gold Continues its Parallel Channel Uptrend breaking ATH towards 4000.
Technical Analysis suggests that Scenario A is more likely to play out.
Share your Thoughts and Views in the comments section to make this Publication a more Fruitful one.
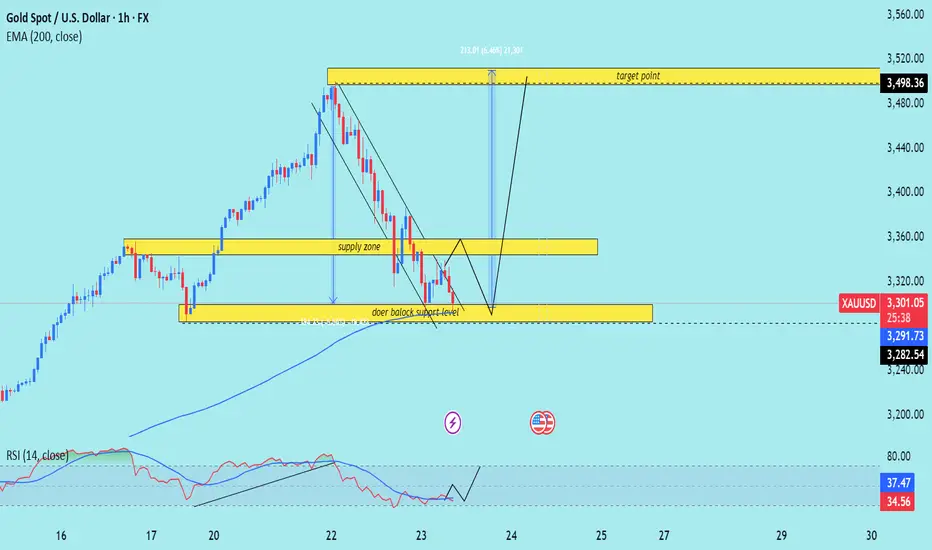
XAU/USD) orderblok key Support Analysis Read The ChaptianSMC Trading point update
technical analysis of Gold Spot against USD (XAUUSD) on the 1-hour timeframe. Here's a breakdown of the key ideas presented:
Chart Analysis Summary:
1. Price Zones:
Supply Zone (Resistance): Around the 3,355–3,365 level.
Demand/Support Zone (Doer Block Support Level): Around 3,282–3,291.
2. Current Price Action:
Price is currently at $3,331.96, close to the supply zone, and bouncing between the zones.
There’s a sharp downtrend, which seems to be slowing down near the support level.
3. Projected Move:
The chart suggests a short-term dip back into the demand/support zone, followed by a bullish reversal.
Target Point: A move back up toward $3,498.36, which is marked as a significant resistance.
4. Technical Indicators:
RSI (Relative Strength Index): Currently around 36.64 and recovering, suggesting potential bullish divergence or an oversold condition.
200 EMA: Around $3,291.52, providing dynamic support — aligning with the lower demand zone.
Mr SMC Trading point
Trade Idea:
Buy Setup (Long Trade):
Entry: Near 3,282–3,291 (support zone).
Target: 3,498.36.
Stop Loss: Below the support zone (~3,270).
Overall Idea:
This is a reversal-based setup. The price is expected to retest the support before launching a bullish leg toward the target. The confluence of the EMA, support zone, and RSI near oversold adds weight to the potential for a bounce.
Pelas support boost 🚀 analysis follow)
GOLD / SILVER SPREADSHello & welcome to this analysis
GOLD/SILVER (COMEX) ratio charts has done 1.62 Fibonacci of its Inverse Head & Shoulder breakout.
It has immediate parallel channel resistance near 109, if it breaks above it then next resistance is at 118 where it has a Bearish Harmonic Bat.
Current support is at 102, below that it could test the breakout level at 92

GOLD’S IN OVERDRIVE - MISSED THE TRAIN? WAIT FOR THE NEXT STOP!Symbol - XAUUSD
CMP - 3330
Gold remains in a strong upward trend, consistently reaching new all-time highs. Entering a rapidly advancing market without sufficient opportunity to assess risk is inadvisable. Therefore, engaging in the current momentum without a confirmed technical setup is not recommended. A potential price correction ahead of upcoming US retail sales data and a speech by Federal Reserve Chair Jerome Powell may provide a more favorable environment to identify trading opportunities.
The rally is being driven by several fundamental factors, including robust economic data from China, increased demand for safe-haven assets amid escalating geopolitical tensions, and trade uncertainties between the US and China. Further upward momentum is being supported by ANZ’s revised forecast, which projects gold prices could reach $3,600 by year-end.
From a technical standpoint, the psychological resistance zone between $3330 and $3350 is of particular interest, where a pullback may be expected. The preferred strategy would be to await a correction toward local or intermediate support levels before considering long positions.
Key Resistance Levels: 3330, 3350
Key Support Level: 3275, 3265, 3244
Given the strength of the prevailing bullish trend, breakout strategies above resistance levels may be effective. However, such an approach requires clear price consolidation, which is not currently present. Alternatively, a more prudent strategy would be to wait for a retracement, a confirmation of support, and then consider initiating long positions.

XAU/ USD) bullish trend analysis Read The ChaptianSMC Trading point update
analysis for XAUUSD (Gold vs. USD) on the 2-hour timeframe appears to suggest a bullish continuation setup after a correction. Here's a breakdown of the idea:
Key Points from the Chart:
1. Rising Channel:
The price is moving within an ascending channel.
After a breakout and strong rally, it is currently in a flag or wedge-like correction pattern.
2. Correction Zone:
The price is consolidating downward inside a small descending wedge (a bullish pattern), potentially forming a bull flag.
This is typically a sign of continuation after a strong upward impulse.
3. Support Zone:
A 4H support level is marked around 3,301.416, which aligns with the lower boundary of the flag pattern.
This is a potential buy zone for price to react and bounce.
4. Target Point:
The target is projected at 3,404.254, implying a breakout to the upside if the support holds.
5. RSI Indicator:
RSI is currently around 65, with previous values near 80, suggesting a slight cooldown but still in bullish territory.
A slight drop in RSI might occur before the next bounce.
6. EMA 200:
The EMA 200 is well below current price (around 3,137), indicating a strong bullish trend.
Mr SMC Trading point
Possible Trade Idea:
Entry: Around the 3,301–3,305 support area.
Confirmation: Wait for a bullish reversal pattern (engulfing candle or strong bounce).
Target: Around 3,404 (as per the marked target zone).
Stop Loss: Below the support zone (e.g., below 3,295), depending on risk tolerance.
Pales support boost 🚀 analysis follow)

Gold (XAUUSD) Trade Setup: Bullish Breakout Toward $3,637 TargeCurrent Price: $3,309.18
EMA 30 (Red Line): $3,265.00
EMA 200 (Blue Line): $3,163.35
Trend Direction: Strong uptrend (price above both EMAs)
Timeframe: 1-hour (short-term analysis)
📍 Key Levels
Entry Point: Around $3,266.63 (just above EMA 30)
Stop Loss: Around $3,265.00
Target (EA Target Point): $3,637.23
Potential Profit: +$365.01 or +11.16%
🔍 Technical Patterns & Zones
Rising Channel: Price is moving within a rising wedge or channel, indicating bullish momentum but with narrowing range — a potential reversal signal if broken.
Support Zone: Highlighted purple box around the entry point; likely a demand zone.
Resistance Zone: $3,637.23 area marked as the EA Target Point — previous resistance or Fibonacci extension level.
✅ Bullish Signals
Price is consistently making higher highs and higher lows.
EMAs are aligned in a bullish formation (short EMA above long EMA).
Clear breakout above consolidation range recently.
Trade setup shows favorable risk-to-reward ratio.
⚠️ Risks / Caution
Rising wedge can sometimes break down — watch for volume drop or divergence.
Potential pullback to the entry zone is expected (indicated by the arrow).
News Events: Symbols below the chart indicate upcoming USD economic data, which could bring volatility.
📈 Strategy Summary
Buy on pullback to $3,266.63 with tight stop at $3,265.00.
Target: $3,637.23 — potential 11% gain.
Risk: Minimal if stop is respected, tight stop-loss.

GOLD: XAUUSD a clear picture and strategyAlthough we can see a divergence in prices and RSI but imo it shall make another "new high" till $3281.50
If price rejects teh Immediate resistance and starts to retrace, T1, T2 and T2 viz., 3168, 3145 and 3135 are the downside targets of retracement.
Till 3135, if retracement finds the support, it will again for for higher targets and will continue the rally.
If not, prices will fall till 3075sh level of support trendline.

GOLD (XAUUSD) 15-Min Chart – Bearish Reversal Setup with Key EntPrice: $3,232.02 (at time of chart)
Trend: Price is consolidating near a resistance area after an upward move, with potential for a reversal.
🔍 Key Technical Levels
📈 Entry Point: $3,241.88
(Marked for a potential short entry)
🔻 EA Target Point (Take Profit): $3,187.70
This is the target for the short position; aligns with a strong previous demand zone and near the 200 EMA.
⛔ Stop Loss Zone: Above $3,243.48
Purple zone indicates the invalidation area for the short trade.
📉 Resistance Point: $3,229.87
(Red line, also the 30 EMA) – Important level where price is currently hovering.
🔵 Confirm Target Points: $3,223.04 & $3,218.25
Zones to watch for confirmation of downward momentum.
📘 EMA (30): $3,229.87
Acts as short-term dynamic resistance.
📘 EMA (200): $3,182.40
Acts as major support and long-term trend indicator. Also very close to the target area.
💡 Trade Idea Summary
Strategy: Short (Sell) from the resistance/entry point around $3,241.88.
Target: $3,187.70
Stop Loss: Above $3,243.48
Risk-Reward Ratio: Solid (approx. 1:2+ based on visual range)
🔎 Additional Notes
Price is testing resistance after forming a potential double top or lower high.
A breakdown below $3,223 could confirm bearish continuation.
Watch for confirmation candles on 15m or 1h before entering

Gold can go Down anytime soon#gold CAPITALCOM:GOLD very soon Wave B to be Completed will come down in Wave C, safe traders wait until for confirmation i.e. it needs to break 3117 level, then good to enter for sell trade.

Gold Long Term Neowave ForecastHello Everyone
FX:XAUUSD In this we are going to talk about gold in detail
## As long as we are above 2771, gold will bullish till May-June. But to confirm this we will need to wait for 2 or 3 more weeks, so buy in parts.
## Inner stucture is in correction of traditional ABC structure and still in developing phase. But i have remove them so that who dont understand neowave wont be confused.
## Apart from this i am adding Live link for fast updates. so if you have any query. Kindly leave a comment. I will be happy to guide you further more.
Live Link- in.tradingview.com

GOLDHello & welcome to this analysis
GOLD (Comex) 4hrs is going to enter the potential reversal zone of a bearish Harmonic Shark pattern between $3135 - $3155. Pattern negates above $3167.
Probable retracement levels $3100 / $ 3075 / $3025 / 2950
If it sustains above $3170-$3200 it gets v strong and will attempt $3300