Gold (XAU/USD) Intraday Buy Setup – Demand Zone Reversal with 3.Timeframe: Appears to be intraday (possibly 5-15 minutes).
Indicators:
EMA 30 (red): Showing recent bearish momentum.
EMA 200 (blue): Positioned above, indicating a longer-term bearish trend.
Candlestick Pattern: After a steep drop, price shows signs of consolidation and potential reversal.
📌 Trade Setup (Long/Bullish Bias)
Entry Zone: Around $2,963.2
Price is expected to pull back into this purple demand zone before moving up.
Stop Loss (SL): $2,956.1
Placed below the support zone to limit downside risk.
Take Profit (TP / Target Point): $2,988.2
A previous supply zone near the EMA 30, where selling pressure could return.
📊 Risk-Reward Ratio
Risk: $2,963.2 - $2,956.1 = $7.1
Reward: $2,988.2 - $2,963.2 = $25
RRR (Reward-to-Risk Ratio): ~3.5:1
This is a solid ratio, suggesting a high-potential trade if the setup plays out.
📈 Bullish Scenario
Price pulls back into the demand zone (entry).
A bullish candlestick confirmation or wick rejection could trigger a buy.
Target is the previous structure + EMA zone.
Goldprediction
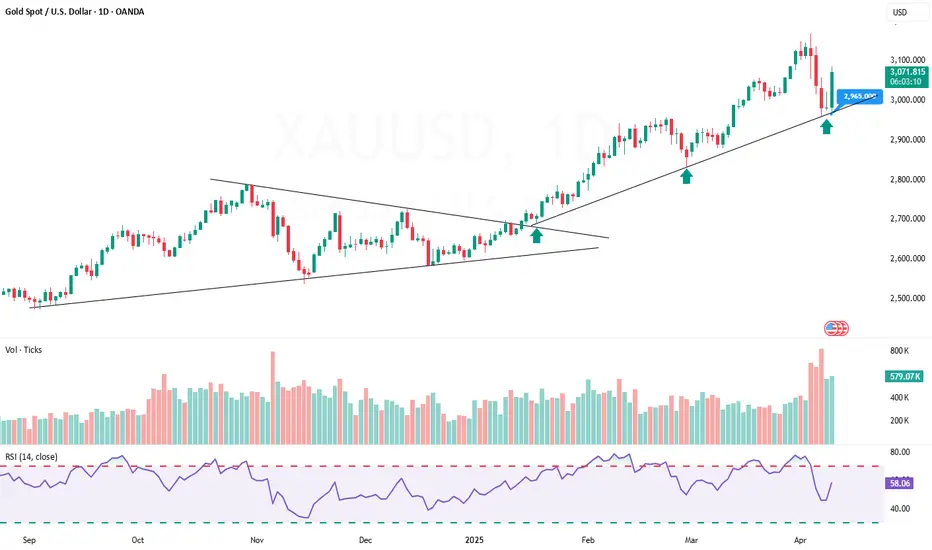
GOLD COMEX OUTLOOK FOR APRIL MONTHGOLDCMX:
Gold Comex (SPOT) is trading in Uptrend, as from the chart above you can see Trendline formation and Exact around trendline Gold Comex on 7th April 2025 took Support around 2950- 2956 $. Till Gold Comex is holding above trendline one should Not short sell gold and continue to hold Gold on the Long side.
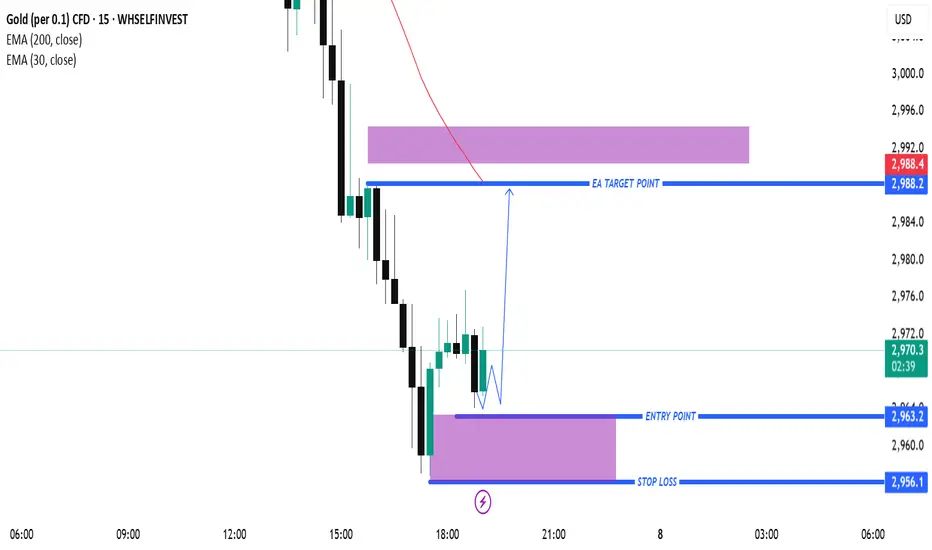
Gold (XAUUSD) Reversal Setup: Buy Opportunity from Demand Zone t GOLD (XAUUSD)
Timeframe: 30-minute
Indicators:
EMA 30 (Red): 3,000.22
EMA 200 (Blue): 3,042.92
🔍 Price Action & Zones
Current Price: 2,982.27
Support Zone (Demand Zone): ~2,940.27 (highlighted in purple, labeled as STOP LOSS)
Resistance Zone (Supply Zone): ~3,040.17–3,042.92 (labeled as EA TARGET POINT)
📈 Trade Idea (Based on Drawing)
Strategy: Buy from demand zone, targeting supply zone
Entry: Near 2,940.27
Stop Loss: Slightly below 2,940.27
Target: ~3,040.17
Risk to Reward: ~1:2.6 (visually)
📊 EMA Dynamics
Bearish Bias in the Medium Term: Price is trading below the 200 EMA, indicating an overall bearish trend.
Short-Term Weakness: The price has also dropped below the 30 EMA, confirming bearish momentum in the short run.
🔄 Possible Scenario
Price is currently heading back down toward the demand zone, where a bounce is anticipated.
If it respects that zone, we may see a reversal toward the target zone at ~3,040.
If it breaks below 2,940, the setup would be invalidated (stop loss hit).
⚠️ Things to Watch
Rejection or support confirmation at 2,940 zone is key before entry.
Be cautious of continued bearish momentum if economic news or global risk sentiment shifts.
Look for bullish reversal patterns (e.g. hammer, bullish engulfing) at the demand zone for confirmation.

Gold Next Target 2800 and What Next Trump's tariffs?🔍 Chart Context (1H and 15M Combined View)
Trend: Bearish overall structure on the 1H timeframe, with lower highs and lower lows.
Trendline: Clearly respected and just recently tested again (price rejected at the trendline on 1H).
POI (Point of Interest): 3,030 – 3,040 zone acting as a strong supply/resistance zone.
📈 Support Levels:
2,978.949 (key demand/support zone).
2,956.129 (major support level).
📉 Resistance Zones:
✅3,020 area (15M minor supply zone, shaded red).
✅3,030–3,040 (POI level on 1H, shaded blue).
✅3,058.437 (major resistance).
🧠 Price Action Insights-1H Chart:
Price attempted to break the descending trendline but was quickly rejected (marked with a circle).
Multiple rejections from POI level suggest strong seller presence.
Strong bearish candle followed that rejection (confirmation of trend continuation).
15M Chart:
Price bounced from support at 2,978
Quick rally back to ~3,004, stalling below the minor supply at 3,020.
Could be forming a lower high (ideal short setup zone).
📌 Trade Setup Idea:
✅ Trade Type: Short (Sell)
🔽 Entry Zones (Sell Limit Ideas):
Aggressive: 3,020 (near the 15M minor supply zone)
Conservative: 3,030–3,040 (POI level on 1H chart)
🛑 Stop Loss:
Above 3,045 (well above POI and trendline breakout level)
🎯 Targets:
TP1: 2,978.949 (recent support, also previous bounce level)
TP2: 2,956.129 (major support level from 1H chart)
TP3 (Optional Swing): Below 2,950 if momentum continues
⚠️ Risk Management Tip (Beginner-Friendly):
Use position sizing based on your risk appetite (e.g., 1–2% of your account per trade).
Avoid entering late if price already breaks past POI or trendline with strong volume.
📌 Key Beginner Takeaways:
You're identifying liquidity zones, trendlines, and structure: excellent progress!
Use confluence (multiple factors aligning) to enter with higher probability.
Practice this setup in a demo account to gain confidence.
👉 Always follow TP/SL to protect your capital and maximize profits!
Disclaimer: This is for educational purposes only.
Always trade responsibly and manage your risk effectively

XAU/USD) Bearish trand analysis Read The ChaptianSMC Trading point update
This chart analysis is for Gold Spot (XAU/USD) on the 1-hour timeframe. Here’s a breakdown of the idea shown:
---
Key Points in the Analysis:
1. Current Price:
XAU/USD is around $2,982.92 at the time of the chart.
2. Trend:
The chart suggests a bearish outlook.
Price has been consistently rejected from the yellow supply zone (around 3,020–3,033).
EMA 200 (blue line) is above the current price, confirming downward momentum.
3. Rejection Zone:
Marked in yellow between 3,020 and 3,033. Labeled as “Reject points”.
Price failed to break above this zone multiple times.
4. Breakout Pattern:
Two descending rectangles highlight bearish continuation patterns.
A bearish flag or wedge is visible, followed by a breakout downward.
5. Target Zone:
Highlighted in yellow between 2,900 and 2,921, with target point at 2,920.615.
Price is expected to move down to this level.
6. RSI (Relative Strength Index):
RSI is declining and shows bearish divergence, supporting downside move.
Currently around 39.19, which is closer to oversold territory but still has room to drop.
Mr SMC Trading point
---
Trade Idea Summary:
Bias: Bearish
Entry Area: Rejection near 3,020–3,033 zone
Target: 2,920.615 (highlighted support zone)
Stop Loss: Could be placed above 3,033 (supply zone or EMA 200)
Confluence Factors:
EMA 200 rejection
Bearish RSI divergence
Repeated supply rejection
Breakout from bear flag structures
Pales support boost 🚀 analysis follow)

XAU/USD) bearish rejected fvg analysis Read The ChaptianSMC Trading point update
This chart analysis of Gold (XAU/USD) on the 2-hour timeframe appears to be a bearish setup based on Smart Money Concepts (SMC). Here's a breakdown
Key Elements:
1. Price Channel Break & CHoCH:
The price was in a rising channel.
A clear Change of Character (CHoCH) occurred after the price broke below the structure, signaling a shift from bullish to bearish.
2. Fair Value Gap (FVG):
There's a bearish Fair Value Gap (FVG) highlighted in the yellow box around the 3,047–3,075 level.
The expectation is that price may retrace into this FVG before continuing downward.
Mr SMC Trading point
3. Target Zone:
A major demand zone or target point is marked around 2,940, indicating a potential bearish move of around -148 points (~4.8%) from the FVG.
4. EMA & RSI:
200 EMA is around 3,047, acting as dynamic resistance now.
RSI is below 40 and trending down, showing bearish momentum with slight bullish divergence, hinting at a short retracement before another drop.
---
Summary of the Idea:
Bias: Bearish
Trade Plan:
Wait for price to retrace into the FVG zone (~3,047–3,075).
Look for bearish confirmation (like bearish engulfing or rejections).
Enter short with a target at 2,940, stop above FVG.
Pales support boost 🚀 analysis follow)

Gold 08 april morning trade explanationHello
It's a jayesh balar.
If you have a any "Questions"
Ask me in comment
If my analysis is helpful,
press booster bottom.

GOLD FACES MAJOR PULLBACK: WILL IT BOUNCE BACK OR BREAK DOWN?Symbol - XAUUSD
CMP - 3032
Gold is currently undergoing a significant liquidation phase, primarily driven by profit taking following last week's favorable market news. The market sentiment has been further pressured by the robust Non-Farm Payroll (NFP) report released on Friday. The economic risk landscape is showing signs of divergence.
Following a decline in the Asian trading session, gold prices have rebounded, consolidating the earlier drop precipitated by the escalating trade tensions between the United States and China. Comments from Trump rejecting potential trade deals with China have heightened recession concerns, which, in turn, have increased expectations of a potential Federal Reserve rate cut.
In this environment, gold has gained traction as a safe-haven asset, even amid rising dollar strength and climbing bond yields. However, the sustainability of gold's upward momentum remains uncertain due to ongoing profit-taking and the absence of new economic data from the United States.
From a technical perspective, gold is consolidating under pressure near the support levels of 3017-3013, with a descending triangle pattern forming on the local timeframe.
Resistance Levels: 3033, 3057
Support Levels: 3017, 3013, 2981
Given the current market dynamics and the strong pressure exerted on prices, two scenarios appear plausible:
A breakdown below the support range of 3017-3013, should the descending triangle structure on the local timeframe persist. In this case, the next targets for support are 3000 and 2981
Alternatively, the price could consolidate within the range, with potential targets of 3057, 3033, and 3013, reflecting a phase of consolidation following the sharp decline and liquidation.

GOLD (XAUUSD) 30-Min Chart Analysis – Key Reversal & Breakout Zo200 EMA (blue): 3085.72 (bearish as price is below it)
30 EMA (red): 3033.52
Current Price: 3034.10
🟪 Key Zones (Highlighted in Purple)
Resistance Zone: Around 3045.54–3065.70
Support Zone: Around 2968.27
Previous High Zone / Target Area: 3158.42
📉 Short Trade Setup (Blue Arrow Going Down)
Entry Area: If price rejects the resistance zone around 3045–3065
Stop Loss: Above the zone, around 3065.70
Take Profit: At the support zone, 2968.27
Risk-to-Reward: Approx. 2.4x (shown as -2.43%)
📈 Long Trade Setup (Blue Arrow Going Up)
Entry Area: If price breaks and holds above the 3065.70 zone
Stop Loss: Below 3045.54 zone
Take Profit: 3158.42 (previous resistance)
Risk-to-Reward: Approx. 3.0x (shown as 3.00%)
💡 Analysis Summary
Price is currently ranging just below the resistance zone.
Two possible scenarios:
Rejection from the zone → short entry.
Breakout above zone → long opportunity.
Use EMA alignment for confirmation:
Bearish if price stays below both EMAs.
Bullish if price breaks above 200 EMA (3085.72).

XAUUSD Next Move 2800 ? 🪙 FUNDAMENTALS:
✅China on Friday struck back at the U.S tariffs imposed by Trump with a slew of counter-measures including extra levies of 34% on all U.S. goods and export curbs on some rare-earths, deepening the trade war between the world's two biggest economies.
✅ More than 50 nations have reached out to the White House to begin trade talks since Trump rolled out sweeping new tariffs, top officials said on Sunday as they defended levies that wiped out nearly $6 trillion in value from U.S. stocks last week.
✅ Federal Reserve Chairman Jerome Powell said tariffs increased the risk of higher inflation and slower growth, highlighting the difficult path ahead for policymakers at the U.S. central bank
________________________________________
🔍 4H Hour Timeframe Analysis
📊 Trend & Price Action :
• Previous Trend: Clear uptrend inside a rising channel (marked by red lines).
• Recent Price Movement: Price broke down below the ascending channel, signaling trend weakness or possible reversal.
• Strong bearish candles show increased selling pressure recently.
📉 Key Technical Levels:
• Support Zone: Around $2,979–$2,957 (green and grey lines) — price bounced here, showing buyer interest.
• Resistance Zone: Around $3,057–$3,077 — a previous support zone now acting as resistance after the breakdown.
• Moving Averages:
o Red Line (likely 50 EMA): Recently broken down, now acting as dynamic resistance.
o Blue Line (likely 200 EMA): Around $2,990, price tested and bounced — this is often a key support in a trend.
🧠 Interpretation:
• Price broke structure (channel and EMAs), signaling a shift from bullish to bearish bias.
• The bounce from the 200 EMA and support zone suggests a potential short-term retracement or consolidation.
• If price fails to reclaim $3,057–$3,077, sellers may re-enter.
________________________________________
🔍 15-Minute Timeframe Analysis
📊 Trend & Price Action:
• Sharp intraday recovery from the low of around $2,957 to the current $3,033.
• But price is now facing resistance from a supply zone (highlighted in red).
• You’ve marked an Order Block (OB) around $3,125–$3,140 — a zone where institutional selling might have started.
📉 Key Levels:
• Resistance Zones:
o $3,076 (blue line) – likely 200 EMA, strong resistance.
o $3,057–$3,076 – supply area and previous breakdown zone.
o Order Block (OB) near $3,125–$3,140 – strong institutional resistance zone.
• Support Zones:
o $3,000, $2,978, and $2,957 – these are lower supports where price previously bounced.
🧠 Interpretation:
• Short-term, the price is retracing from a heavy drop.
• Watch how price behaves at $3,057–$3,076:
o Rejection = possible short setup.
o Break & close above = retracement could continue toward OB ($3,125).
• The OB is a potential reversal zone, where price could get heavily rejected if tested.
________________________________________
📌 Beginner Takeaways:
Trend is weakening – the uptrend broke, and the market is forming lower highs and lower lows.
Price is trying to recover from key support zones but facing resistance overhead.
Volume is increasing near support — shows interest from buyers but not a confirmed trend reversal yet.
The Order Block is a great place to watch for reversal trades (supply zone = potential sell).
________________________________________
✅ Suggested Actions for Practice:
Mark key support/resistance zones on your own chart to develop your structure-reading skills.
Scenario 1: Short if price rejects at $3,057–$3,076 zone.
Scenario 2: Long only if price closes above $3,077 and holds support.
Observe how price behaves near moving averages and OB zones
.
________________________________________
👉 Always follow TP/SL to protect your capital and maximize profits!
Disclaimer: This is for educational purposes only.
Always trade responsibly and manage your risk effectively

This chart shows a potential bullish setup for Gold (XAUUSD) on This chart shows a potential bullish setup for Gold (XAUUSD) on the 15-minute timeframe, with some key technical elements and a projected trade idea. Here's a breakdown of the analysis:
1. Current Market Overview
Price: Trading around $3,038.51.
Trend: Recent downtrend followed by a minor recovery.
Indicators:
EMA 200 (Blue): Currently at $3,090.41, acting as a dynamic resistance.
EMA 30 (Red): Positioned below the EMA 200, indicating a still bearish trend but with potential for a pullback.
2. Key Zones & Labels
Limit Entry Zone: Highlighted around $3,025.72 (bottom purple zone)
Labeled as “LIMIT ENTRY”, indicating a potential buy entry.
This area corresponds with a fair value gap (fvg) — often used in smart money concepts as a sign of institutional interest.
Target Zone: Around $3,082.22 (top purple zone)
Labeled as “target point EA”.
Lies just below the EMA 200 resistance level, which is a likely take-profit area for a bullish move.
3. Projected Price Action
A possible bullish retracement is anticipated:
Dip into the limit entry/fvg zone at ~$3,025.
Then, a rally targeting the $3,082 zone, possibly extending toward the EMA 200 at ~$3,090.
4. Trade Setup (Based on the Chart)
Entry: Around $3,025.72 (limit buy)
Target: Between $3,082.22 - $3,090.41
Risk: Likely below the FVG zone (~$3,015–$3,020), depending on risk appetite.

Gold (XAU/USD) Technical Analysis: SMC Trading point update
This chart is a technical analysis of Gold (XAU/USD) on a 4-hour timeframe. Here’s a breakdown
1. Ascending Channel:
The price is moving within an upward channel, showing a bullish trend.
Higher highs and higher lows confirm the uptrend.
2. Support and Resistance Zones:
Yellow Boxes: Key support zones where price previously consolidated before moving higher.
Red Arrows: Marking resistance zones where the price faced rejection.
Green Arrows: Indicating support levels where the price bounced.
3. Current Price Action:
Price recently dropped to a key support zone (around $3,050).
A bullish reaction is expected from this level.
If support holds, the price may continue the uptrend toward the target of $3,186.
4. Projected Move:
The black zigzag line suggests a potential bounce from support.
If the support level holds, price could move back up within the channel.
Mr SMC Trading point
Conclusion:
If price respects the support zone, there could be a good buying opportunity.
A break below the support zone would signal potential bearish movement.
Monitoring price action around the yellow zone is crucial for confirming direction.
Pales support boost 🚀 analysis follow )

Gold (XAU/USD) Technical Analysis: Key Resistance Test Before BrThis chart represents a Gold (XAU/USD) 30-minute timeframe analysis from TradingView. Here are the key takeaways:
Technical Indicators & Levels
Exponential Moving Averages (EMAs)
200 EMA (Blue Line): 3,110.97 – A long-term trend indicator.
30 EMA (Red Line): 3,134.65 – A short-term trend indicator.
Key Levels
Resistance Point: Around 3,136.56.
Support Zone (Stop Loss Level): 3,103.16.
Target Point: 3,167.44, indicating a potential 1.62% upside.
Potential Trade Setup
Scenario 1 (Bullish Case):
If price breaks above resistance (3,136.56) and holds, the next target is 3,167.44.
A bullish breakout could indicate further momentum.
Scenario 2 (Bearish Case):
If price fails to break resistance and drops, it could test the support zone around 3,103.16.
A break below this level might lead to further downside.
Pattern Analysis:
The chart suggests a potential retest of resistance before a breakout.
A possible accumulation phase before a strong move.
Conclusion
Bullish above 3,136.56, targeting 3,167.44.
Bearish below 3,103.16, watching for downside risk.
The 200 EMA (3,110.97) could act as dynamic support.

Gold Hits Another Record II U.S. Tariff Plan II Daily Analysis🔥 Fundamental Analysis :
⚡Gold rose to $3,164 per ounce, a new record high as risk aversion increased following President Trump's tariff announcement.
⚡Trump outlined a 10% baseline tariff on imports from all countries, with higher rates for nations with trade surpluses, including China (34%), the EU (20%), and Japan (24%), and a 25% tariff on foreign-made automobiles.
⚡ All eyes are on the U.S. non-farm payrolls report, due Friday, for further clues on the Federal Reserve's monetary policy path.
Technical Analysis:
1. New All-Time High:
The price reached 3,168 USD, marking a new all-time high.
However, the price has slightly retraced after hitting this level.
2. Fibonacci Levels:
• 1st Fib Level: 3,183 USD – Potential resistance.
• 2nd Fib Level: 3,206 USD – Further resistance if the bullish momentum continues.
3. Support & Resistance Zones:
• Green Zone (~3,135 - 3,138 USD): Previously a resistance, now acting as support.
• Another support near 3,124 USD.
• Resistance Levels:
• 3,168 USD: (All-time high) – If broken, could push the price towards the Fibonacci targets.
4. Moving Averages:
• Red Line (Likely 50 EMA): Trending upwards, supporting price action.
• Blue Line (Likely 200 EMA): Positioned lower, indicating that the trend remains bullish as long as price stays above.
5. Trend Analysis:
• Bullish Breakout: The price broke out of a previous range and surged to a new high.
• Potential Retest: Price might revisit the 3,135 - 3,138 support zone before another leg up.
Trading Considerations:
• Bullish Case: If price consolidates above 3,135-3,138, it could retest 3,168 and move towards 3,183 or 3,206.
• Bearish Case: A break below 3,135 could push price back towards 3,124 or lower.
• Risk Management: Place stop losses below key support zones if entering long positions.
👉 Always follow TP/SL to protect your capital and maximize profits!
Stay tuned for updates once the confirmations are in place!
Please support me with your likes and comments to motivate me to share more analysis with you and share your opinion about the possible trend of this chart with me !
📢Best Regards , Silver Wolf Traders Community
Disclaimer: This is for educational purposes only.
Always trade responsibly and manage your risk effectively

Gold (XAUUSD) 30-Minute Trade Setup: Bullish Reversal from SuppoThis chart represents a trading analysis for Gold (XAUUSD) on a 30-minute timeframe. Here are the key points from the chart:
Technical Indicators:
EMA (30, close) - Red Line: 3,124.52 (shorter-term trend)
EMA (200, close) - Blue Line: 3,090.41 (longer-term trend)
Trade Setup:
Entry Point: 3,108.21
Stop Loss: 3,098.52 (just below the support zone)
Target Point: 3,149.04 (potential profit level)
Analysis:
The price is currently bouncing from a purple support zone, which aligns with a short-term retracement.
The 30 EMA (red) is currently above the price, indicating short-term resistance.
The 200 EMA (blue) is significantly lower, showing that the overall trend is still bullish.
A potential long (buy) trade is suggested, as price is expected to reverse from the support level towards the target point of 3,149.04.
Risk-to-Reward Ratio:
The stop loss is set below the key support level to minimize risk.
The target price provides a significant profit potential.
Conclusion:
If price holds above 3,108.21, there is a strong bullish case.
If price breaks below 3,098.52, the bullish setup may become invalid.
Monitoring the 30 EMA resistance will be crucial for confirmation.

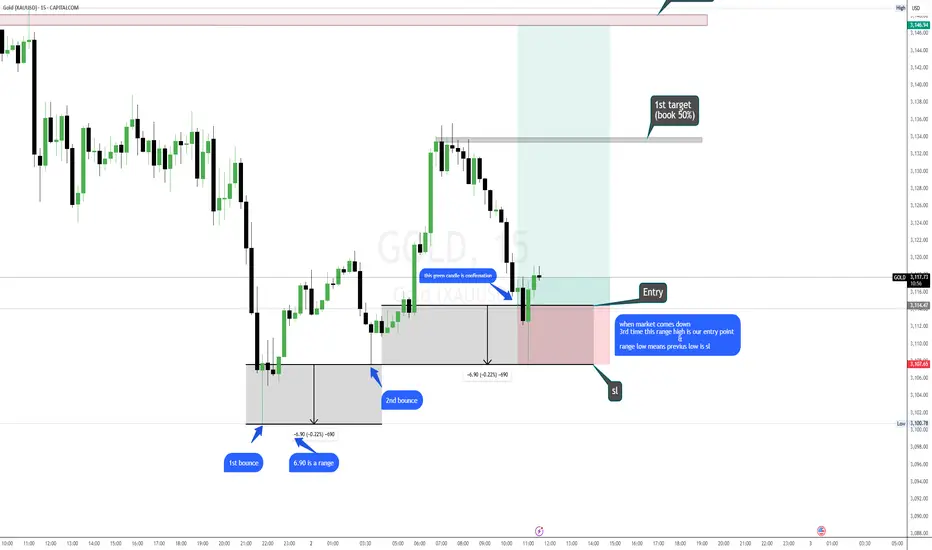
Gold view on 02 april (entry model explain in description)Hello
It's a jayesh balar.
in this entry model requirement in uptrend 2 lover high and down trend 2 highr low
in uptrend when market create 2 lover high then mark this two low and and find this gap range and then copy this range apd past 2nd low when market comes down next time touch this range high point and show some rejection you can enter and range low point is your SL same as a down trend.
(This model interesting point is this give unlimited time entry this model only failed when market try to shifting trend)
And my English was so bad so i know this description is not that much good so if you doubt anything you can comment your questions
If you have a any "Questions"
Ask me in comment
Gold (XAUUSD) Bullish Trade Setup: Demand Zone Entry & Target PrThis is a gold (XAUUSD) trading chart from TradingView, showing a technical analysis setup on the 1-hour timeframe.
Key Observations:
Uptrend: The chart shows a strong bullish trend, with price making higher highs and higher lows.
Demand Zone (Entry Point):
A highlighted yellow zone around $3,121.38 indicates a demand area where price is expected to bounce.
This could be a support level or a key order block.
Stop Loss: Placed at $3,112.40, below the demand zone, to minimize risk in case the trade fails.
Target Point:
Set at $3,177.94, which is 1.69% above the entry point.
The expected reward is 52.77 points.
Risk-Reward Ratio: This setup follows a risk-reward strategy, aiming for a potential gain significantly higher than the risk taken.
Trading Strategy:
If the price retraces into the demand zone, a long position (buy) is expected.
A bounce from this zone could lead to a price surge towards the target.
If price falls below the stop-loss level, the trade is invalidated.
Conclusion:
This is a bullish setup relying on a pullback to a key support zone before continuation. Traders may monitor price action in the yellow zone for confirmation before entering a trade

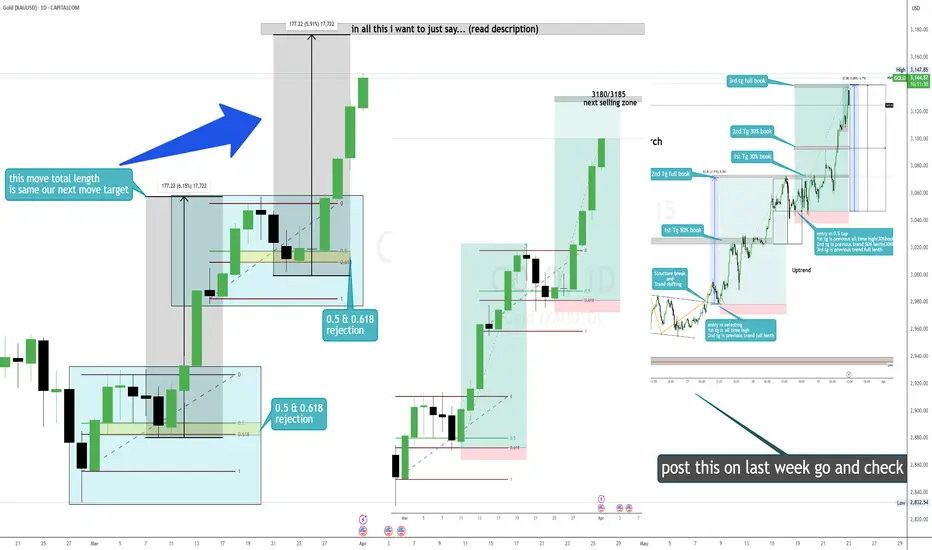
My gold target is 3177/3183 because(read description)Hello
It's a jayesh balar.
(this was not only i tell you after this happen i tell you this 3 4 days ago and gave a trade and all trade hit target)
my gold next target is 3177/3183 because if you see gold chart in 1day time frame in this bullish trend gold 25 to 28 feb trying to go down but its not happen and then you see next move 3 to 5 march move and consider as a swing and put fib and see market got rejection on 0.5/0.618 level and gave 177 point up move.
so as of you all know "MARKET ALLWAYS REPEAT HISTORY"
in this up trend next 14 to 19 march consider as a swing and put fib you see market still got rejection on 0.5/0.618 level so in this time our next target same as previous trade total move.
i am just trying to tell anyone say anything don't believe market is still bullish and continue his up trend so go with flow and grab this opportunities.
If you have a any "Questions"
Ask me in comment
If my analysis is helpful,
press booster bottom.
Gold (XAUUSD) 15-Minute Chart Analysis: Bullish Setup with Key SGold (XAUUSD) 15-Minute Chart Analysis
Key Technical Indicators:
Current Price: $3,122.28
30 EMA (Red Line): $3,115.90 (Short-term trend indicator)
200 EMA (Blue Line): $3,081.17 (Long-term trend indicator)
Support Zone: Around $3,106.62
Target Point: $3,154.02
Analysis:
Trend:
The price is in an uptrend, as it is trading above both the 30 EMA and 200 EMA.
The 30 EMA is acting as dynamic support, showing strong buying interest at pullbacks.
Key Levels:
Support: $3,106.62 (marked in blue) is expected to hold as a key support level.
Resistance Zone (Previous Supply Area): Around $3,090-$3,100 (shaded purple) was previously a resistance zone but has now turned into support.
Target Level: $3,154.02 is the expected bullish target if the price respects the support zone.
Trade Setup:
Bullish Scenario: The price may pull back to the support zone (~$3,106.62) before bouncing higher towards the target.
Stop Loss: Below $3,106.62 to minimize risk.
Entry Point: A retest of the support area with bullish confirmation could provide an optimal entry for a long trade.
Risk Management:
Stop Loss: Set just below the support zone.
Reward-to-Risk Ratio: Favorable if targeting $3,154.02 with a stop at $3,106.62.
Conclusion:
The chart suggests a bullish outlook, with price expected to continue its upward momentum if support holds.
A breakout above $3,123 could further confirm bullish strength.
Caution: If the price breaks below $3,106, further downside movement toward the 200 EMA ($3,081.17) is possible.

Next Gold Move To 3500 ?📰 Fundametal news:
Key points:
⚡Gold hits record high at $3,128.06
⚡Trump expected to announce reciprocal tariffs on April 2
⚡Silver, platinum, palladium set for monthly gains
Trump is expected to announce reciprocal tariffs on April 2, while automobile tariffs will take effect on April 3
🚨 Technical Analysis
4-Hour Chart Analysis
Trend: Strong bullish channel (marked by red trendlines).
📈 Support Levels:
3,057 (key level in case of correction).
3,007 (next major support below).
📉 Resistance Levels:
🔸Upper boundary of the bullish channel near 3,140-3,150.
The price is respecting the trend channel.
🔸If gold remains inside this channel, it may continue rising towards the upper boundary (around 3,140-3,150).
🔸A breakdown of the channel could signal a correction.
1-Hour Chart Analysis
🔸Trend: Strong bullish momentum with a new all-time high at 3,127.962.
📈 Support Levels:
🔸3,057 (previous resistance turned support).
🔸2,999 (major historical support).
📉 Resistance Levels:
🔸No historical resistance beyond the all-time high, meaning price discovery mode.
🔸Gold is in a price discovery phase after breaking above previous highs.
🔸A possible pullback to 3,057 could provide a buying opportunity if bullish momentum continues.
15-Minute Chart Analysis
Trend: Short-term uptrend but facing resistance near 3,128.
📈 Support Levels:
🔸Minor support at 3,109 (highlighted blue zone).
🔸50 EMA (red line) acting as dynamic support.
📉 Resistance Levels:
💡3,128 is a strong resistance level where price is struggling to break out.
🔸The price gapped up and continued its bullish momentum.
🔸The price is hovering above support, indicating potential consolidation before another move.
Overall Trading Plan & Strategy:
Bullish Scenario:
🔸If price breaks 3,128 with strong momentum, we could see 3,140+ in the short term.
🔸Pullback to 3,109-3,057 could provide a buying opportunity if it holds support.
Bearish Scenario:
🔸If gold fails to hold 3,109, a drop to 3,057 or even 3,007 could be expected.
🔸Breaking below the trend channel would signal a deeper correction.
💡 Conclusion: The trend is bullish, but resistance at 3,128 needs to be broken for further upside. Watch for support at 3,109 and 3,057 for potential buy opportunities.
👉 Always follow TP/SL to protect your capital and maximize profits!
Stay tuned for updates once the confirmations are in place!
Please support me with your likes and comments to motivate me to share more analysis with you and share your opinion about the possible trend of this chart with me !
📢 Best Regards , Silver Wolf Traders Community
Disclaimer: This is for educational purposes only.
Always trade responsibly and manage your risk effectively

gold viewHello
It's a jayesh balar.
If you have a any "Questions"
Ask me in comment
If my analysis is helpful,
press booster bottom.

gold analysis all target hitt(check previous post)Hello
It's a jayesh balar.
If you have a any "Questions"
Ask me in comment
If my analysis is helpful,
press booster bottom.
GOLD – Unshaken Through Chaos - 50 new all-time highs🟡 GOLD – Unshaken Through Chaos | A Structural Bull Run Backed by Global Repricing
Gold isn’t just rallying — it’s sending a message.
Over the past 12 months, gold has set over 50 new all-time highs, a breakout sequence unmatched in over a decade. This is now officially the longest bullish streak in 12 years, and the third longest in modern history, only behind the volatile 1979–1980 period — a time when the global economy was grappling with runaway inflation, stagnant growth, and widespread unemployment.
But what makes this current bull cycle unique is not just the price action, but the structural shift behind the move.
📈 The Numbers Speak for Themselves:
YTD 2024 performance: +16%
12-month gain: +39%
Price range: From ~$1,200 to nearly $1,600/oz
3rd consecutive bullish year
These gains are not speculative pumps — they are a response to systemic instability. The macro backdrop is screaming uncertainty:
Sticky, structural inflation
Slowing global economic growth
Real interest rates still hovering around zero or negative
Geopolitical risk escalating in nearly every region of the world
This isn’t a short squeeze. It’s a capital migration.
🏦 The Central Bank Bid: The Silent Giant
What separates this rally from past cycles is who’s buying.
Unlike the 2011 gold run — driven heavily by retail FOMO and speculative ETF flows — today’s surge is institutionally anchored.
The strongest force in the current trend? Central banks.
Led by China, Russia, Turkey, and several BRICS nations, central banks have been accumulating gold at a record pace, shifting reserves away from USD exposure and hedging long-term geopolitical and economic risks. This isn't just diversification — it's a statement of monetary sovereignty.
Their consistent demand is forming a strong floor under price, insulating gold from violent retracements even during short-term corrections.
🔍 The Psychology of this Bull Market
This isn’t the kind of rally that fades on CPI noise.
The capital flow is defensive, not aggressive.
Funds are rotating into gold not to chase yield, but to preserve value. In times when fiat devaluation, sovereign debt instability, and political fragmentation are on the rise — gold doesn’t just shine, it leads.
The market is re-pricing systemic risk.
Investors are no longer reacting to inflation headlines. They are positioning for longer-term fragility in global monetary policy. That’s why even when inflation prints soften temporarily, gold still holds ground.
📌 What Comes Next?
Yes, technically, a pullback is healthy — even expected.
Extended breakouts are often followed by short-term consolidations. But the medium- to long-term structure remains intact.
Gold is not in a bubble. It’s in rotation.
In a world full of uncertainty, inflation volatility, and central bank crossfire — gold remains the most trusted asset for capital protection. And this rally? It’s not the end of something.
It’s just the beginning of a new monetary cycle.
— AD | Money Market Flow
📢 Join our community of serious traders.
Let’s grow, learn, and win together inside the MMFlow Trading Channel.
Tap in and be part of the flow.
