GOLD H1 – Will Retail Sales Trigger Gold’s Next Big Move?🟡 XAUUSD – Intraday Smart Money Plan | by Ryan_TitanTrader (17/11)
📈 Market Context
Gold is trading inside a corrective phase as markets anticipate today’s U.S. Retail Sales data and several Fed speeches — both crucial for assessing whether inflation momentum is slowing or rebounding.
• Weak retail numbers may hint at cooling consumer strength, supporting safe-haven bids in gold.
• Strong data could revive USD demand, prompting sell-side setups from premium zones.
Institutional flows show engineered pushes into inefficiency before a directional leg unfolds.
🔎 Technical Analysis (1H / SMC Structure)
• Structure: Gold is forming a short-term accumulation at the discount range after consecutive bearish candles and a deep liquidity sweep below 4030.
• FVG Sell Zone: 4140–4138 aligns with an unmitigated FVG + internal liquidity — ideal for sell-side reactions.
• Discount Zone: 4008–4010 is the last clean demand zone + sweep area, matching the chart’s projected bullish inducement.
• Liquidity:
→ Buy-side liquidity rests above 4140.
→ Sell-side liquidity remains exposed near 4000–3995.
🔴 Sell Setup (Premium Reaction Zone)
• Entry: 4,140 – 4,138
• Stop-Loss: 4,150
• Take-Profit Targets:
→ 4,095 (intra-day imbalance fill)
→ 4,060 (previous BOS block)
→ 4,010 (discount accumulation area)
📌 Trade only after a liquidity sweep into FVG + bearish BOS on M5–M15.
🟢 Buy Setup (Discount Reaction Zone)
• Entry: 4,010 – 4,008
• Stop-Loss: 4,000
• Take-Profit Targets:
→ 4,060 (short-term structure high)
→ 4,095 (mid-range inefficiency)
→ 4,138 (final premium reaction zone)
📌 Valid if price sweeps 4008 and shows bullish BOS + displacement.
⚠️ Risk Management Notes
• Expect volatility during the U.S. Retail Sales release.
• Avoid chasing price inside the 4060–4100 chop region.
• Lock profits at each liquidity level and trail stops.
• Keep total risk under 1–2% per setup.
📝 Summary
Gold remains in a engineered pullback phase with clear liquidity pockets at both extremes.
• Sell Zone: 4140–4138 (FVG / premium reaction zone)
• Buy Zone: 4008–4010 (discount accumulation zone)
A clean manipulation–reaction–continuation pattern is likely before the next intraday move.
📍 Follow @Ryan_TitanTrader for more Smart Money updates ⚡
Check out my TradingView profile for special gifts 🎁
Goldprediction

Gold/XAUSSD weekly analysis and possible sell/buy scenarios....Currently gold is showing pressure and generating sell signals. There are multiple sell opportunities developed in Gold in different time frames. And we can anticipate couple of opportunities out of these will trigger. Gold has already created CISD on HTF and tested daily FVG and changed delivery and showing down fall in price. There is already one sell scenario executed. And we can see few more in coming week.
1. Price has already changed delivery in daily time frame and tasted daily FVG and price is falling now.
2. Currently price is holding at daily FVG and we may see slight pull back around the levels of 424152 & 4205 and then further fall till ~3888 level.
3. We can see another higher probability sell scenario at 4300 level if aforementioned levels are breached.
4. RSI is also showing sell side pressure, giving another confluence.
5. Most probably price will take liquidity of FVG/RDRB level and create MSS/CISD/TS/iFVG in LTF.
6. Price should show rejection/reversal in respective LTF (1h/15m) at FVG zone.
7. Take the trade only once clear entry model i.e. turtle soup. iFVG break, CDS or MSS happens on LTF
All these combinations are signalling a high probability and ~10R trade scenario.
Note – if you liked this analysis, please boost the idea so that other can also get benefit of it.
Also follow me for notification for incoming ideas.
Also Feel free to comment if you have any input to share.
Join me on live stream for real time update.
Disclaimer: This analysis is for educational purposes only and does not constitute investment advice. Please do your own research (DYOR) and check with your financial advisor before making any trading decisions.

BTC Weekly analysis and sell/Buy scenarios....BTC moved as per our plan throughout last week more than 13K points so far, and still in down trend. Price is continuously creating BOSs and moving toward our target of 90K. Meanwhile during sniper delivery, it has created some pull back zones, which can be tested before reaching to our target. So we have few possible multi RnR trades scenarios before seeing possible reversal.
1. Sniper deliver is already done and price is pulling back slowly.
2. We may see possible pullback sell trade opportunity around 100K and 103.5k levels.
3. RSI is also showing sell side pressure, giving another confluence.
4. Most probably price will take liquidity of FVG/RDRB level and create MSS/CISD/TS/iFVG in LTF.
5. Price should show rejection/reversal in respective LTF (5m/15m) at FVG zone.
6. Take the trade only once clear entry model i.e. turtle soup. iFVG break, CDS or MSS happens on LTF
All these combinations are signalling a high probability and ~7R trade scenario.
Note – if you liked this analysis, please boost the idea so that other can also get benefit of it.
Also follow me for notification for incoming ideas.
Also Feel free to comment if you have any input to share.
Disclaimer: This analysis is for educational purposes only and does not constitute investment advice. Please do your own research (DYOR) and check with your financial advisor before making any trading decisions.

GOLD H1 – Gold Reacts to Mixed U.S. Inflation Data🟡 XAUUSD – Intraday Smart Money Plan | by Ryan_TitanTrader (14/11)
📈 Market Context
Gold continues to trade within a balanced range as investors digest the latest U.S. inflation data. The CPI report showed cooling price pressures, while producer prices (PPI) are due soon — both shaping market sentiment toward the Fed’s December rate outlook.
• Softer inflation supports a bullish bias if gold holds the discount zone.
• Renewed USD strength could trigger short setups from premium liquidity zones.
Institutional flows suggest engineered liquidity hunts before a decisive move resumes.
🔎 Technical Analysis (1H / SMC Structure)
• Structure: Gold remains in a short-term bullish correction after a strong sell-off, with recent ChoCH signaling a possible re-accumulation phase.
• Premium Zone: 4300–4298 aligns with a previous unmitigated supply and internal liquidity — ideal for sell-side reactions.
• Discount Zone: 4144–4142 overlaps with the last bullish OB and EMA100 area — a potential demand zone for continuation.
• Liquidity: Resting buy-side liquidity sits above 4300, while inducement below 4140 could lure early longs before true accumulation.
🔴 Sell Setup (Premium Reaction Zone)
• Entry: 4,300 – 4,298
• Stop-Loss: 4,310
• Take-Profit Targets:
→ 4,178 (previous BOS zone)
→ 4,144 (discount retest)
→ 4,110 (deep liquidity pocket)
📌 Valid only after a liquidity sweep and bearish BOS confirmation on M5–M15.
🟢 Buy Setup (Discount Reaction Zone)
• Entry: 4,144 – 4,142
• Stop-Loss: 4,135
• Take-Profit Targets:
→ 4,185 (minor structure high)
→ 4,210 (liquidity void fill)
→ 4,300 (final premium reaction zone)
📌 Valid if price reclaims structure with bullish BOS confirmation.
⚠️ Risk Management Notes
• Stay patient until U.S. PPI data confirms direction.
• Avoid trades between 4175–4250 (low R/R consolidation area).
• Scale out partials near liquidity pools and trail stops after confirmation.
• Maintain disciplined risk exposure under 2%.
Summary
Gold is in an engineered equilibrium phase — liquidity pools are forming at both extremes.
• Sell zone: 4300–4298 (premium reaction zone)
• Buy zone: 4144–4142 (discount accumulation zone)
Expect manipulation around mid-range levels before a clean directional move unfolds.
📍Follow @Ryan_TitanTrader for more Smart Money updates ⚡

Gold H1 – Gold Awaits U.S. PPI Data After 5-Wave Completion🟡 XAUUSD – Elliott Wave Intraday Outlook | 14/11
📈 Elliott Wave Context
Gold has completed a textbook 5-wave impulsive rally, peaking near 4250 before entering a corrective phase. The current retracement appears to be forming an ABC correction, with price now approaching the C-wave completion zone around 4145–4147.
Today’s focus shifts to the upcoming U.S. Producer Price Index (PPI) report — a crucial inflation indicator that may influence Fed policy expectations and short-term dollar momentum.
• A hotter PPI print could strengthen USD and trigger a brief sell-off from premium zones.
• A softer reading could weaken USD and fuel a renewed push from discount levels.
🔎 Wave Structure Breakdown (H1)
• Wave 1 → Initial breakout from liquidity trap (~4070).
• Wave 2 → Shallow retracement, respecting prior OB.
• Wave 3 → Strong extension into new highs (~4220+).
• Wave 4 → Sideways correction with internal liquidity grab.
• Wave 5 → Final push to ~4250 — marking potential top.
Now the market is tracing an A–B–C corrective structure, with wave C expected to finalize near the BUY ZONE 4145–4147 (SL 4138) before the next bullish leg resumes.
Intraday Trade Zones (Elliott-Based)
🟩 BUY ZONE: 4145 – 4147 | SL 4138
Looking for completion of wave C and bullish reversal confirmation (BOS or mitigation from demand block).
Targets: 4205 → 4230 → 4250
🟥 SELL ZONE: 4245 – 4243 | SL 4252
Scalp opportunity aligning with potential wave B retest or short-term overextension before larger correction.
Targets: 4180 → 4150
📌 Summary
Gold remains technically bullish after completing a 5-wave structure but is currently digesting gains through a corrective ABC phase. The 4145–4147 discount zone serves as a high-probability wave C completion area, especially if PPI data softens USD momentum.
Wait for structure confirmation before entering, and monitor the PPI release as it may dictate whether gold extends higher or deepens its correction.

HOW MANY BUYER TRAPS BEFORE NEW ATH GOLD ?📈 Analysis of Gold Trading Plan (SMC/Order Flow)
🔍 Current Market Context
Structure: The market has shown a strong bullish trend, marked by a Break of Structure (BOS) and a Liquidity Done Sweep around the ₹4,145 price level.
Liquidity:
The market performed a "First Sweep Here" (initial liquidity grab) after the rally, signaling a readiness for a correction.
The main liquidity target for the upward move (Big Boy Liquidity) is set above the ₹4,240 level.
Recent Price Action: After hitting the peak and the initial sweep, the price experienced a sharp decline, creating a correction zone.
🎯 Proposed Trading Plan
The plan focuses on two main scenarios: a Short-term Sell (SELL SCALP) and a Primary Buy (BUY GOLD).
1. Primary Buy Scenario (BUY GOLD)
This is the main scenario to continue the bullish trend (Long).
Entry Zone: BUY GOLD 4126 - 4124.
This zone is likely a critical Order Block or an unmitigated Demand Zone, positioned just below the previous liquidity sweep and acting as a strong support/Displaced/Fair Value Gap (FVG) area.
Stop Loss (SL): SL 4120.
This stop-loss level protects the long position, placed just below the key entry zone to avoid being shaken out by minor liquidity grabs.
The indicated Stoploss Buyer area (around ₹4,145 - ₹4,150) suggests the price drop might aim to sweep prior buyers' liquidity before bouncing from the ₹4,124 - ₹4,126 zone.
Take Profit (TP): The ultimate target is the Liquidity Limit Big Boy (above ₹4,240).
2. Short-term Sell Scenario (SELL SCALP)
This is a short-term trading opportunity (Scalping) during the corrective move.
Entry Zone: SELL SCALP 4208 - 4210.
This area likely represents a Supply Zone or a bearish Order Block following the sharp drop, where hidden selling pressure resides.
Stop Loss (SL): SL 4212.
This is a very tight stop loss, placed just above the entry zone.
Take Profit (TP): The target is the BUY GOLD 4126 - 4124 area (the primary buy entry zone).
⚠️ Key Considerations
Timeline: This plan requires the price to move according to the predicted scenario (drop to the buy zone before rallying).
Confirmation: Traders should wait for structural confirmation on a lower timeframe (e.g., a Change of Character - CHoCH or a bullish BOS) at the 4126 - 4124 buy zone before entering the trade to improve the probability of success.
Risk Management: Using the suggested Stop Loss (SL) is mandatory for capital protection.

GOLD H1 – Gold Awaits U.S. PPI Data for Directional Clarity🟡 XAUUSD – Intraday Smart Money Plan | by Ryan_TitanTrader (13/11)
📈 Market Context
Gold is consolidating after a strong impulsive leg, with intraday traders now focused on the upcoming U.S. Producer Price Index (PPI) release — a key inflation metric that often shapes Fed expectations.
• A hot PPI reading could strengthen the USD and trigger a sell-off from premium levels.
• A softer print may weaken the dollar, encouraging another liquidity grab above 4250.
Institutional order flow shows potential for engineered liquidity sweeps around both extremes before the next directional push.
🔎 Technical Analysis (1H / SMC Structure)
• Structure: Still bullish overall, but showing early distribution near the 4250 handle.
• Premium Zone: 4255–4253 aligns with an unmitigated supply and prior buy-side liquidity pool — a prime short setup if price reacts after a liquidity sweep.
• Discount Zone: 4168–4166 sits within the recent FVG and above EMA100 — a valid area for re-accumulation and continuation if price corrects deeper.
• Liquidity: Equal highs at 4255 and lows near 4156 signal potential stop-hunt traps before a decisive move.
🔴 Sell Setup (Premium Reaction Zone)
• Entry: 4,255 – 4,253
• Stop-Loss: 4,265
• Take-Profit Targets:
→ 4,182 (previous BOS zone)
→ 4,148 (mid-range equilibrium)
→ 4,110 (discount reaction zone)
📌 Valid only if price sweeps buy-side liquidity and confirms bearish BOS on M5–M15.
🟢 Buy Setup (Discount Reaction Zone)
• Entry: 4,166 – 4,168
• Stop-Loss: 4,156
• Take-Profit Targets:
→ 4,210 (short-term liquidity pocket)
→ 4,248 (imbalance fill zone)
→ 4,255 (final liquidity target)
📌 Valid only if price mitigates the FVG and reclaims structure with bullish BOS confirmation.
⚠️ Risk Management Notes
• Wait for PPI volatility before entering trades.
• Avoid trading mid-range (4180–4210) – low R/R zone.
• Scale out partials near liquidity points and trail stops post-confirmation.
• Maintain disciplined risk: 1–2% max per setup.
Summary
Gold is in pre-news equilibrium, with both buy- and sell-side liquidity pools clearly defined:
• Sell zone: 4255–4253 (premium reaction area)
• Buy zone: 4168–4166 (discount re-entry area)
Expect engineered liquidity grabs before a decisive move — patience and structure confirmation remain key.
📍Follow @Ryan_TitanTrader for real-time Smart Money updates ⚡

GOLD H1 – Awaiting CPI Data for Next Big Move🟡 XAUUSD – Intraday Smart Money Plan | by Ryan_TitanTrader (12/11)
📈 Market Context
Gold remains in a controlled retracement phase after a strong impulsive leg last week. The market is now consolidating within a defined 1H range, showing clear reactions near short-term EMAs as traders await today’s U.S. CPI release, a key driver of intraday volatility.
• A higher-than-expected CPI could reignite USD strength and push gold toward the discount zone.
• A softer CPI print may trigger a renewed push into the premium zone, inviting liquidity grabs above 4200.
Institutional flows remain balanced between short-term profit-taking and position building ahead of the inflation print, suggesting engineered liquidity sweeps before the real move unfolds.
🔎 Technical Analysis (1H / SMC Style)
• Structure: Market structure is still bullish but showing distribution signs at the top of the range.
• Premium Zone: 4201–4199 aligns with unmitigated supply — a prime area for potential sell-side reaction if CPI sparks a bullish liquidity sweep.
• Discount Zone: 4083–4081 overlaps with the 0.618 Fibonacci retracement and sits just above EMA100 — an ideal re-accumulation area for institutional buys.
• Liquidity: Equal lows near 4080 and equal highs near 4200 make both sides vulnerable to engineered stop-hunts before direction is confirmed.
🔴 Sell Setup (Premium Reaction Zone)
• Entry: 4,201 – 4,199
• Stop-Loss: 4,210
• Take-Profit Targets:
→ 4,140 (first liquidity pocket)
→ 4,102 (mid-range equilibrium)
→ 4,083 (discount zone confluence)
📌 Only valid if CPI causes a liquidity sweep into premium, followed by M5–M15 bearish BOS confirmation.
🟢 Buy Setup (Discount Reaction Zone)
• Entry: 4,081 – 4,083
• Stop-Loss: 4,074
• Take-Profit Targets:
→ 4,102
→ 4,140
→ 4,199
📌 Only valid if price sweeps 4080 liquidity and reclaims structure with bullish BOS on M15 timeframe.
⚠️ Risk Management Notes
• Wait for CPI-induced volatility before executing any setup.
• Avoid mid-range trades between 4100–4140 — this is equilibrium noise.
• Reduce size pre-news; volatility spikes can trigger premature stops.
• Scale partials at each liquidity pocket and trail stop-losses accordingly.
✅ Summary
Gold is consolidating ahead of CPI, with dual liquidity zones clearly defined:
• Sell zone: 4201–4199 (premium reaction area)
• Buy zone: 4083–4081 (discount re-entry area)
The market is likely to hunt one side of liquidity before revealing true intent. Traders should remain patient, trade from extremes, and align entries with confirmed structure shifts.
FOLLOW @Ryan_TitanTrader for real-time SMC updates ⚡

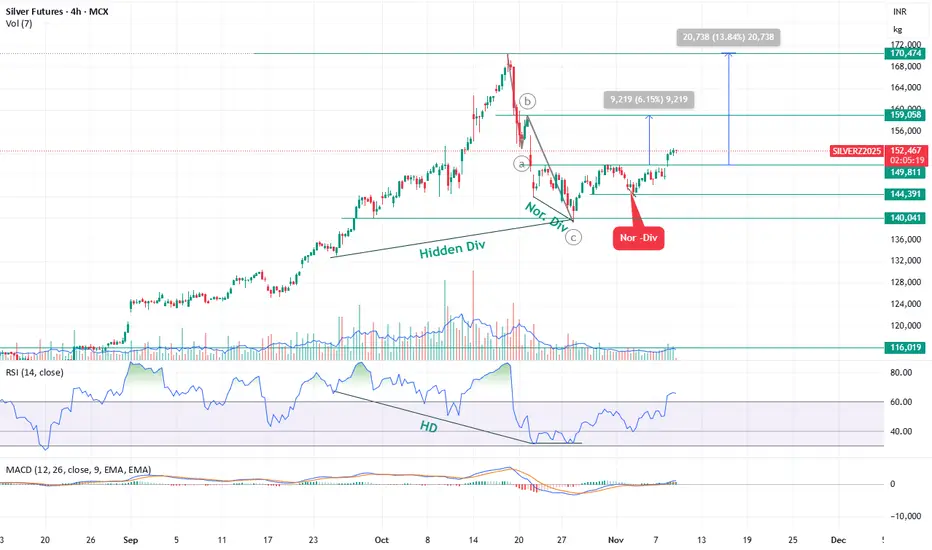
Bullish — Silver bounce expected toward ₹1,59,000 and ₹1,72,000 Silver Futures (SILVERZ2025 – 4H Chart) Technical Outlook
Elliott Wave Structure & Current Setup
Silver is currently trading in Wave 4, and the corrective phase appears to be complete.
Silver has completed its Wave 4 correction and has started a new impulsive leg (Wave 5).
A breakout above ₹1,50,000 has confirmed bullish momentum, supported by RSI and MACD signals.
📈 Upside Targets:
₹1,59,000 – first resistance / 6% upside
₹1,72,000 – extended target / 13.5% upside
⚙️ Supports:
₹1,49,000 – near breakout retest zone
₹1,44,000 – wave 4 base, invalidation below this level
Gold H1 – 5-Wave Complete Amid Fed Rate Hopes & Dollar Rebound🟡 XAUUSD – Elliott Wave Intraday Outlook | 12/11 | by Ryan_TitanTrader
📈 Elliott Wave Context
Gold appears to have completed a clear 5-wave impulsive advance on the H1 chart, with wave 5 reaching into the premium zone around 4,149–4,151. Concurrently, macro news is supporting bullion: weaker US labour data and rising expectations of a Federal Reserve rate cut have bolstered safe-haven flows.
Now price is retracing from the highs, suggesting that a classic corrective ABC sequence may be forming.
🔎 Technical Breakdown (Wave Structure)
• Wave 1: Initiation rally from ~3,965
• Wave 2: Shallow pull-back to near ~4,000
• Wave 3: Strong impulse past ~4,080 → extended
• Wave 4: Controlled correction holding trend-line support
• Wave 5: Final push topping near ~4,149–4,151 (SELL ZONE)
With the 5-wave impulse complete, the market is likely shifting into:
Wave A → bear leg
Wave B → corrective rebound
Wave C → deeper decline
📉 Expected Elliott Wave Path (ABC)
Wave A projection:
• Likely break below the 2-4 trend-line
• First reaction zone: ~4,081 (Fibonacci 0.382)
• Main downside target: ~4,059 (BUY ZONE)
Wave B projection:
• Corrective rebound toward either ~4,108 or ~4,149 (upper premium)
Wave C projection:
• Key downside targets:
o ~4,037 (Fibo 0.618)
o ~4,025–4,010 (trend-line support)
Wave C often equals Wave A in length → aligns with ~4,059 zone for potential cycle end.
Intraday Trade Plan (Elliott-based)
Scenario 1 – SELL the corrective wave (A–B–C)
Preferred strategy given completed impulse.
Entry: After H1 candle breaks below 2-4 trend-line, or on Wave B retest into ~4,149–4,151 (SELL ZONE)
Stop Loss: Above wave-5 high: ~4,155
Take Profit zones:
• TP1: ~4,081
• TP2: ~4,059
• TP3: ~4,037
Scenario 2 – BUY only if correction invalidates
If gold refuses to break the 2-4 trend-line and pushes above ~4,155 → wave 5 may extend.
Entry: Above ~4,155
SL: ~4,149
TP: ~4,175–4,200
📌 Summary
For 12/11, gold has completed a textbook 5-wave impulse and is now ripe for a corrective ABC pattern. With macro forces (Fed rate-cut expectations, weaker dollar) providing backdrop, the highest-probability trade is to sell the Wave B retest and ride Wave C toward deeper support near ~4,059. Stay patient, let the structure confirm the impulse → correction transition before committing.

BTC 8R Sell scenario.........BTC is in downtrend in daily timeframe and shown sniper delivery, now it is in pullback mode. We may anticipate a good short term trade on hourly time frame around hourly FVG
1. HTF MSS is already done and price is reverting to FVG after BOS.
2. Daily quadrant cluster is also falling around FVG. Which is giving us some more critical levels of price reversal.
3. RSI has already shown bearish divergence on hourly TF.
4. Most probably price will take liquidity of FVG and create MSS/CISD/TS/iFVG in LTF.
5. Price should show rejection/reversal in respective LTF (5m/15m) at FVG zone.
6. Take the trade only once clear entry model i.e. turtle soup. iFVG break, CDS or MSS happens on LTF
All these combinations are signalling a high probability and ~8R trade scenario.
Note – if you liked this analysis, please boost the idea so that other can also get benefit of it.
Also follow me for notification for incoming ideas.
Also Feel free to comment if you have any input to share.
Disclaimer – This analysis is just for education purpose not any trading suggestion. Please take the trade at your own risk and with the discussion with your financial advisor.

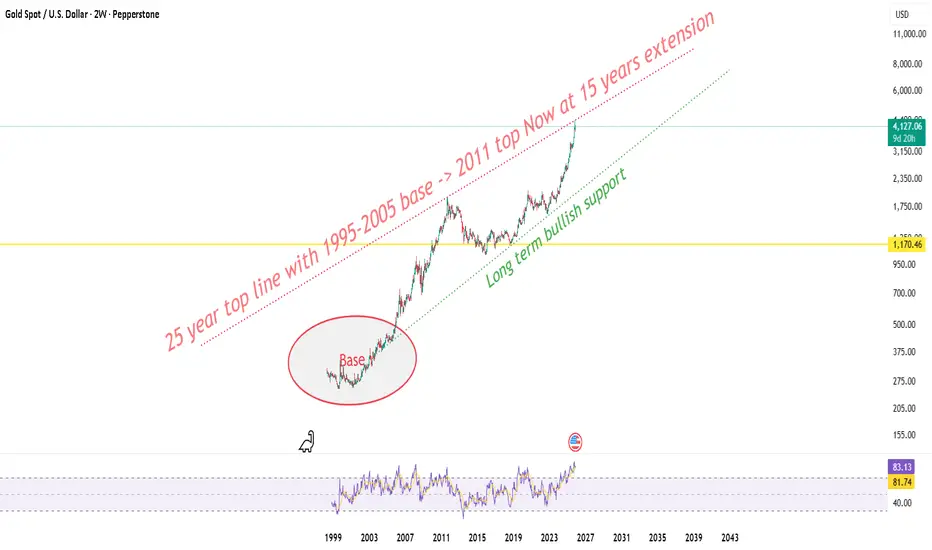
Gold at 25 year top line ! Macro view !Zooming out to the 2 week frame gold’s now touching the same top line that was drawn from the 1995-2005 base to the 2011 cycle high. This upper rail has acted like a generational ceiling and after nearly 15 years, price has stretched back into that very band again, this time near 4150–4350.
This zone isn’t just any resistance it’s the outer wall of gold’s entire super-cycle structure. Historically, whenever price came here with RSI above 80 on the 2-week frame, it marked exhaustion or at least a multi-month digestion phase before the next leg higher. And right now, RSI is sitting around 83 a clear signal of overheated momentum.
Macro context still favors gold in the long term global rate-cut expectations, slower real yields, and consistent central-bank accumulation keep the long-term green base trendline (drawn from 2005 lows) fully intact. As long as that line holds, the long-term structure stays bullish-biased.
But here’s the catch the higher we climb without a structural reset, the more fragile the rise becomes.
So 4365 stands as a major decision point.
Reject from here: we could see a healthy pullback toward 3750-3800 — still within the bullish channel.
Break and close above: that opens the door for a true macro breakout, with next expansion targets sitting around 4800–5200 over the coming years.
For now, this run feels more like a macro stretch ice sitting on sand. Looks shiny, but needs solid ground before it can hold.
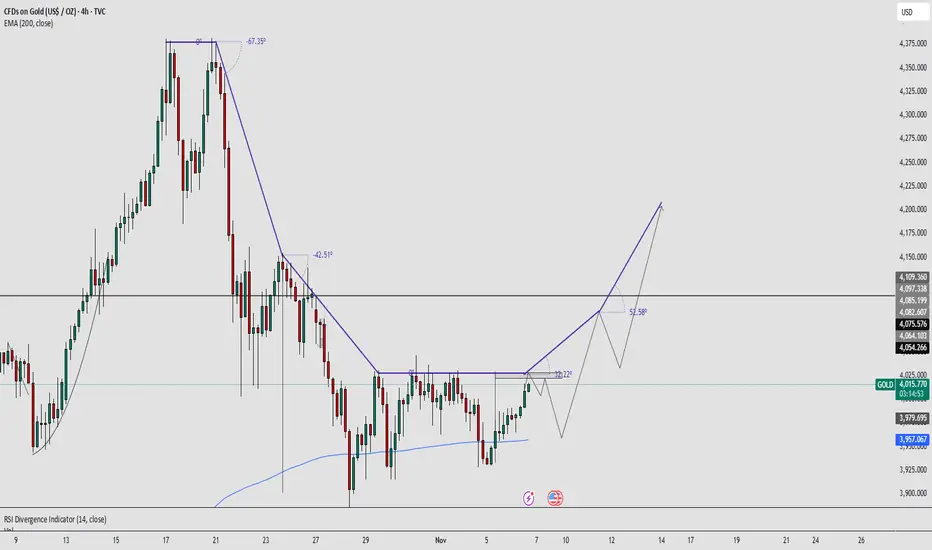
Gold H1 – End of Wave 5: Is a Corrective ABC Coming?⚡ XAUUSD – Elliott Wave Intraday Outlook | 11/11
📈 Elliott Wave Context
Gold has completed a clean 5-wave impulsive structure on the H1 timeframe, with Wave 5 pushing into the premium zone above 4130.
Price now shows early exhaustion at the highs, suggesting the market is preparing to transition into a corrective ABC phase.
A confirmed reversal signal will be:
✅ H1 close below the Wave 2–4 trendline → confirming the start of Wave A.
🔎 Technical Breakdown (Wave Structure)
• Wave 1: Initial rally from 3964
• Wave 2: Shallow pullback near 3985
• Wave 3: Strong impulsive breakout toward 4070+
• Wave 4: Mid-cycle correction holding structure
• Wave 5: Final push topping around 4130–4140 (current swing high)
The 5-wave impulse is now completed → market likely moves into A–B–C correction.
📉 Expected Elliott Wave Path (ABC)
Wave A
• First levels: 4105 (Fibo 0.236)
• Main target zone: 4078 (Fibo 0.382)
Wave B
• Corrective rebound toward
o 4105, or
o 4115–4120
Wave C
• Strongest leg of correction
• Ideal target zones:
o 4035 (Fibo 0.618 retracement of the full 1–5 impulse)
o 4004 (Fibo 0.786 retracement)
• Wave C often ≈ Wave A → aligns with 4035–4004
📌 Intraday Trade Plan (Elliott-Based)
✅ Scenario 1 – SELL the upcoming correction (Preferred)
Entry:
• After H1 candle closes below the 2–4 trendline,
or wait for a Wave B retest into 4105–4120.
Stop Loss:
• Above the Swing High → 4145
Take Profit:
• TP1: 4078
• TP2: 4035
• TP3: 4004
✅ Scenario 2 – BUY only if wave invalidation occurs
If gold breaks and holds above 4145, Wave 5 may be extending.
Entry: above 4145
SL: 4120
TP: 4170–4200
✅ Summary
Gold has finished a textbook 5-wave impulse and is now likely entering a corrective ABC structure.
The highest-probability opportunity today is to sell the Wave B retracement and target deeper corrective zones at 4035–4004.

Gold 1H – Is This Pump Temporary or the Start of a Bigger Move?🟡 XAUUSD – Intraday Smart Money Plan | by Ryan_TitanTrader
📈 Market Context
Gold extended its bullish leg overnight, driven by a sharp upside displacement following a clean ChoCH on the H1 structure.
However, the impulsive rally is now pushing deep into premium territory, where higher-timeframe supply begins to re-enter the picture.
Market sentiment remains cautious ahead of U.S. consumer confidence data and upcoming comments from several Fed officials.
• A hawkish tone could strengthen the dollar intraday, making the current rally vulnerable to a pullback.
• A neutral or dovish signal may allow gold to sweep higher liquidity before forming its next decisive move.
Price is currently tapping into resting buy-side liquidity above 4060–4070, with the next pool sitting just beneath the 4090 supply zone, making this an ideal location for short-term reversals.
🔎 Technical Analysis (1H / SMC Style)
• Structure: H1 bias remains bullish after the major ChoCH, but price is now entering an exhaustion phase as it reaches unmitigated supply.
• Premium Zone: 4090–4088 aligns with the freshest H1 supply, formed right before the displacement — a prime location for a short-term reversal.
• Liquidity Sweep: The candles show aggressive wicks into higher liquidity, suggesting the market may engineer one final sweep into 4090 before rotating downward.
• Discount Zone: 3974–3976 lines up with unmitigated demand and sits directly below the previous accumulation range — an ideal discount level for continuation buys if price retraces.
🔴 Sell Setup (High-Probability Reversal)
• Entry: 4090 – 4088
• Stop-Loss: 4100
• Take-Profit Targets: → 4040 (first liquidity pocket) → 4005 (return to structure) → 3976 (discount zone & demand confluence)
🟢 Buy Setup (Demand Reaction Setup)
• Entry: 3974 – 3976
• Stop-Loss: 3967
• Take-Profit Targets: → 4005 → 4040 → 4080
(Only valid if price performs a liquidity sweep into 3976 and prints a clean M15 ChoCH.)
⚠️ Risk Management Notes
• Avoid entering early inside the premium zone — wait for bearish confirmation (M5–M15 BOS).
• The demand at 3974–3976 is strong but only valid once liquidity beneath the range has been fully taken.
• Do not chase buys near current levels; price is overextended and has no discount alignment.
• Partial profits should be secured at each liquidity point, with stops trailed using structural highs/lows.
• Intraday bias remains bullish-to-neutral, but current price is at an extreme, making shorts more favorable short-term.
✅ Summary
Gold is reaching into a major premium zone near 4090, where a short-term reversal becomes highly probable.
The 4090–4088 supply provides a clean, high-quality SMC continuation-short setup, while the 3974–3976 demand zone remains the strongest location for reactive long positions.
Stay patient — today’s movement will likely determine whether the recent pump is temporary or the beginning of a broader structural shift.
FOLLOW RYAN_TITANTRADER for daily SMC setups ⚡

GOLD SHOWING A GOOD UP MOVE WITH 1:10 RISK REWARD GOLD SHOWING A GOOD UP MOVE WITH 1:10 RISK REWARD
DUE TO THESE REASON
A. its following a rectangle pattern that stocked the market
which preventing the market to move any one direction now it trying to break the strong resistant lable
B. after the break of this rectangle it will boost the market potential for break
C. also its resisting from a strong neckline the neckline also got weeker ald the price is ready to break in the outer region
all of these reason are indicating the same thing its ready for breakout BREAKOUT trading are follws good risk reward
please dont use more than one percentage of your capitalfollow risk reward and tradeing rules
that will help you to to become a bettertrader
thank you

Gold 4H – Key Liquidity Zones Ahead of US PMI & Fed Commentary🥇 XAUUSD – Weekly Smart Money Outlook | by Ryan_TitanTrader
📈 Market Context
Gold continues to consolidate within a tight 4H range as traders prepare for a week influenced by U.S. PMI releases, Fed speeches, and shifting rate-cut expectations.
Mixed economic signals — including softer labour data but resilient manufacturing prints — have kept gold trapped between supply overhead and stacked demand levels below.
Institutional flows remain cautious, with markets waiting for clarity on the Fed’s stance. This uncertainty often fuels liquidity-driven sweeps, making this week especially favourable for SMC-style setups.
Short-term volatility is expected as price interacts with major liquidity pools on both ends of the range.
🔎 Technical Analysis (4H / SMC View)
• Price is moving within a well-defined range structure, with repeated liquidity grabs on both sides indicating accumulation by larger players.
• The latest 4H ChoCH signals continued hesitation from buyers near the mid-range, hinting that the market may engineer another sweep before committing to a directional leg.
• A significant Premium Supply Zone at 4154–4152 sits just above recent equal highs — an attractive area for liquidity hunts followed by potential short-term distribution.
• Conversely, the Discount Demand Zone at 3907–3909 aligns with previous structural reaction levels and sits below a liquidity shelf, making it an ideal zone for re-accumulation.
• Expect engineered stop-hunts around mid-range liquidity (4000–4016) before a stronger move develops.
🟢 Buy Zone: 3907–3909
SL: 3900
TP targets: 3978 → 4003 → 4016 → 4125
Rationale:
• Discount zone within the current 4H range
• Liquidity resting below the structure lows
• Potential accumulation before the next bullish impulse
🔴 Sell Zone: 4154–4152
SL: 4161
TP targets: 4080 → 4016 → 3978 → 3920
Rationale:
• Premium supply positioned above equal-high liquidity
• Likely area for a sweep before corrective downside
• Confluence with previous 4H structure rejection
⚠️ Risk Management Notes
• Wait for M15 ChoCH or BOS confirmation inside each zone before entering.
• Expect liquidity manipulation around 4000–4016, especially during US session opens.
• Avoid entries 10–15 minutes before major Fed or PMI releases to limit spread expansion.
• Scale partial profits at each structural target to lock in gains while letting runners play out.
✅ Summary
Gold remains in a controlled 4H range with clear institutional footprints above and below the current price.
Smart Money is likely to engineer a move into either the 4150 supply or the 3900 demand before choosing its next major direction.
Both setups offer high-probability opportunities when combined with intraday confirmations.
Stay patient, wait for liquidity sweeps, and respect structure.
Premium sells remain valid at 4154–4152, while discounted buys are favoured at 3907–3909.
🔔 FOLLOW RYAN_TITANTRADER for daily SMC setups ⚡

Gold 1H – Pullback Expected as USD Softens After Jobless Claims🟡 XAUUSD – Intraday Trading Plan | by Ryan_TitanTrader
📈 Market Context
Gold is trading within a corrective structure today as the U.S. dollar weakens slightly following higher-than-expected Jobless Claims.
Market sentiment remains mixed ahead of upcoming Fed speeches, which could provide clues about December policy expectations.
• A more hawkish tone could trigger a deeper downside move toward unfilled discount zones.
• Conversely, any dovish signals may push gold into a short-term liquidity grab before resuming its corrective trend.
Liquidity remains concentrated near the $4,030 area, where price may tap into resting buy-side liquidity before forming the next bearish leg.
🔎 Technical Analysis (1H / SMC Style)
• Structure: Current bias shows corrective bearish intent following recent ChoCH → BOS sequence on H1.
• Premium Zone: The 4030–4028 region aligns with an unmitigated H1 supply — ideal for continuation shorts.
• Liquidity Sweep: Price may reach 4030 to sweep early breakout buyers before confirming downside continuation.
• Discount Zone: Strong demand sits at 3932–3934, overlapping with previous bullish displacement and unmitigated demand.
🔴 Sell Setup
• Entry: 4030 – 4028
• Stop-Loss: 4040
• Take-Profit Targets: → 3980 → 3964 → 3934 (major demand zone)
🟢 Buy Setup (Countertrend Reaction)
• Entry: 3932 – 3934
• Stop-Loss: 3925
• Take-Profit Targets: → 3964→ 3995 → 4020
(Only valid if liquidity sweep and bullish reaction occur at the demand zone)
⚠️ Risk Management Notes
• Wait for M15 BOS/ChoCH confirmation at both zones to avoid premature entries.
• Avoid trading directly at the minor support around 3964 — it is not a valid SMC entry zone.
• Prioritize the sell setup; intraday bias remains corrective-bearish within a broader range.
• Secure partial profits at the first liquidity target and trail stops according to structure.
✅ Summary
Gold is likely to seek premium liquidity near 4030 before resuming its corrective move lower.
The 4030–4028 supply area offers a clean continuation-short entry, while 3932–3934 remains the strongest discount zone for reactive long setups.
Stay adaptable — the market maintains a mild bearish tone while waiting for further Fed guidance.
FOLLOW RYAN_TITANTRADER for daily SMC setups ⚡

XAUUSD | Gold 4H Breakout Setup | Wait for Retest Before Long Gold is currently trading near the 4H resistance zone after a short-term recovery move. The price is approaching a key supply area where a breakout or rejection can decide the next direction. I am planning a long entry only after a proper retest to avoid chasing the move.
Key Levels:
• Resistance: 4045 – 4075
• Strong Support: 3955 – 3980 (200 EMA zone)
• Major Upside Target after breakout: 4210 – 4230
Trade Plan:
1. Let price approach the resistance zone
2. Wait for breakout and then retest near 4045 – 4075
3. Look for bullish rejection candle to confirm entry
4. If retest holds, next leg up toward 4210 is possible
Why Wait for Retest?
Retest reduces false breakout risk and improves risk to reward. Market is still recovering from a previous strong sell-off, so patience gives a more controlled entry.
Sentiment: Neutral to Bullish
Timeframe: 4H
Style: Swing / Position
Disclaimer:
This is not financial advice, just my personal price structure view.
Gold (XAU/USD) 4H Chart Analysis – Short-Term Reversal from ?Technical Overview:
Gold has recently rebounded from a High Demand Zone around the $3,900–$3,910 region, showing clear signs of buyer re-entry after a prolonged bearish correction. The candle structure suggests strong bullish intent, with higher lows forming and a potential continuation toward the next liquidity area.
Key Observations:
🔹 High Demand Zone: Price reacted strongly here, indicating institutional buying pressure.
🔹 High Prop POI (Point of Interest): Served as a key accumulation level before the breakout.
🔹 SMC Trap: Indicates a prior liquidity grab, trapping late sellers before the move up.
🔹 Bullish Momentum Building: Consecutive bullish candles after rejection from the demand zone strengthen the reversal bias.
Target Projection:
🎯 Immediate Target: $4,080 – $4,100 (aligned with local resistance and liquidity grab zone).
🛑 Support: $3,905 (must hold to maintain bullish structure).
💎 Extended Target (if momentum continues): $4,160 – $4,180 (previous major swing high zone).
Summary:
Gold is showing a short-term recovery phase within a broader bullish structure. A confirmed 4H close above $4,030 would likely propel price toward the $4,100 region, while a drop below $3,900 would invalidate the bullish setup.
📊 Suggested Title:
"Gold Rebounds from Key Demand Zone, Eyes $4,100 Resistance 🔥"

“Gold Rebounds from Demand Zone — Short-Term Recovery Ahead”Analysis:
Gold (XAU/USD) on the 4-hour chart shows a strong corrective decline after forming an SMC trap near the 4,250–4,300 zone, where liquidity was swept before a sharp selloff. Price has now reached the High Probability POI (Point of Interest) around the 3,850–3,880 region, showing early signs of a bullish reaction.
The recent candle structure indicates buyers are stepping in from this demand zone, confirming a potential short-term reversal. If momentum sustains, the first target zone lies around 3,950–3,980, aligning with minor resistance and previous imbalance fill.
Outlook:
📈 Bias: Bullish correction (short-term)
🧭 Key Support: 3,850 – 3,880
🎯 Target: 3,950 – 3,980
⚠️ Invalidation: Break below 3,840 may reopen bearish continuation toward 3,780

#xauusd gold dumping is going to 3600 this is my gold analysis#xauusd gold dumping is going to 3600 this is my gold analysis #xauusd gold dumping is going to 3600 this is my gold analysis
v
#xauusd gold dumping is going to 3600 this is my gold analysis#xauusd gold dumping is going to 3600 this is my gold analysis#xauusd gold dumping is going to 3600 this is my gold analysis#xauusd gold dumping is going to 3600 this is my gold analysis
#xauusd gold dumping is going to 3600 this is my gold analysis
why the reason you can sea on my previous public post of #gold
#xauusd

XAUUSD Analysis - Levels and Pridiction#Gold (XAU/USD) Technical Analysis - October 27, 2025
Current Market Status: Retracement on Higher Time Frame,
Lower Timeframe Bearish Breakdown⚠️
Gold is trading at 4,033.67, having broken down from the previous #consolidation zone. The market has violated key support levels and is now showing clear bearish momentum with multiple technical confirmations.
Critical Technical Developments:
1️⃣ Triangle Pattern Breakdown (1H Chart)
The 1-hour chart reveals a confirmed triangle #pattern breakout to the downside. After breaking below the triangle support, price attempted a retest of the breakdown level around 4,093-4,144 but was rejected, confirming the pattern's validity. This is a classic bearish continuation signal.
2️⃣ Demand Zone Invalidation
A crucial demand level that previously held multiple tests has now been completely invalidated. The chart explicitly notes: "Demand Level to be invalidated to move the Price Further Down" - this condition has been met, opening the path for deeper downside movement.
3️⃣ Minor Trend Shift Level Breach
Price has broken below the **Minor Trend Shift Level** at approximately 4,093, confirming a shift from bullish to bearish short-term structure. This level now acts as resistance.
Target Zones (High Probability):
🎯 Immediate Targets:
- 3,945 - Next support cluster (current proximity)
- 3,845 - 0.5 Fibonacci retracement level (PRIMARY TARGET)
- 3,719 - 0.618 Fibonacci retracement level (EXTENDED TARGET)
The Fibonacci levels in green boxes, are the key magnetic zones for price action.
📉 Bearish Continuation (70% Probability)
Price continues lower toward 3,845, potentially extending to 3,719 if selling pressure intensifies. This move would represent a healthy correction within the broader uptrend from the yearly lows.
📈 Bullish Reversal (30% Probability)
Requires reclaiming 4,144 with strong momentum AND holding above it on daily timeframe. Only then would the bearish structure be invalidated.
Conclusion:
Gold remains in a confirmed downtrend on lower timeframes with clear downside targets visible. The invalidation of demand zones and triangle breakdown provide strong bearish confirmation. Traders should focus on the 3,845-3,719 zone as the primary area of interest for potential reversal setups. Until price reclaims 4,150+, the path of least resistance remains **DOWN**.
Risk Management: Use proper position sizing as volatility remains elevated. The 3,845 level will be crucial - watch for buyer reaction there.

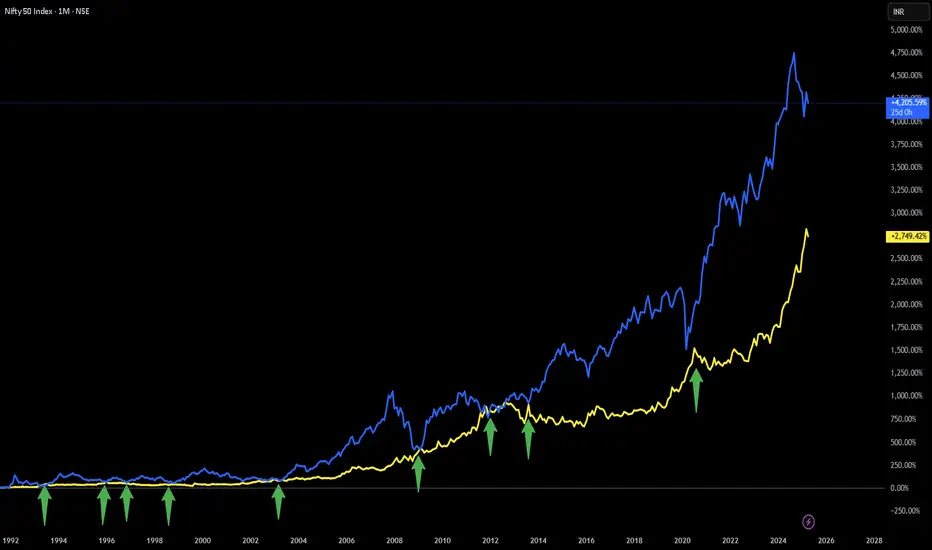
Strange Observation between NIFTY and GOLD...Since August 1, 1991: When ever NIFTY and GOLD return are same NIFTY gives handsome return in coming months.
Good examples of above statement are years 2003, 2009, 2013 and 2020.
Since August 1, 1991: NIFTY has given approx 4200% return and GOLD has given approx 2750% return. Difference in return is approx 1450%.
Going by the above observation either NIFTY has to come down or GOLD has to go up (or both) for NIFTY to give handsome return.
NOTE: This is just a strange observation/correlation.
Disclaimer: This is for demonstration and educational purpose only. This is not buying or selling recommendations. I am not SEBI registered. Please consult your financial advisor before taking any trade.