Gold 1H – Bearish Reaction After Consecutive Gains🟡 XAUUSD – Intraday Trading Plan | by Ryan_TitanTrader
📈 Market Context
After several sessions of steady gains, gold is showing signs of exhaustion as U.S. Treasury yields stabilize and traders reassess the Federal Reserve’s next move.
The market’s focus today is on U.S. housing data and Fed officials’ remarks, which could shape expectations for the December policy outlook.
• A hawkish tone from policymakers may strengthen the dollar and pressure gold lower.
• Conversely, softer remarks could briefly trigger buying around key discount zones, but the overall tone remains corrective after the recent rally.
Market liquidity is concentrated near the ₹4,230 area — where price may tap into unmitigated supply before continuing its bearish leg.
🔎 Technical Analysis (1H / SMC Style)
• Structure: The overall bias has shifted bearish following consecutive ChoCH and BOS formations.
• Premium Zone: The 4,230–4,228 area aligns with an H1 order block and previous liquidity pool — a prime zone for short re-entry.
• Liquidity Sweep: The recent upside push toward 4,230 may sweep late buyers before the next bearish leg unfolds.
• Discount Zone: Short-term liquidity may rest around 4,080–4,100, which aligns with previous sell-side imbalance (SSI) and acts as an intraday reaction zone.
🔴 Sell Setup
• Entry: 4,230 – 4,228
• Stop-Loss: 4,240
• Take-Profit Targets: 4,100 → 4,080 → 4,050+
🟢 Buy Scalp Setup (Short-Term Countermove)
• Entry: 4,081 – 4,083
• Stop-Loss: 4,074
• Take-Profit Targets: 4,100 → 4,115
(Only valid if liquidity sweep confirms reaction within discount zone)
⚠️ Risk Management Notes
• Confirm M15 BOS/ChoCH before entry — avoid blind orders during news.
• Reduce position size for scalp entries; primary directional bias remains bearish.
• Lock partial profits near first liquidity targets and trail stops as structure confirms continuation.
✅ Summary
Gold faces near-term correction pressure after multiple bullish sessions.
The 4,230–4,228 zone offers a clean premium OB entry for continuation shorts, while reactive buyers may scalp intraday from 4,081 if liquidity sweeps occur.
Stay adaptive — today’s sentiment is short-term bearish within a larger range-bound structure.
FOLLOW RYAN_TITANTRADER for daily SMC setups ⚡
Goldprediction

Gold Whats Next??gold rally lasted 4 years everytime in the past , and are trapped for years
Disclaimer- Just my view and opinion trade at your own risk not an investment advice these are only for educational purposes

XAU USD SELL OFF Good sell off in Xau USD from top level .it's falling from 4331. Now at support near 4200. If crossed below 4200 then again good sell off . Or may take support here and then fall again after taking retracement. Let us see what may happen further. Support 4200 Round level . If fall then 4167 possible.
For more visit my Tradingview Profile

Gold 1H – Can Gold Hold Above 4247 as Powell Takes the Stage?XAUUSD – Intraday Trading Plan | by Ryan_TitanTrader
📈 Market Context
Gold holds firm near ₹4,230, with traders cautiously awaiting U.S. Retail Sales data and Fed Chair Powell’s remarks later today.
After a series of softer inflation reports, market sentiment has tilted mildly dovish — yet the U.S. dollar remains steady as investors hesitate to price in early rate cuts.
The Fed’s tone today will be critical: a hawkish Powell could trigger short-term profit-taking on gold, while any dovish signals may reignite safe-haven bids.
Expect choppy intraday movement with liquidity sweeps around key zones before a confirmed directional move emerges.
🔎 Technical Analysis (1H / SMC Style)
• The structure remains bullish, confirmed by previous Breaks of Structure (BOS) and a Change of Character (ChoCH) earlier in the week.
• Price is now approaching a premium supply zone at 4247–4249, where potential short-term sell reactions could appear before retracement.
• Below, the discount demand zone at 4184–4186 aligns with prior BOS support and acts as a high-probability reaccumulation area.
• If price revisits the buy zone and forms bullish confirmation on M15, continuation toward new highs around 4260+ is favored.
🔴 Sell Setup: 4247 – 4249
SL: 4255 – 4257
TP targets: 4210 → 4195
🟢 Buy Setup: 4184 – 4186
SL: 4174
TP targets: 4210 → 4245 → 4260+
⚠️ Risk Management Tips
• Wait for M15 BOS/ChoCH confirmation before executing either setup.
• Watch for volatility spikes around Powell’s speech and U.S. Retail Sales release — spreads may widen.
• Consider partial profits at intra-day liquidity points and trail stops once structure confirms.
✅ Summary
XAUUSD maintains its bullish structure but may face a liquidity sweep above 4247–4249 before a deeper retracement into 4184–4186.
Institutional activity could drive accumulation near the discount zone if macro data supports dovish sentiment.
The intraday bias remains “Buy the Dip”, with tactical sells possible at premium resistance for short-term scalps.

Gold 1H – Slight Correction or Bullish Reaccumulation Ahead?XAUUSD – Intraday Trading Plan | by Ryan_TitanTrader
📈 Market Context
Gold extends its rebound near ₹4 250 as traders weigh the recent uptick in U.S. Treasury yields against growing expectations of a softer Federal Reserve stance.
After the latest mixed U.S. economic data, markets are leaning toward a mildly dovish outlook — rate-cut bets for early 2026 are gaining traction, while the dollar remains steady.
Today’s focus centers on U.S. housing-starts and jobless-claims data, which could steer short-term volatility.
A stronger-than-expected report may trigger temporary selling pressure on gold, while weaker figures could revive safe-haven demand and extend the rally toward ₹4 380 +.
Expect liquidity hunts before any clear directional move, as institutional players refine positions near the week’s range extremes.
🔎 Technical Analysis (1H / SMC Style)
• Market structure remains bullish, with previous Breaks of Structure (BOS) confirming continuation after the earlier accumulation phase.
• A short-term Change of Character (ChoCH) signals corrective movement — likely a liquidity sweep before the next bullish leg.
• Liquidity resting below ₹4 200 has already been taken, aligning with the discount zone around ₹4 196 – ₹4 198.
• A potential re-accumulation is forming; buyers may look for confirmation (M15 BOS/ChoCH) inside this demand zone.
• Upside liquidity targets cluster near ₹4 375 – ₹4 380, coinciding with a premium supply zone where sellers might re-enter.
🔴 Sell Setup
Entry: 4378 – 4376
Stop-Loss: 4386
Take-Profit Targets: 4325 → 4260
🟢 Buy Setup
Entry: 4196 – 4198
Stop-Loss: 4190
Take-Profit Targets: 4250 → 4370 → 4380 +
⚠️ Risk Management Tips
• Wait for lower-timeframe BOS/ChoCH confirmation before execution.
• Be cautious around U.S. macro data releases — spreads and volatility can widen temporarily.
• Use partial take-profits at nearby liquidity zones and trail stops once market structure confirms continuation.
✅ Summary
Gold maintains its bullish bias above ₹4 200 after sweeping liquidity.
A short-term correction could retest ₹4 196 – ₹4 198 for fresh buy entries, while the broader trend remains upward.
Only a clean structural break below ₹4 190 would invalidate the bullish continuation scenario.
FOLLOW RYAN FOR MORE USEFUL TRADING IDEAS!!!

Gold 1H – Bullish Rebound After Strong Correction🟡 XAUUSD – Intraday Trading Plan | by Ryan_TitanTrader
📈 Market Context
Gold is attempting to rebound near $4,320 after a sharp correction earlier this week, as traders weigh the recent pullback in U.S. Treasury yields and renewed expectations of a dovish Federal Reserve tone.
Markets are now positioning ahead of key U.S. housing and manufacturing data, which could shape short-term sentiment for both the dollar and real yields.
• Softer economic numbers may reinforce the case for policy easing in early 2026, supporting gold’s safe-haven appeal.
• Conversely, stronger data could momentarily pressure XAUUSD, yet the broader uptrend remains intact amid central-bank accumulation and geopolitical tension.
Expect a liquidity-driven environment, with price potentially sweeping lower before reclaiming bullish momentum.
🔎 Technical Analysis (1H / SMC Style)
• Structure: Overall bias remains bullish following consecutive Breaks of Structure (BOS) and a confirmed Change of Character (ChoCH) indicating corrective retracement.
• Discount Zone: The $4,270–$4,272 demand area sits within the discount zone of the recent range (swing low to 4454 high), ideal for re-accumulation.
• Liquidity Sweep: Recent wicks near $4,300 suggest liquidity has been collected, potentially setting up for another bullish push.
• Premium Zone: Upside liquidity clusters near $4,454–$4,452, aligning with a premium supply area where short-term selling may appear.
🔴 Sell Setup
• Entry: 4454 – 4452
• Stop-Loss: 4463
• Take-Profit Targets: 4400 → 4330
🟢 Buy Setup
• Entry: 4270 – 4272
• Stop-Loss: 4260
• Take-Profit Targets: 4340 → 4380 → 4450 +
⚠️ Risk Management Notes
• Wait for M15 BOS/ChoCH confirmation before triggering entries.
• Avoid entries during high-volatility windows around U.S. data releases.
• Secure partial profits near intermediate liquidity zones, trail stops after BOS confirmation.
✅ Summary
Gold maintains a bullish re-accumulation structure following a healthy correction.
A retest into the discount zone around $4,270 offers potential long entries targeting the premium zone near $4,450+.
Only a decisive break below $4,260 would invalidate the intraday bullish scenario.
FOLLOW RYAN_TITANTRADER for more SMC trading insights ⚡

Gold Bullish Reversal from Demand Zone Targeting 4320 ResistanceGold has displayed a strong bullish rejection from the 4,220–4,240 demand zone, signaling that buyers are stepping back in after a brief corrective phase. The price has respected the previously broken ascending trendline, now acting as dynamic support, indicating that market sentiment remains positive.
Key Observations:
Trend Structure: The broader trend continues to favor the bulls, with higher highs and higher lows still valid.
Demand Zone: Buyers defended the 4,220–4,240 area with stxrong volume, confirming institutional interest.
Price Action: Recent bullish engulfing candles suggest renewed buying momentum.
Next Resistance: The 4,310–4,330 region stands as a key resistance zone where partial profit-taking could occur.
Volume: Noticeable increase in bullish volume near support adds confirmation to the move.
Trading Outlook:
If price sustains above 4,240, the bias remains bullish toward 4,320–4,340.
A daily close below 4,220 would invalidate this setup and shift focus back to the 4,100 zone.
Summary
Gold is currently positioned for a potential continuation of its primary uptrend, with early signs of buyer strength re-emerging at major support. Momentum remains in favor of the bulls as long as the 4,220 base holds firm.

Gold (XAU/USD) Technical Analysis - October 18, 2025Overview and Recent Performance
As of October 18, 2025, spot gold closed at $4,196.00, marking a 2.12% decline from the previous day's close of $4,253.97. This pullback came after a volatile session where gold reached an intraday high of $4,380 but failed to sustain above $4,300, closing near the session low. Over the past week, gold has surged approximately 6.5%, extending its year-to-date gain to over 58%. U.S. Federal Reserve policy uncertainty, and safe-haven demand. Earlier in the month, gold notched its 45th all-time high of 2025.
Support and Resistance Levels
Resistance: Immediate at $4,300 (recent swing high), followed by $4,380 (today's high) and $4,460 (Elliott Wave target). A sustained break above $4,300 could target $4,500
Support: Near-term at $4,196 then $4,137 and $4,100 Deeper support at $4,000, where historical buying interest is strong.
~~ Disclaimer ~~
Trading or investing in assets like crypto, equity, or commodities carries high risk and may not suit all investors.
Analysis on this channel uses recent technical data and market sentiment from web sources for informational and educational purposes only, not financial advice. Trading involves high risks, and past performance does not guarantee future results. Always conduct your own research or consult a SEBI-registered advisor before investing or trading.
This channel, Render With Me, is not responsible for any financial loss arising directly or indirectly from using or relying on this information.

Gold (XAU/USD) Breakout Rally Toward New HighsAnalysis:
Gold (XAU/USD) continues its strong bullish momentum on the 4-hour chart, forming a series of higher highs and higher lows, confirming a sustained uptrend. The recent breakout above the resistance zone near $4,150–$4,170 indicates renewed buying interest and momentum buildup.
After a brief retest of the breakout area, price has started climbing again — a sign of trend continuation supported by bullish candle formations and strong market sentiment.
Technical Outlook:
Support Zone: $4,140 – $4,170 (previous resistance turned support)
Bullish Confirmation: Continuation pattern with clean structure and volume support
Momentum Bias: Strongly bullish while above $4,150
🎯 Target: $4,300 – $4,320 zone
🛑 Stop Loss: Below $4,140 to limit downside risk
📈 Summary:
As long as gold stays above the breakout level of $4,170, the market remains bullish, with upside potential toward $4,300–$4,320, aligning with the next major resistance area.

XAUUSD // Liquidity Grab // ATH# Gold Spot / U.S. Dollar - Liquidity Analysis
Market Structure Analysis
Key Liquidity Zones Identified
The chart highlights two critical liquidity zones where significant price action is anticipated:
**Upper Liquidity Zone: $4,212 - $4,219**
This zone represents an area of accumulated buy-side liquidity, typically formed by stop-losses from short positions and buy-stop orders. The red shaded area indicates where institutional players may target for liquidity capture before potential reversals.
**Lower Liquidity Zone: $4,157 - $4,162**
This zone marks the sell-side liquidity area, where stop-losses from long positions and sell-stop orders cluster. This level serves as a potential magnet for price action seeking to capture liquidity before any significant directional move.
Technical Setup
**Channel Pattern**
Gold is currently trading within a well-defined ascending channel on the intraday timeframe. The parallel trend lines show:
- Consistent higher highs and higher lows
- Price currently positioned in the mid-range of the channel
- Recent bounce from the lower channel boundary
**Demand Zone**
A marked demand zone is visible at lower levels, indicating previous buying interest and potential support.
Price Action Scenarios
Bullish Scenario (Green Path):
If price maintains support at current levels or the lower demand zone, we could see:
1. Continuation toward the upper liquidity zone ($4,219)
2. Potential liquidity sweep above this zone
3. Possible rejection after capturing buy-side liquidity
Bearish Scenario (Red Path):
If price fails to hold current structure:
1. Drop toward the lower liquidity zone ($4,162)
2. Liquidity grab below this level
3. Potential reversal after capturing sell-side liquidity
#Liquidity Concept
The annotation "Liquidity !!!!!!" emphasizes the importance of these zones. In institutional trading theory, price often moves to areas of high liquidity (where stop-losses cluster) before making significant directional moves. This is commonly referred to as a "liquidity sweep" or "stop hunt."
Trading Considerations
When price approaches either liquidity zone, traders should watch for:
- Rejection wicks suggesting liquidity capture completion
- Break and retest patterns for confirmation
- Changes in momentum indicators
Risk Management Notes
- The 5-minute timeframe requires precise execution and tight risk management
- Liquidity zones can be quickly swept through in volatile conditions
- Always use appropriate position sizing relative to account risk tolerance
- Consider wider timeframe context for overall trend direction
Disclaimer
This analysis is provided for educational purposes only and represents a technical perspective on price structure and liquidity zones.
It is not financial advice or a recommendation to buy or sell. Gold trading involves substantial risk of loss. Always conduct your own research, use proper risk management, and consider consulting with a qualified financial advisor before making trading decisions.

Markets Brace for U.S. Retail Sales & Fed Volatility XAUUSD – Intraday Trading Plan | by Ryan_TitanTrader
📈 Market Context
Gold prices hover near ₹4,190 after an early-week rally as traders brace for U.S. Retail Sales data and a new round of Federal Reserve speeches later today.
Recent gains were fueled by softer inflation readings, yet the dollar remains resilient amid hawkish undertones from Fed officials. Markets are now balancing between expectations of slower growth and persistent rate-cut caution.
A stronger-than-expected Retail Sales print could pressure gold temporarily, but any dovish signal from Fed speakers may quickly restore bullish momentum. Expect liquidity hunts on both sides before a confirmed direction forms.
🔎 Technical Analysis (1H / SMC Style)
• Structure remains bullish after multiple Breaks of Structure (BOS) and a recent Change of Character (ChoCH) confirmation.
• Price is approaching the Premium Zone (4211–4209) — a potential liquidity sweep area where short-term sellers may react.
• Below, the H1 FVG Buy Zone (4145–4149) offers a discount entry aligned with recent BOS support and previous mitigation points.
• Maintaining a bullish bias while awaiting clean reaction within the FVG zone is key for continuation toward new highs.
🔴 Sell Setup: 4211 – 4209
SL: 4218
TP targets: 4190 → 4175 → 4155
🟢 Buy Setup: 4145 – 4147
SL: 4138
TP targets: 4170 → 4190 → 4220+
⚠️ Risk Management Tips
• Wait for M15 ChoCH/BOS confirmation before entry to avoid false breaks.
• Expect high volatility around Retail Sales and Fed remarks — spread widening is likely.
• Partial take-profits near intra-day liquidity points are recommended.
✅ Summary
XAUUSD remains bullish on structure but faces a potential liquidity grab around 4211–4209 before retracing into the H1 FVG buy zone (4145–4149).
Smart money may seek to accumulate long positions after a controlled pullback, especially if Fed commentary echoes a slower policy tightening path.
Intraday bias leans Buy the Dip, with caution around macro-driven volatility spikes.

Explaining the seller trap in XAUUSD/GOLDIt is an explanatory video about how sellers are trapped between market rumours and profit booking phases.
The gold chart is a classic example of this in the current scenario, where everyone is waiting to short Gold and gets trapped in the resulting volume.
Be careful with the trade setups.
I have mentioned the clear range of bullish and bearish continuation.

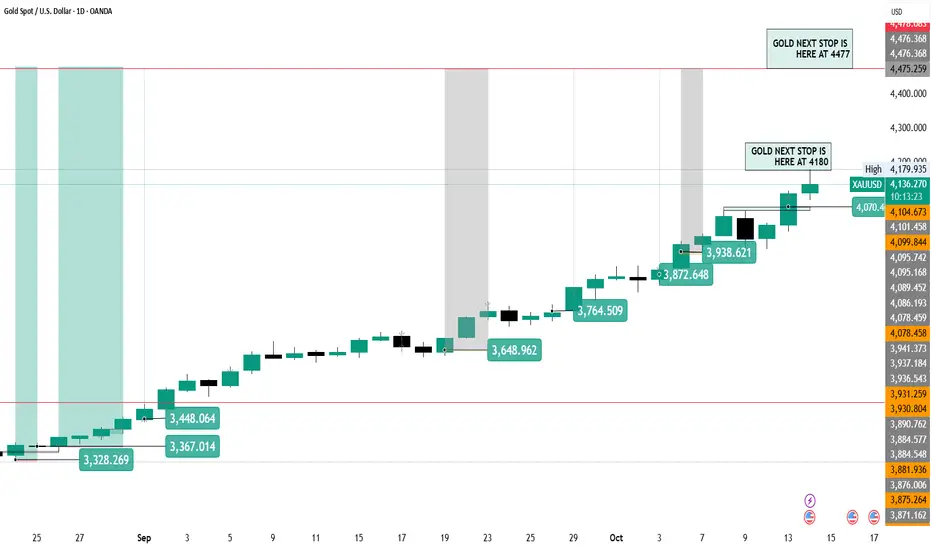
This is my next #gold tp in next 2-3 week and hight will be 4477This is my next #gold tp in next 2-3 week and hight will be 4477This is my next #gold tp in next 2-3 week and hight will be 4477This is my next #gold tp in next 2-3 week and hight will be 4477This is my next #gold tp in next 2-3 week and hight will be 4477This is my next #gold tp in next 2-3 week and hight will be 4477This is my next #gold tp in next 2-3 week and hight will be 4477This is my next #gold tp in next 2-3 week and hight will be 4477
Gold 1H – Price Reaction Ahead of U.S. Retail Sales & Fed RemarkXAUUSD – Intraday Trading Plan | by Ryan_TitanTrader
📈 Market Context
Gold is trading around the ₹4,110 mark, consolidating after a strong impulsive rally earlier this week.
Traders are now shifting focus to U.S. Retail Sales data and a series of Federal Reserve remarks due later today — both key drivers that could influence near-term expectations for the next rate decision.
After last week’s soft inflation signals, gold initially extended higher, but rising Treasury yields and cautious sentiment ahead of today’s macro releases have slowed momentum.
Any hawkish Fed tone or stronger consumer spending data could weigh on XAUUSD, triggering a liquidity sweep from the premium zones before the next accumulation phase begins.
🔎 Technical Analysis (1H / SMC Style)
• Structure shows a confirmed BOS on lower timeframes, signaling the end of the previous impulsive leg.
• Price currently sits within a Mitigation Zone (4117–4110), reacting to prior imbalance after a clean sweep of internal liquidity.
• The Premium Liquidity Zone (4217–4215) aligns with a Rejection Block and is likely to act as a short-term Sell Zone.
• Below, the 4056–4058 area marks a Buy-Side Support, overlapping with a previous ChoCH and internal discount OB.
• Expect a short-term sell reaction from premium zones before a possible bullish mitigation bounce off support.
🔴 Sell Setup: 4217–4215
SL: 4224
TP targets: 4200 → 4175 → 4160
🟢 Buy Setup: 4056–4058
SL: 4050
TP targets: 4070 → 4090 → 4100+
⚠️ Risk Management Tips
• Wait for M15 ChoCH / BOS confirmation before executing either setup.
• Be cautious during Fed remarks — volatility spikes are common around liquidity levels.
• If price reacts impulsively from 4217 with displacement, partial shorts are favored.
• Conversely, if 4056 holds and forms clean bullish structure, it could serve as the base for the next expansion leg.
✅ Summary
Gold is likely to engineer a liquidity grab in the premium zone (4217–4215) before retracing into the mitigation area near 4056–4058, where smart money may accumulate long positions.
The day’s direction will hinge on how markets interpret upcoming U.S. Retail Sales data and Fed tone — expect volatility and false breaks before the true directional move forms.

Gold 1H – Potential Liquidity Sweep Before Fed SpeechesXAUUSD – Intraday Trading Plan | by Ryan_TitanTrader
📈 Market Context
Gold remains steady near ₹4,065, as traders eye upcoming U.S. PPI data and Fed officials’ speeches later today for new guidance on the inflation outlook.
The recent rise in Treasury yields has slightly capped gold’s upside momentum, but underlying safe-haven demand persists amid ongoing geopolitical and economic uncertainty.
If the PPI print shows softer inflation, gold could attract renewed buying; however, a hotter reading may spark another liquidity sweep lower before any sustained rally.
🔎 Technical Analysis (1H / SMC Style)
• ChoCH confirmed at 4060+, showing potential exhaustion in the current short-term uptrend.
• Price tapped the premium zone (4080–4078), aligning with previous liquidity and imbalance — ideal for a short-term sell setup.
• A BOS formed at 4017, opening the way for retracement toward the discount zone (3999–3997).
• The 3997–3999 area is a strong demand zone, overlapping with a prior ChoCH and liquidity void — a potential reversal area for bulls.
• Expect a liquidity grab at 3990 before a bullish reaction if structure holds.
🔴 Sell Setup: 4080–4078
SL: 4087
TP targets: 4040 → 4015 → 4000
🟢 Buy Setup: 3999–3997
SL: 3990
TP targets: 4035 → 4060 → 4100+
⚠️ Risk Management Tips
• Wait for M15 ChoCH / BOS confirmation before triggering entries.
• Avoid over-leverage during Fed speech hours — price may fake out around liquidity levels.
• If price sweeps 4080 liquidity and rejects impulsively, partial short entries are favored.
• Conversely, if 3997 holds firm with strong bullish structure, watch for re-entry confirmation to ride the next expansion.
✅ Summary
Gold is currently playing within a premium-to-discount framework, as smart money may engineer a sweep of 4080 liquidity before driving price down toward 3997–3999 to collect buy-side orders.
After that, a strong bullish reaction is expected from the demand zone if macro conditions (like soft PPI or dovish Fed tone) support it.
Stay patient — structure confirmation is key before entering either direction.

Gold 4H – Bullish Setup Ahead of Fed & CPI Week🥇 XAUUSD – Weekly Smart Money Plan | by Ryan_TitanTrader
📈 Market Context
Gold continues to trade near the ₹4,000 mark as traders brace for a volatile week driven by the U.S. CPI release and Federal Reserve remarks.
Recent Fed comments hint that policymakers are open to rate cuts if inflation cools further, boosting gold’s appeal as a hedge against policy easing and market uncertainty.
Meanwhile, tensions in the Middle East and strong central bank demand for gold continue to provide underlying bullish momentum, though short-term pullbacks remain likely.
🔎 Technical Analysis (4H / SMC Style)
• The higher-timeframe BOS (Break of Structure) confirms that gold remains in a bullish market phase, with buyers defending every major retracement.
• The current pullback could target the Potential Reaccumulation Zone around 3947, where liquidity may be swept before the next bullish impulse.
• The Discount Demand Zone (3873–3875) aligns with strong 4H imbalance and previous structure support — ideal for a high-probability buy setup.
• The Premium Supply Zone (4134–4132) is positioned as a liquidity target, where price may react for short-term corrections.
🟢 Buy Zone: 3873–3875
SL: 3866
TP targets: 3947 → 4020 → 4050 → 4130+
🔴 Sell Zone: 4134–4132
SL: 4141
TP targets: 4080 → 4020 → 3950
⚠️ Risk Management Tips
• Wait for H1 ChoCH / BOS confirmation before executing positions.
• Anticipate liquidity hunts near 3950–3970 ahead of CPI or Fed events.
• Use partial scaling and secure partial profits once the structure confirms continuation.
• Avoid entering during the first 15 minutes of major news releases to reduce slippage risk.
✅ Summary
Gold remains structurally bullish on the 4H timeframe, with potential retracement opportunities offering premium entries.
Smart Money may induce a liquidity sweep into 3873–3875 before pushing toward 4130+, where a reaction from institutional supply is likely.
With major macro catalysts this week, traders should expect sharp volatility and manipulative moves before the next major leg develops.
🔔 Stay patient — let the market reveal its intent before entering.
Premium buys remain favored above 3870 while watching for potential distribution near 4130.

GOLD: The Dollar Blinks! Time to 'Pay' at the 0.618 Fibo (4018) The Macro Play: USD Retreat Sets the Stage for Gold's Counter-Attack
The precious metal is catching a bid as the US Dollar softens after hitting its recent highs. The fundamental backdrop is keeping Gold buoyant:
Fed Pivot Narrative: Despite the hawkish undertones in the last FOMC meeting minutes, the market's conviction in two potential Fed rate cuts by year-end remains a powerful tailwind, making non-yielding Gold more attractive.
Geopolitical Fog: While the short-term truce news caused a minor retreat, the overarching safe-haven demand driven by global tensions and the looming US government funding crisis provides critical floor support.
Bottom Line: Gold is navigating a choppy consolidation phase. Short-term pressure exists, but the Long-Term Macro Thesis favors a cautious recovery.
📊 The MatrixFibo PTKT: SCALP Zones Are Active!
Price action shows clear reaction points within the recent sharp move lower. Our plan is to Trade the Reactions at these high-probability confluence zones.
1️⃣ The Aggressive SELL Zone (SELL SCALP Setup)
We are looking for the market to exhaust its short-term recovery rally at major resistance levels.
Primary SELL ZONE: 3997 - 4000 (0.5 Fibo Level):
This area is critical psychological resistance and the 50% retracement of the latest impulse down.
PLAN: Await a failed breakout or clear bearish rejection signal (Pinbar, Bearish Engulfing) at 3997 - 4000.
TARGET: The move should aim to clear the lows, heading straight for 3915 - 3910.
The Ultimate SELL Reversal: 4014 - 4018 (0.618 Fibo Downtrend Zone):
This is the REACTION FIBO 0.618 DOWNTREND H1 ZONE. This level is our strongest strategic SELL point if the bounce extends deeper.
2️⃣ The Key BUY Zone (BUY SCALP Setup)
We treat this area as the final line of defense for the current uptrend structure.
Key Support & BUY SCALP REACT ZONE: 3915 - 3910:
This zone is a Major Confluence point: Key Support, the 0.786 Fibo, and the Uptrend Channel Bottom.
PLAN: Look for strong buying pressure to emerge as price tests 3915 - 3910. Requires a solid Bullish Price Action Confirmation.
TARGET: A successful bounce targets the liquidity back at 3997 - 4000.
🛑 FranCis MatrixFibo Risk Policy
Volatility Alert: Expect large swings around US data and Fed commentary. NEVER TRADE WITHOUT A HARD STOP LOSS (SL) on SCALPS.
Strategy Focus: The market is range-bound. Stick to a Two-Sided Scalping Plan defined by the identified price levels.
Discipline: Only enter trades at or with clear confirmation from the React Zones.

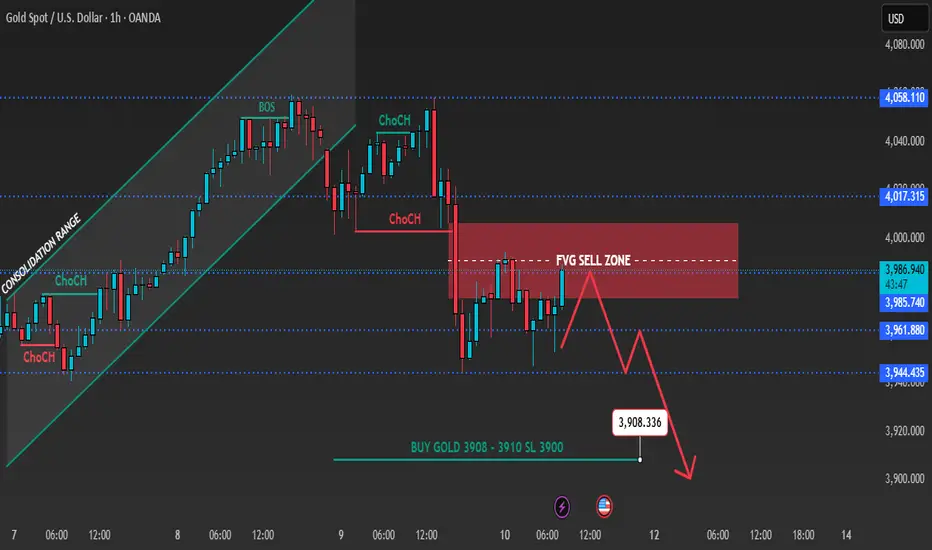
Gold 1H – Price Reaction Ahead of U.S. CPI DataXAUUSD – Intraday Trading Plan | by Ryan_TitanTrader
________________________________________
📈 Market Context
Gold prices remain steady around $3,975, as traders await the U.S. CPI data release later today — a key event that could shape expectations for the Fed’s next rate move.
If inflation cools, the dovish sentiment may boost gold’s safe-haven appeal; however, a hotter CPI print could trigger renewed dollar strength and short-term pressure on XAUUSD.
Market volatility is expected to spike near the release, so liquidity grabs and false breaks are likely before the true direction forms.
________________________________________
🔎 Technical Analysis (H1 / SMC Style)
• The recent Change of Character (ChoCH) confirms short-term bearish control after breaking the bullish structure near 4017.
• FVG Sell Zone (4015–4017) aligns with premium imbalance and prior liquidity — ideal for short setups if price retests that zone.
• BOS to the downside was confirmed at 3960, showing sellers in control.
• The discount zone 3908–3910 is a strong demand area where buyers may step in after liquidity sweep below 3910.
________________________________________
🟢 Buy Zone: 3908–3910
SL: 3900
TP targets: 3920 → 3940 → 3960+
🔴 Sell Zone: 4015–4017
SL: 4022
TP targets: 4000 → 3985 → 3970
________________________________________
⚠️ Risk Management Tips
• Wait for M15 ChoCH / BOS confirmation before entering either side.
• Use partial position sizing around CPI release — volatility may cause large wicks.
• Watch for liquidity hunts near 3980–3990 before CPI, then confirm structure direction.
________________________________________
✅ Summary
Gold is consolidating below key resistance while awaiting U.S. inflation data.
Smart money may engineer a liquidity sweep toward 4015–4017 (FVG) before resuming the bearish leg into 3910.
However, if CPI comes in softer than expected, buyers may defend 3908–3910, sparking a recovery back toward 3980+.
🔔 Stay alert around CPI release hours — expect manipulative price action and confirm structure breaks before committing to directional trades.
GOLD (XAUUSD) 1H CHART ANALYSIS – BEARISH SETUP AHEADGOLD (XAUUSD) 1H CHART ANALYSIS – BEARISH SETUP AHEAD
🔍 Technical Overview
Current Price: Around $4,036 – $4,040
Trendline: A key uptrend line (blue) has been broken, signaling weakening bullish momentum.
Resistance Zone: Between $4,058 – $4,062, marked by red arrows 🚫
Support Zone: Near $3,930 – $3,940, highlighted by the purple box 🟪
📊 Market Structure
The market recently made a lower high formation after failing to break above $4,062, indicating bearish divergence.
Multiple rejection candles at the resistance zone confirm selling pressure 💣.
The blue projection lines suggest a potential bearish retracement back toward the support zone around $3,930.
🧭 Key Levels
Type Price Level Notes
🔺 Resistance 4,058 – 4,062 Double top zone, strong sellers present
⚖️ Mid-Level 4,000 Psychological round number, interim support
🟣 Support 3,930 – 3,940 Major buying interest, possible reversal zone
📉 Expected Price Action
🔻 Scenario 1 (Primary):
Price may retest $4,050 – $4,060 resistance area, form another rejection, and drop toward $3,940 support.
Potential short entry near $4,050 – $4,060
Target $3,940
Stop loss above $4,070
🔄 Scenario 2 (Alternative):
If the price holds above $4,060, a breakout could trigger a bullish continuation toward $4,100+.
🧠 Trader’s Insight
⚠️ Bearish bias remains valid while below $4,060.
🕒 Watch for price reaction around the trendline retest and confirmation candles (bearish engulfing or pin bars).
📈 Smart traders might wait for confirmation below $4,000 before adding short positions.
💬 Summary
➡️ Bias: Bearish below $4,060
➡️ Target: $3,940
➡️ Invalidation: Break and close above $4,070
📍 “Trendlines break fast, but support zones hold stronger — trade smart, not fast.”

Gold Neowave Bulletin| 10/10/2025
Namaskaram Everyone
Welcome to intelligent investor, we provide market insights by synchronising and combining all the price action waves from different time frames and gives you single trend.
Here are all our previous gold analysis, with this you will understand how with Neowave Theory you will have an edge in the market.
Previous Neowave Bulletin
09/12/2025
07/10/2025
01/10/2025
30/09/2025
29/09/2025
OANDA:XAUUSD FOREXCOM:XAUUSD FX:XAUUSD VANTAGE:XAUUSD MCX:GOLD1!

Gold 1H – Watch for Liquidity Hunt Before Fed Minutes💎 XAUUSD – Intraday Trading Plan | by Ryan_TitanTrader
📈 Market Context
Gold continues to shine past the ₹4,000 mark, driven by persistent safe-haven demand amid U.S. government shutdown risks and growing expectations for multiple Fed rate cuts this year.
The upcoming Fed minutes will be a pivotal catalyst—if the tone leans dovish, gold could accelerate. But any hawkish surprises may provoke a short squeeze or shakeout.
🔎 Technical Analysis (H1 / SMC Style)
• Structure around 4070–4068 marks a premium liquidity zone, likely a sweep or reversal point.
• The lower band 3987–3989 serves as a discount zone / support base from which buyers may re-enter.
• Watch for clean Breaks of Structure (BOS) or Change of Character (ChoCH) on lower timeframes as confirmation.
• Always expect potential liquidity sweeps before major news reactions.
🟢 Buy Zone: 3987–3989
SL: 3980
TP targets: 4000 → 4015 → 4025 → 4040+
🔴 Sell Zone: 4068–4070
SL: 4077
TP targets: 4060 → 4045 → 4030 → 4015
⚠️ Risk Management Tips
• Let the price show intent (reject / sweep / BOS) before jumping in.
• On Fed minutes release, volatility may spike—use partial sizing and tighter trailing stops.
• Avoid trading right at the release; look for reactions and structural confirmation.
✅ Summary
Gold remains bullish structurally, but intraday plays hinge on how markets interpret the Fed minutes. Expect a liquidity sweep around 4068 before potential shorting, and a resilient support zone around 3987–3989 for re-entries aligned with the bigger bullish structure.
🔔 Stay alert for live updates and structure breaks around the Fed minutes to fine-tune entries.

XAUUSD GOLD IS HEADING TOWARDS 7000$ Cycle started when gold is around 1450$ some years ago.
1st cycle - 1000$ to 2000$
2nd cycle - 2000$ to 3000$
3rd cycle - 3000$ to 4000$
4th cycle - 4000$ to 7000$
5th cycle - 7000$ to 12000$
Every impulse has corrective phase according to price theory. you will see minor & major correction , profit bookings between level's to level's. oppurtunity will arise always so don't be greedy. This analysis based on fundamental factor's. Technically it will correct after every impulses. This analysis based on daily timeframe and it is not suitable for day trader , intraday or scalper.
OANDA:XAUUSD

Gold 1H – Bulls Seek Re-Entry Before Fed Minutes💎 XAUUSD – Intraday Trading Plan | Ryan_TitanTrader
📈 Market Context
Gold extends its advance above $4,030 as traders position ahead of this week’s FOMC minutes and key U.S. inflation expectations data. The metal remains supported by persistent geopolitical risk and renewed central-bank demand, while Treasury yields hover near monthly lows.
However, sentiment is mixed after the IMF warned of slower global growth, keeping the dollar steady and prompting potential short-term corrections before continuation.
🔎 Technical Analysis (H1/H4)
Price structure shows a clean Break of Structure (BOS) to the upside following a higher-low formation. The market is currently reacting near premium liquidity at 4068–4066, where a rejection could trigger a retracement toward the discount buy zone at 3969–3971 before resuming the bullish leg.
🟢 Buy Zone: 3969–3971 (Discount Demand / FVG) – potential re-entry area for continuation buyers.
🔴 Sell Zone: 4068–4066 (Premium Liquidity) – possible engineered sweep zone for short-term sellers.
🔑 Key Levels
• BUY Zone: 3969–3971 (main support 3960)
• SELL Zone: 4068–4066 (liquidity pool)
• Psychological Resistance: 4070
• Intraday Pivot: 4035
💡 Trading Scenarios & Plan
🟢 BUY ZONE: 3969–3971
SL: 3960
TP: 3980 – 3990 – 4005 – 4020 – 4035+
🔴 SELL ZONE: 4068–4066
SL: 4075
TP: 4050 – 4035 – 4020 – 4000
⚠️ Risk Management Notes
Expect liquidity sweeps near 4068 before the U.S. session. Wait for lower-timeframe confirmation (ChoCH / BOS) before entry.
Volatility may spike around the Fed minutes, so partial profits and tight stop management are advised.
✅ Summary
Gold remains structurally bullish above 3960, with intraday retracements likely before continuation.
Ryan_TitanTrader anticipates buy reactions around 3970 and short-term rejections at 4068, aligning with the current SMC structure and macro catalysts ahead of FOMC updates.
🔔 Follow Ryan_TitanTrader for live setups, liquidity plays, and real-time gold structure updates!
