Gold 1H – Pullback Expected Before Key CPI Data💎 XAUUSD – Intraday Trading Plan | Ryan_TitanTrader
📈 Market Context
Gold is stabilizing below the $4,000 mark as traders await this week’s U.S. CPI data and fresh remarks from the Federal Reserve. After a strong multi-week rally, the metal is showing early exhaustion near premium liquidity zones, where engineered pullbacks often occur before continuation.
While the mid-term bias remains bullish, several analysts — including those from Citi and UBS — caution that gold could face short-term corrections if the dollar regains strength. The market continues to price in around a 65% probability of a December rate cut, keeping volatility elevated and sentiment uncertain.
🔎 Technical Analysis (H1/H4)
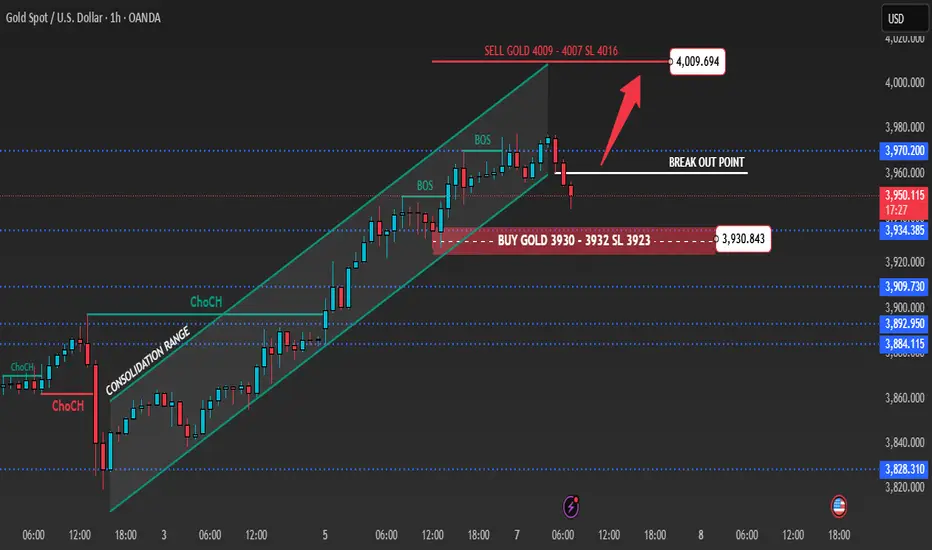
Price has slipped slightly below the ascending channel after consecutive BOS signals, indicating a potential short-term retracement before resuming the uptrend.
🟢 Buy Zone: 3932–3930 (Breakout & FVG zone) – an ideal discount area where buyers may re-enter the market.
🔴 Sell Zone: 4009–4007 (Premium liquidity) – a key region for short setups if price rejects strongly.
🔑 Key Levels
• BUY Zone: 3932–3930 (main support 3923)
• SELL Zone: 4009–4007 (liquidity reaction area)
• Psychological Resistance: 4000
💡 Trading Scenarios & Plan
🟢 BUY ZONE: 3932–3930
SL: 3923
TP: 3945 – 3955 – 3965 – 3975 – 3980+
🔴 SELL ZONE: 4009–4007
SL: 4016
TP: 3995 – 3980 – 3975 – 3965 – 3955
⚠️ Risk Management Notes
The 4000–4010 region acts as a high-liquidity magnet, where false breakouts and engineered sweeps may occur before reversals.
Wait for lower-timeframe confirmation (BOS or rejection candle) before entry.
Avoid overleveraging ahead of CPI — expect volatility spikes and rapid shifts in sentiment.
✅ Summary
Gold remains structurally bullish but vulnerable to intraday retracements near 4009–4007. Ryan_TitanTrader anticipates potential buy reactions from 3932–3930 and short-term rejections near 4009–4007. Holding above 3923 keeps the bullish outlook intact with upside targets toward 3970–3980.
🔔 Follow Ryan_TitanTrader for real-time updates, live setups, and advanced SMC insights as gold reacts to CPI data this week!
Goldprediction
Gold 1H – Liquidity Plays Between 3794 and 3918Gold on the 1H timeframe is fluctuating within a defined range after multiple ChoCH signals, with liquidity concentrated at both premium supply and discount demand. Current price action suggests engineered sweeps remain likely: upside liquidity sits near 3918–3916, while downside support aligns with 3794–3796. This dual structure sets up both tactical sell and buy plays depending on liquidity grabs.
From the macro perspective, gold traders are balancing caution ahead of upcoming U.S. data releases with the backdrop of a resilient dollar and persistent geopolitical risks. These drivers reinforce intraday volatility, where engineered liquidity hunts at extremes provide clearer opportunities.
⸻
📌 Key Structure & Liquidity Zones (1H):
• 🔴 SELL GOLD 3918–3916 (SL 3925): Premium supply sweep zone. Downside targets at 3896 → 3872 → 3853.
• 🟢 BUY GOLD SUPPORT 3794–3796 (SL 3788): Discount demand aligned with structural lows. Upside targets at 3819 → 3853 → 3872+.
⸻
📊 Trading Ideas (Scenario-Based):
🔻 Sell Setup – Liquidity Grab at 3918–3916
• Entry: 3918–3916
• Stop Loss: 3925
• Take Profits:
• TP1: 3896
• TP2: 3872
• TP3: 3853
🔺 Buy Setup – Discount Demand at 3794–3796
• Entry: 3794–3796
• Stop Loss: 3788
• Take Profits:
• TP1: 3819
• TP2: 3853
• TP3: 3872+
⸻
🔑 Strategy Note
Gold remains liquidity-driven and range-bound, with engineered sweeps expected at both premium highs and discount lows. Flexibility is crucial: fade rallies into the 3918 supply zone, while preparing to scale into longs if liquidity clears into the 3794 demand base.

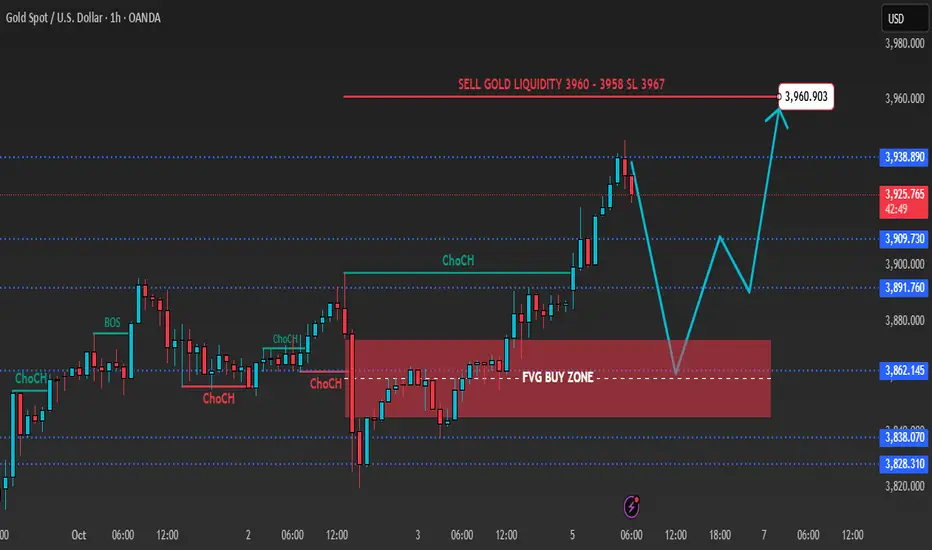
Gold 1H – Will CPI Repricing Push Gold Into FVG Reversal?Gold on the 1H timeframe is reacting near 3,928 after a clean structure break and buildup toward the premium zone 3960–3958, where liquidity remains above recent highs. Market structure shows a bullish impulse leg forming, but engineered sweeps at premium supply are likely before continuation. The defined FVG buy zone around 3840–3842 marks discount territory for potential re-entry if price retraces deeper.
From the macro side, gold is consolidating as traders brace for this week’s U.S. CPI data and renewed Treasury yield volatility. The dollar’s firm tone and cautious risk sentiment following stronger U.S. job figures are keeping gold capped near short-term supply. Still, geopolitical tensions and central-bank demand continue to provide underlying support, reinforcing the buy-on-dip narrative toward year-end.
________________________________________
📌 Key Structure & Liquidity Zones (1H):
• 🔴 SELL GOLD 3960–3958 (SL 3967): Premium liquidity sweep zone targeting retracement toward 3940 → 3900.
• 🟢 BUY ZONE 3840–3842 (SL 3833): Discount demand and FVG mitigation aligned with higher-timeframe support. Upside targets 3860 → 3880 → 3900+.
________________________________________
📊 Trading Ideas (Scenario-Based):
🔻 Sell Setup – Liquidity Sweep at 3960–3958
• Entry: 3960–3958
• Stop Loss: 3967
• Take Profits:
• TP1: 3940
• TP2: 3920
• TP3: 3900
🔺 Buy Setup – FVG Mitigation at 3840–3842
• Entry: 3840–3842
• Stop Loss: 3833
• Take Profits:
• TP1: 3860
• TP2: 3880
• TP3: 3900+
________________________________________
🔑 Strategy Note
Gold remains liquidity-driven within a mid-range structure. Expect engineered sweeps into 3960–3958 before deeper pullbacks into discount demand near 3840–3842. Tactical bias favors fading rallies at premium while preparing to join the continuation move from discount FVG support if CPI-related volatility clears the liquidity pools.
GOLD@ 3890 : Bubble Peak or Just a Pit-Stop?Pullback vs. Correction The 100th-Idea Deep Dive !!
Gold has moved almost 88% in the last two years to new records. The main drivers are falling real yield expectations with an easing bias, persistent geopolitical risk, record central bank buying and the 2025 rebound in ETF demand.
Geopolitics is shifting as Washington pushes for a Gaza ceasefire. Headlines talk about partial acceptance and ultimatums but nothing is done yet. The war premium can fade step by step though headline shocks will still remain.
Key levels:-
Resistance 3890–4000
Pullback zone 3640–3650 (5%)
Correction zone 3475–3480 (11%)
Weekly RSI stretched into high 70s and 80s → risk of mean reversion before any bigger change.
Macro gears:-
Real yields and the dollar:-
Lower real yields = higher gold. That is the key lever. As rate cuts and softer real rates were priced into 2025, gold repriced hard.
Central bank sponsorship:-
Official demand has been consistent three years in a row. 2022 at 1082t, 2023 at 1037t, 2024 at 1045t. This is rare in modern data and explains why dips are shallow.
ETF flows:-
After outflows in 2024, 2025 turned. Three straight months of inflows into August, strongest since 2020, YTD around 588t. Pure fuel ✨
Geopolitics & the premium:-
From 2023 to 2025 Middle East risk kept term premia elevated. Now Gaza peace talks open a path for that premium to fade. But timelines and enforcement are unclear. Strikes still came even with peace headlines. Means the bleed can be gradual but headline spikes remain..
Pullback or true correction:-
3890–4000 is the confluence zone. Psychological milestone + vertical extension after 88% impulse. Bubble behavior meets supply.
Level 1 at 3640 → about -5% pullback. If bids hold, trend resumes.
Level 2 at 3470→ -10 to -12% wash into prior shelf. Would be first real reset in two years.
Weekly momentum overbought. Phases like this don’t end instantly but forward returns improve after reset.
Flows @ CBs rarely chase tops, they buy weakness across months. That softens drawdowns.
ETFs are flighty. Peace plus firmer yields can stall inflows. Any Fed pivot or growth wobble can flip them back fast.
Possible future paths :-
Continuation bubble :- Break 3900 → 4050–4200
Triggers dovish Fed, softer yields, failed peace, ETF flows
Tactic = only add above 3900 on daily/weekly close. No chasing wicks.
Shallow pullback :-Tag 3630–3660 then rotate
Triggers peace holds, modestly firm yields, demand returns
Tactic = scale in near 3640–3650 if H4 shows higher low + reclaim POC. First TP 3780–3820.
True correction :- flush 3520–3460
Triggers Gaza settlement + real yields higher + ETF stall
Tactic = let it wash. Look for capitulation + basing 3480–3460. Best R:R after failed bounce and reclaim.
Levels & invalidation:-
Bull continuation pivot 3890–3900. Opens 4050–4200.
Pullback buy zone 3630(Hvz)–3650 with confirmation. Invalidation H4 <3600.
Correction buy zone 3480 ±20 after basing. Invalidation weekly <3420 → opens 3300–3350.
If flat → stagger entries and size carefully.
If long from lower → trail under last daily HL, book partial 3880–3950.
Surprise risk (Imp) ETF squeeze higher – inflows still not at 2020 peak → late cycle melt-up possible.
Policy shock – faster cuts or fiscal noise sink yields = blow-off. Strong data → pop in yields = sharp air pocket.
Geopolitical whipsaw – peace unravels → $50–100 spike in thin tape!!
Bottom line:-
This is a two year vertical impulse meeting macro reality at 3890.
Level 1 = 3640–3650 pullback line.
Level 2 = 3480 correction line.
Until weekly breaks, dips are still opportunities not obituaries. But only with structure. No blind catching this high up.
Bubbles don’t end quietly – great trends reset then go again ✨
Fade euphoria into 39xx if momentum stalls. Buy fear into 348x if the market finally delivers the reset it owes.
Trade safe ⚡
Sparkrlight ♾️✨⚡

Gold 1H – Will Liquidity Above 3903 Fuel Reversal?Gold on the 1H timeframe is consolidating near 3,872 after multiple ChoCHs, with the next liquidity cluster resting above 3903–3901. Market structure shows engineered liquidity sweeps possible at premium supply, aligning with short-term sell opportunities. On the downside, a defined FVG buy zone and discount demand around 3832–3834 provide scope for continuation if tapped.
From the macro side, traders remain cautious ahead of upcoming U.S. economic data, while a resilient dollar and persistent geopolitical risks in energy markets continue to shape volatility. This backdrop supports tactical plays: fading rallies into premium supply while preparing to join the move from discount demand zones.
________________________________________
📌 Key Structure & Liquidity Zones (1H):
• 🔴 SELL GOLD 3903–3901 (SL 3910): Premium liquidity sweep zone. Downside targets at 3880 → 3860 → 3845.
• 🟢 BUY ZONE SUPPORT 3832–3834 (SL 3825): Discount demand aligned with FVG mitigation. Upside targets at 3855 → 3875 → 3890+.
________________________________________
📊 Trading Ideas (Scenario-Based):
🔻 Sell Setup – Liquidity Sweep at 3903–3901
• Entry: 3903–3901
• Stop Loss: 3910
• Take Profits:
• TP1: 3880
• TP2: 3860
• TP3: 3845
🔺 Buy Setup – FVG Mitigation at 3832–3834
• Entry: 3832–3834
• Stop Loss: 3825
• Take Profits:
• TP1: 3855
• TP2: 3875
• TP3: 3890+
________________________________________
🔑 Strategy Note
Gold remains range-bound but liquidity-driven. Expect engineered sweeps above 3903 before deeper corrections, while discounted dips into 3832–3834 offer potential continuation setups. Flexibility is key: fade rallies at premium, but scale into buys if liquidity clears into discount demand.

Gold 1H – Correction or Continuation After Supply Test?Gold on the 1H timeframe is trading near 3,861 after consolidating below a premium supply zone at 3876–3874. Structure shows a recent BOS to the upside, but current rejection signals potential engineered liquidity sweeps into the nearby FVG and discount demand zones. The first support rests at 3796–3798, aligning with discount territory and previous accumulation, offering scope for continuation if price reacts positively.
From the macro side, today’s headlines point to persistent U.S. dollar strength as traders await fresh Federal Reserve guidance on inflation and rate path. Meanwhile, heightened geopolitical concerns in energy markets are maintaining safe-haven flows, adding volatility to gold’s intraday swings.
This dual backdrop sets up a tactical approach: fading rejections at supply while being prepared to enter on discounted dips at demand.
________________________________________
📌 Key Structure & Liquidity Zones (1H):
• 🔴 SELL GOLD 3876–3874 (SL 3883): Premium supply zone, downside targets at 3850 → 3835 → 3815.
• 🟢 BUY ZONE SUPPORT 3796–3798 (SL 3790): Discount demand zone aligned with BOS, upside targets at 3820 → 3845 → 3860+.
________________________________________
📊 Trading Ideas (Scenario-Based):
🔻 Sell Setup – Supply Rejection (3876–3874)
• Entry: 3876–3874
• Stop Loss: 3883
• Take Profits:
TP1: 3850
TP2: 3835
TP3: 3815
🔺 Buy Setup – Demand Mitigation (3796–3798)
• Entry: 3796–3798
• Stop Loss: 3790
• Take Profits:
TP1: 3820
TP2: 3845
TP3: 3860+
________________________________________
🔑 Strategy Note
Gold remains in a corrective phase after testing supply. Expect liquidity sweeps into discount levels before continuation. With the dollar strengthening and Fed commentary in focus, intraday traders should:
• Fade supply rejections at 3876–3874.
• Scale into buys around 3796–3798 if liquidity is cleared.

Gold 1H – Will the Breakout from Range Sustain?Gold on the 1H timeframe has broken out of its previous consolidation range and is now testing a premium supply zone near 3828–3826. The structure shows a clear BOS after the range, supported by strong bullish momentum. However, engineered liquidity sweeps remain likely before the market establishes sustained direction.
From the macro side, today’s headlines highlight persistent inflation worries and a stronger U.S. dollar as traders anticipate upcoming remarks from Federal Reserve officials. Geopolitical tensions in energy markets have also underpinned safe-haven flows, adding volatility to gold price action.
This alignment of macro drivers and technical liquidity pools suggests two tactical scenarios: fading rejections at supply while preparing to buy dips into the defined demand zone.
________________________________________
📌 Key Structure & Liquidity Zones (1H):
• 🔴 SELL GOLD 3828–3826 (SL 3835): Premium supply zone with upside liquidity sweep potential, offering downside targets at 3810 → 3790 → 3775.
• 🟢 BUY GOLD 3757–3759 (SL 3750, Demand Zone): Discount demand area aligned with BOS, with upside targets at 3765 → 3780 → 3795+.
________________________________________
📊 Trading Ideas (Scenario-Based):
🔻 Sell Setup – Supply Rejection (3828–3826)
• Entry: 3828–3826
• Stop Loss: 3835
• Take Profits:
TP1: 3810
TP2: 3790
TP3: 3775
🔺 Buy Setup – Demand Mitigation (3757–3759)
• Entry: 3757–3759
• Stop Loss: 3750
• Take Profits:
TP1: 3765
TP2: 3780
TP3: 3795+
________________________________________
🔑 Strategy Note
Gold remains volatile after breaking out of consolidation. Expect engineered sweeps into both supply and demand zones before directional clarity develops. With macro headlines keeping the dollar firm and inflation risks alive, traders should watch for sharp intraday reversals:
• Fade supply rejections if momentum stalls at 3828–3826.
• Buy dips into demand if liquidity is swept cleanly around 3757–3759.
The broader narrative supports a two-sided strategy until the Fed provides clearer guidance.

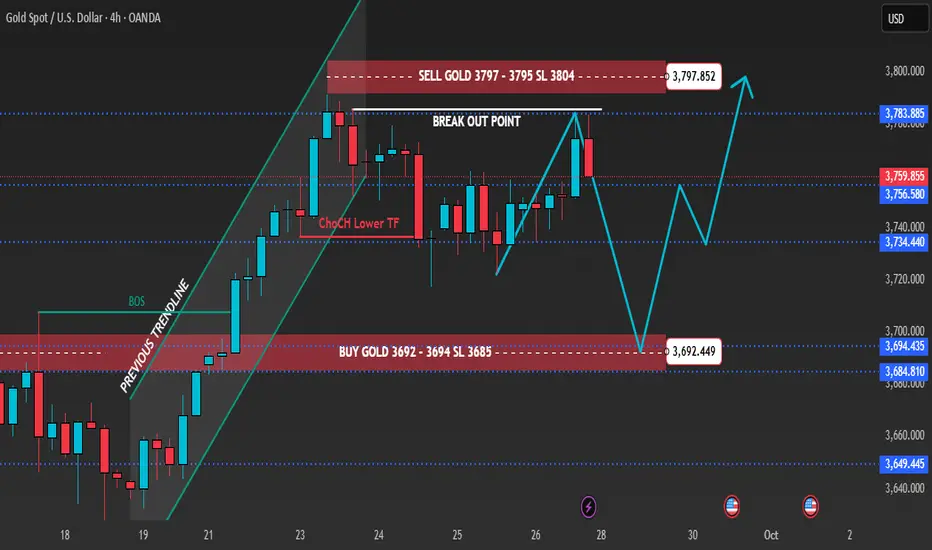
Back to 4H Frame – Fed & Inflation Shape Gold PathGold on the 4H timeframe is consolidating near premium supply after multiple liquidity sweeps. Recent U.S. inflation data kept the dollar resilient, while traders anticipate upcoming Fed commentary for clearer policy direction. Price rejected from the 3,795 supply pocket and is now retracing toward discount demand zones. Market structure suggests engineered sweeps below support before bullish continuation into Q4.
________________________________________
📌 Key Structure & Liquidity Zones (4H):
• 🔼 Buy Zone 3,692 – 3,694 (SL 3,685): Discount demand aligned with liquidity grab, ideal for continuation longs.
• 🔽 Sell Zone 3,795 – 3,797 (SL 3,804): Premium supply pocket where liquidity sweeps may trigger short-term rejections.
________________________________________
📊 Trading Ideas (Scenario-Based):
🔺 Buy Setup – Discount Demand Reaction
• Entry: 3,692 – 3,694
• Stop Loss: 3,685
• Take Profits:
TP1: 3,715
TP2: 3,740
TP3: 3,760+
👉 Smart money may engineer a sweep below 3,694 before reversing higher. Watch for bullish rejection patterns at demand.
🔻 Sell Setup – Premium Supply Reaction
• Entry: 3,795 – 3,797
• Stop Loss: 3,804
• Take Profits:
TP1: 3,780
TP2: 3,765
TP3: 3,750
👉 Short-term liquidity scalp opportunity against trend. Valid if price fails to break above breakout point.
________________________________________
🔑 Strategy Note
Bias remains bullish medium-term, but intraday sweeps into demand zones are expected as Fed officials continue to push cautious monetary guidance. Liquidity hunts around 3,795 supply and 3,694 demand will likely define the week’s volatility before a decisive breakout.
Traders Watch Gold Surge Ahead of Fed’s Next MoveGold 1H – Consolidation Before Fed Clarity
Gold on the 1H timeframe is currently trading around 3,746, moving within a well-defined consolidation range. Price action highlights a premium supply zone at 3,775–3,773 and a discount demand zone at 3,723–3,725. The market structure shows earlier signs of BOS and ChoCH, with engineered liquidity sweeps becoming evident. A potential Mitigation → Expansion sequence is in play, where a liquidity grab near discount demand could fuel a bullish leg toward premium supply.
From a macro perspective, today’s headlines underscore the cautious stance across financial markets as investors await the Federal Reserve’s upcoming guidance. Lingering inflationary concerns, coupled with speculation around the timing of future rate cuts, have kept volatility elevated. Meanwhile, geopolitical risks continue to underpin safe-haven demand for gold, adding an extra layer of support at discount levels.
This combination of technical liquidity zones and macro uncertainty sets the stage for tactical plays: fading moves into the supply zone while remaining prepared for dip-buying opportunities at defined demand areas.
________________________________________
📌 Key Structure & Liquidity Zones (1H):
• 🔴 SELL GOLD 3,775–3,773 (SL 3,782): Supply zone coinciding with a buy-side liquidity pool above 3,780, offering downside targets at 3,760 → 3,745 → 3,730.
• 🟢 BUY GOLD 3,723–3,725 (SL 3,718): Discount demand aligned with liquidity grab potential, with upside targets at 3,745 → 3,760 → 3,775+.
________________________________________
📊 Trading Ideas (Scenario-Based):
🔻 Sell Setup – Supply Rejection (3,775–3,773)
• Entry: 3,775–3,773
• Stop Loss: 3,782
• Take Profits:
TP1: 3,760
TP2: 3,745
TP3: 3,730
🔺 Buy Setup – Demand Mitigation (3,723–3,725)
• Entry: 3,723–3,725
• Stop Loss: 3,718
• Take Profits:
TP1: 3,745
TP2: 3,760
TP3: 3,775+
________________________________________
🔑 Strategy Note
With the Fed’s next move looming, traders should anticipate engineered sweeps into both premium and discount liquidity pools before the market establishes clearer direction. The tactical edge comes from aligning intraday setups with liquidity hunts:
• Fade supply at 3,775–3,773 if rejection confirms.
• Buy dips into 3,723–3,725 if liquidity is swept cleanly.
The broader narrative of inflation concerns, dollar sensitivity, and safe-haven flows reinforces the case for two-sided opportunities. Expect gold to remain volatile within this consolidation range, with sharp moves likely as liquidity is targeted ahead of Fed clarity.

Gold Trade Plan - Nov ExpirtyMCX:GOLDM1! Might give entry once again. Booked more than 10R in last trade. Let's see how it goes.

Wave 5 is about to start – today just time your Buy right!📊 Wave Perspective
The market is still following the scenario of one more wave 5 increase.
It is expected that on Friday morning, the price may move around 3765 to confirm the continuation trend.
After confirmation, there will be 2 important zones to time your Buy for the big wave.
✅ Trading Plan
Zone 1: High Entry – Main Priority
Entry: 3749 – 3751
SL: 3746
TP: 3792
This is the first buying point, suitable for those who want to enter the wave early following the trend.
Zone 2: Backup Entry – Last Support
Entry: 3738 – 3736
Maximum SL: 3730
TP: 3792
This is a strong support zone, if the price breaks zone 1, this will be the "timing" zone to re-enter.
Note: Since this is a backup entry, reduce Lot size, widen SL a bit, and tighten SL when the price matches to optimize risk.
📌 Capital Management Note
Every order must comply with SL to avoid risks.
Prioritize entering orders according to the big wave plan, avoid FOMO.
EA setup: should be set to Only Buy according to the upward wave perspective.
Analysis perspective is for reference only, combine with personal view before entering orders.
🎯 Expectation
If the scenario is correct, the price may complete wave 5 at target 3792.
Upon reaching TP, partial take profit can be done to secure profits.

Gold 1H – Will Gold Correction Extend Toward Discount Zones?Gold on the 1H timeframe is trading close to 3,745 after a series of bearish pushes, with premium resistance placed at 3,780–3,778 and another resistance pocket at 3,748–3,746. On the downside, discount demand is noted at 3,713–3,706, with a deeper support near 3,665. Recent CHoCH signals highlight short-term bearish bias, indicating that liquidity sweeps into resistance zones may occur before price retraces towards discount areas.
Today’s headlines around renewed U.S. inflation concerns and expectations of a slower Fed pivot are dampening sentiment, while geopolitical tensions in the Middle East continue to support safe-haven bids. This combination is likely to keep intraday volatility elevated, with liquidity grabs around resistance zones expected before a clearer directional move emerges.
________________________________________
📌 Key Structure & Liquidity Zones (1H):
• 🔴 SELL GOLD LIQUIDITY 3,780–3,778 (SL 3,787): Premium resistance where sweeps may trigger rejection toward 3,760 → 3,740 → 3,730.
• 🔴 SELL GOLD 3,748–3,746 (SL 3,755): Intraday resistance aligned with 0.5–0.618 retracement, targeting 3,730 → 3,720 → 3,715.
• 🟢 BUY ZONE 3,697–3,699 (SL 3,692): Discount demand with liquidity confluence, offering upside targets at 3,715 → 3,730 → 3,745+.
________________________________________
📊 Trading Ideas (Scenario-Based):
🔻 Sell Setup – Liquidity Run (3,780–3,778)
• Entry: 3,780–3,778
• Stop Loss: 3,787
• Take Profits:
TP1: 3,760
TP2: 3,740
TP3: 3,730
🔻 Sell Setup – Intraday Rejection (3,748–3,746)
• Entry: 3,748–3,746
• Stop Loss: 3,755
• Take Profits:
TP1: 3,730
TP2: 3,720
TP3: 3,715
🔺 Buy Setup – Discount Demand (3,697–3,699)
• Entry: 3,697–3,699
• Stop Loss: 3,692
• Take Profits:
TP1: 3,715
TP2: 3,730
TP3: 3,745+
________________________________________
🔑 Strategy Note
With U.S. inflation concerns and geopolitical risks creating mixed drivers for gold, intraday strategies can look to fade liquidity sweeps into premium resistance while keeping an eye on buy opportunities from well-defined discount demand zones. Expect sharp moves around 3,780 liquidity grabs before corrections extend down into the 3,713–3,706 area.

XAUUSD SHOWING A GOOD DOWN MOVE WITH 1:10 RISK REWARDXAUUSD SHOWING A GOOD DOWN MOVE WITH 1:10 RISK REWARD DUE TO THESE REASON
A. its following a rectangle pattern that stocked the marketwhich preventing the market to move any one direction now it trying to break the strong resistant lable
B. after the break of this rectangle it will boost the market potential for breakC. also its resisting from a strong neckline the neckline also got weeker ald the price is ready to break in the outer region
all of these reason are indicating the same thing its ready for breakout BREAKOUT trading are follws good risk reward
please dont use more than one percentage of your capitalfollow risk reward and tradeing rules that will help you to to become a bettertrader
thank you

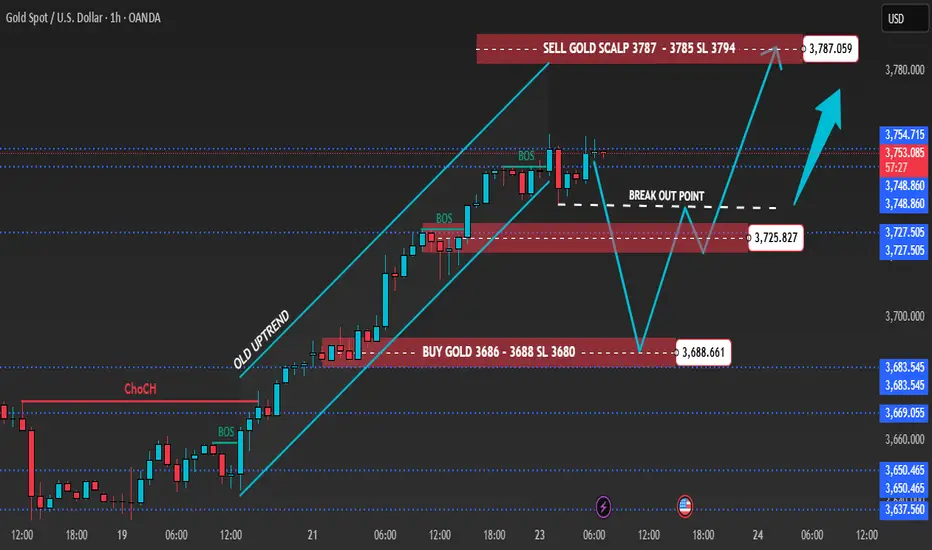
Gold 1H – Inflation Worries & Risk Sentiment Guide MovesGold on the 1H chart is hovering near 3,753 after multiple BOS confirmations, holding a firm bullish bias yet approaching premium resistance. Liquidity sits above 3,787–3,785, while fresh demand zones are placed at 3,725–3,723 and deeper at 3,688–3,686.
Today’s narrative around sticky U.S. inflation expectations and renewed geopolitical tensions in Eastern Europe is boosting safe-haven appetite. Still, intraday price action suggests possible liquidity sweeps into resistance before price retraces back towards demand zones.
________________________________________
📌 Key Structure & Liquidity Zones (1H):
• 🔴 SELL SCALP 3,787–3,785 (SL 3,794): Premium resistance where liquidity runs may spark short-term selling towards 3,780 → 3,775 → 3,770.
• 🟢 BUY ZONE 3,725–3,723 (SL 3,718): Pullback demand aligned with structure, favouring longs towards 3,740 → 3,755 → 3,770+.
• 🟢 BUY ZONE 3,688–3,686 (SL 3,680): Deeper discount demand area, attractive for positional buys targeting 3,700 → 3,715 → 3,730+.
________________________________________
📊 Trading Ideas (Scenario-Based):
🔺 Buy Setup – Pullback Demand (3,725–3,723)
• Entry: 3,725–3,723
• Stop Loss: 3,718
• Targets:
TP1: 3,740
TP2: 3,755
TP3: 3,770+
🔺 Buy Setup – Discount Demand (3,688–3,686)
• Entry: 3,688–3,686
• Stop Loss: 3,680
• Targets:
TP1: 3,700
TP2: 3,715
TP3: 3,730+
🔻 Sell Setup – Liquidity Sweep (3,787–3,785)
• Entry: 3,787–3,785
• Stop Loss: 3,794
• Targets:
TP1: 3,780
TP2: 3,775
TP3: 3,770
________________________________________
🔑 Strategy Note
Rising inflation concerns and safe-haven flows from geopolitical risks are keeping gold buyers in play. However, smart money could drive engineered stop-hunts near premium resistance before retracements set in. The bias remains buy-on-dips around key supports, while short-term scalps against liquidity sweeps near 3,787–3,785 should be approached with caution. Volatility is expected as markets digest U.S. inflation updates and risk headlines.
BUYER FOMO: BREAK ALL THE RULES📌 GOLD – Trading Plan OANDA:XAUUSD
Follow Signals On weekend Linda published you got SELL PLAN 3720 +120PIPS
Absolutely that up first down after:
1. Market Context (H1)
Main trend: Bullish (following several upward BOS).
The price has just broken the peak and created new liquidity above the 3715 – 3720 zone.
Below, there are CP Orders + FVG at 3693 / 3669 / 3650 → the price may retrace to test demand before continuing to rise.
Above: the 3749 – 3750 zone is a strong resistance, likely to see liquidity sweeps.
2. Main Scenario – BUY with the trend
Entry 1: CP ORDER + Trend Timing
Zone: 3693 – 3695.
Stoploss: 3685.
TP1: 3715.
TP2: 3730+.
R:R ratio: ~1:3.
Entry 2: Deeper CP ORDER
Zone: 3669 – 3670.
Stoploss: 3660.
TP1: 3710.
TP2: 3730+.
R:R: ~1:4.
Entry 3: Final FVG
Zone: 3650 – 3655.
Stoploss: 3640.
TP: 3710 – 3720.
This is the final entry; if it breaks, consider the trend reversed.
3. Alternative Scenario – SELL counter-trend (scalp)
Entry Sell
Zone: 3749 – 3750 (resistance + liquidity).
Stoploss: 3757.
TP1: 3730 – 3735.
TP2: 3695 – 3670 (if selling pressure is strong).
Confirmation required on M5/M15:
MSS down.
Bearish engulfing.
Long wick rejection.
4. Capital Management
Total risk for the day: max 3 – 4% of the account.
Each trade risk 1 – 1.5%.
Prioritize Buy, Sell is just a small scalp.
If the price hits TP1 → move SL to entry, let the rest run.
5. Notes
Main trend: Bullish, don't attempt too many counter-sells.
Only sell when clear signals appear at 3749 – 3750.
The 3693/3669 mark is a key zone → if it breaks strongly, wait for trend confirmation.

Gold 1H – Should We Hold or Fade Liquidity at 3800?On the 1-hour timeframe, gold is trading near 3,776 within a corrective channel. Premium liquidity remains clustered above 3,800–3,798, while discount demand is positioned at 3,725–3,727. Recent BOS (Break of Structure) signals confirm bullish intent, but engineered sweeps into premium zones are still likely before price retraces toward discount levels.
Today’s headlines on the Federal Reserve’s cautious approach and ongoing geopolitical tensions in the Middle East are reinforcing safe-haven demand. However, intraday volatility may continue to produce liquidity grabs before clear direction is established.
________________________________________
📌 Key Structure & Liquidity Zones (1H)
• 🔴 SELL GOLD LIQUIDITY 3,800–3,798 (SL 3,807):
Premium resistance where liquidity sweeps may cause rejections towards 3,770 → 3,760 → 3,755.
• 🟢 BUY ZONE 3,725–3,727 (SL 3,720):
Discount demand in line with BOS, with upside targets at 3,740 → 3,760 → 3,775.
________________________________________
📊 Trading Ideas (Scenario-Based)
🔻 Sell Setup – Liquidity Run (3,800–3,798)
• Entry: 3,800–3,798
• Stop Loss: 3,807
• Take Profits:
o TP1: 3,770
o TP2: 3,760
o TP3: 3,755
🔺 Buy Setup – Discount Demand (3,725–3,727)
• Entry: 3,725–3,727
• Stop Loss: 3,720
• Take Profits:
o TP1: 3,740
o TP2: 3,760
o TP3: 3,775+
________________________________________
🔑 Strategy Note
With the Fed’s cautious stance and geopolitical risks supporting gold, the broader bias remains buy-the-dip. At the same time, fading engineered sweeps into premium liquidity zones can offer tactical short-term opportunities. Expect volatility around 3,800 liquidity runs before retracements into well-defined discount zones.

Gold’s Medium-Term Play: From Momentum Peaks to Reload Zones!!Gold’s rally has been relentless, breaking out of ranges and pressing higher into the 3750s. That strength reflects the macro backdrop where the Fed is walking a fine line: inflation is sticky, growth signals are uneven, and market expectations are already pricing a deeper rate-cut cycle. Yields have softened, the dollar has lost some shine, and capital continues to flow into safe-haven trades. All of this leaves gold well supported in the medium term, though the path forward will not be a straight line.
Target Zone (3827–3840):
The immediate stretch for bulls sits higher around 3827–3840. This is where the rally could stall as momentum traders lock in profits. A clean break and hold above this zone would open the door to new all-time highs, but the market could just as easily treat it as a ceiling before pulling back.
Hidden Bounce Zone (3720–3680):
Sitting just under the current price is a pocket that often acts as a liquidity trap. Markets can bounce sharply from here or slice through with equal speed. For active trades this zone will give the first clue whether momentum is running out of steam.
High-volume Zone (3630):
This level is the backbone of the current structure. Holding above it keeps the broader trend intact. A decisive break below, however, signals that the correction phase has started and the market is hunting for deeper liquidity.
Correction Band (3600–3560):
If gold slips into this range, expect chop and sideways action as weak longs get flushed out and new buyers gradually step in. This zone isn’t where the story ends, but where the market catches its breath.
Medium-Term Reload Zone (3440–3480):
This is the level that matters for swing trades. If a deeper washout comes, this area offers the opportunity to reload positions for the next major leg up. The medium-term backdrop still favors higher prices, with rate cuts, a weaker dollar, and central bank demand forming a strong tailwind.
Macro Picture
Fed Outlook: Committee members are split, but the overall tone is tilting toward easing as growth cracks widen. Powell may sound careful, yet markets are already betting on more cuts ahead.
Dollar and Yields: The dollar index remains pressured while U.S. yields edge lower, creating a supportive base for gold.
Global Flows: Central banks remain steady buyers, and geopolitical tensions continue to underpin safe-haven demand.
In short, gold has room to push into the 3827–3840 zone, but trades should prepare for corrective phases along the way. The hidden bounce pocket and HVZ will decide the near-term path. Should the market wash down into the 3440–3480 reload zone, it should be seen not as weakness, but as a prime setup to load into the medium-term bullish story. Trade safe!

Weekly Candle Closes High | Prioritise Buying on Pullback to Sup🟡 XAU/USD – 22/09 | Captain Vincent ⚓
🔎 Captain’s Log – Quick Overview
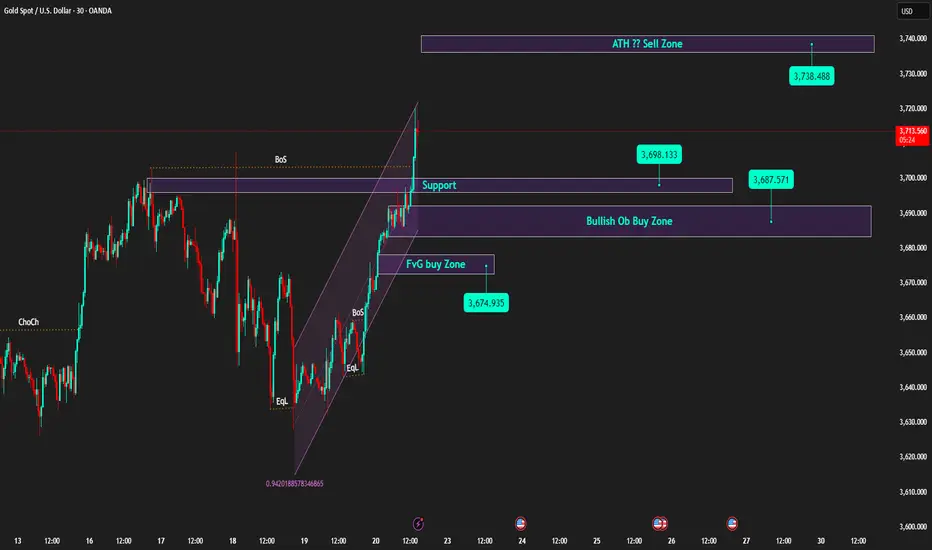
Last week, gold closed around 3,685, paving the way for further advancement and a new ATH.
After the FED cut 25bps, Powell's 'brake' remarks slowed the rise, but the larger trend remains bullish.
This morning, prices surged to 3,697.xx, now slightly adjusting around 3,692 – 3,690 → a sensible strategy: wait for a pullback to continue Buying.
⏩ Captain’s Summary: The gold voyage still heads North, Buying remains the main choice, but wait for a pullback to board.
📈 Captain’s Chart – Technical Analysis
Golden Harbor (Support / Buy Zone):
Thin support: ~3,698 (recently broken old range top).
OB Dock: 3,687 – 3,690.
FVG Dock: 3,672 – 3,676 (liquidity check on deep pullback).
Storm Breaker (Resistance / Sell Zone):
3,714 – 3,720 (supply cluster / old ATH – likely to react).
Price Structure:
Continuous BoS series, price breaks short-term up channel and creates higher highs → bullish remains the main trend.
🎯 Captain’s Map – Trading Plan (before US session)
✅ Buy (trend priority)
Buy Zone 1
Entry: 3,698 – 3,701
SL: 3,688
TP: 3,706 – 3,714 – 3,720+
Buy Zone 2 (OB)
Entry: 3,687 – 3,690
SL: 3,680
TP: 3,698 – 3,706 – 3,714 – 3,72x
Buy Zone 3 (FVG)
Entry: 3,672 – 3,676
SL: 3,664
TP: 3,687 – 3,706 – 3,714
⚡ Sell (only scalp when overbought)
Sell Zone (ATH test)
Entry: 3,740 – 3,738
SL: 3,750
TP: 3,730 – 3,690 – 3,695
Captain’s Note ⚓
“The new week kicks off with a high-closing candle, the gold vessel continues its bullish course. Golden Harbor 🏝️ (3,690 – 3,672) is a safe anchorage for the crew to watch for Buys. Storm Breaker 🌊 (3,714 – 3,720) is the wave crest where winds may rise, suitable for Quick Boarding 🚤 short scalps. Before the US session, the seas might get choppy – hold the helm tight and manage volume wisely.”
Gold 1H – Fed Signals & Geopolitics Keep Bulls on the MoveGold on the 1H timeframe is trading around 3,705–3,710 after a strong breakout, staying within a rising channel. Liquidity is concentrated above at the premium resistance zone near 3,716–3,718, while demand is positioned lower at 3,687–3,689 and deeper at the FVG zone 3,654–3,656. Recent dovish signals from the Fed following last week’s rate cut, coupled with rising geopolitical tensions, continue to bolster safe-haven demand. However, upcoming U.S. inflation data and Fed speakers could trigger engineered moves into premium supply before retracements into discount demand zones.
________________________________________
📌 Key Structure & Liquidity Zones (1H):
• 🔴 SELL ZONE 3,718–3,716 (SL 3,725): Premium resistance where liquidity sweeps may cause short-term rejections targeting 3,710 → 3,700 → 3,690.
• 🟢 BUY ZONE 3,687–3,689 (SL 3,680): Near-term demand zone aligned with channel structure, offering a pullback entry targeting 3,695 → 3,700 → 3,715+.
• 🟢 FVG BUY ZONE 3,654–3,656 (SL 3,647): Deeper discount support, attractive for longer setups targeting 3,670 → 3,685 → 3,700+.
________________________________________
📊 Trading Ideas (Scenario-Based):
🔺 Buy Setup – Pullback to Demand (3,687–3,689)
• Entry: 3,687–3,689
• Stop Loss: 3,680
• Take Profits:
TP1: 3,695
TP2: 3,700
TP3: 3,715+.
🔺 Buy Setup – FVG Sweep (3,654–3,656)
• Entry: 3,654–3,656
• Stop Loss: 3,647
• Take Profits:
TP1: 3,670
TP2: 3,685
TP3: 3,700+
🔻 Sell Setup – Premium Liquidity Run (3,716–3,718)
• Entry: 3,718–3,716
• Stop Loss: 3,725
• Take Profits:
TP1: 3,710
TP2: 3,700
TP3: 3,690.
________________________________________
🔑 Strategy Note
The Fed’s dovish stance and safe-haven flows from geopolitical risks are sustaining bullish momentum, but intraday structure suggests smart money may first engineer stop-runs into premium resistance before retracing toward demand. Maintain buy-the-dip bias at defined support zones, while cautiously fading liquidity sweeps near 3,716–3,718. Volatility could increase as markets await fresh U.S. inflation data and Fed policy remarks.

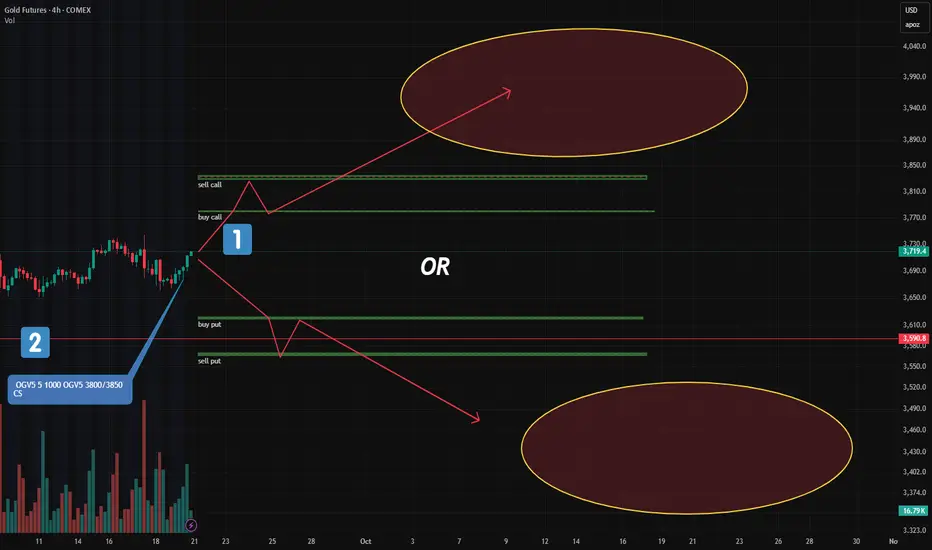
Gold: Major New Option Portfolios Signal Strong Moves AheadFriday’s CME report showed a surge in large option blocks in gold — two of them stand out.
🔹 1. "Long Condor" on December Futures (GCZ24)
This is the most significant structure added:
Targets a move below $3,620 or above $3,780
In other words: a breakout is expected, not consolidation
📌 Key point:
A "Long Condor" profits from volatility, not direction.
It wins if price moves sharply — up OR down — but loses if it stays flat.
🔹 2. Bull Call Spread (Oct Series): $3800–$3850
Another key play:
A classic bullish call spread at 3800/3850
Target: upside beyond current levels
But here’s the difference:
Unlike the "Long Condor", this one needs a clear upward move — and soon. Within a few days.
This isn’t about volatility.
It’s a directional bet that gold will rise.
🧠 Bottom Line:
One portfolio says: "Breakout coming — no matter which way."
Another says: "Gold goes up — and soon."
Are they aligned?
Contradictory?
Or could both win?
Trade smarter, not harder! Looking to boost your profits with valuable market insights and data-driven entry points? Join us or keep moving!
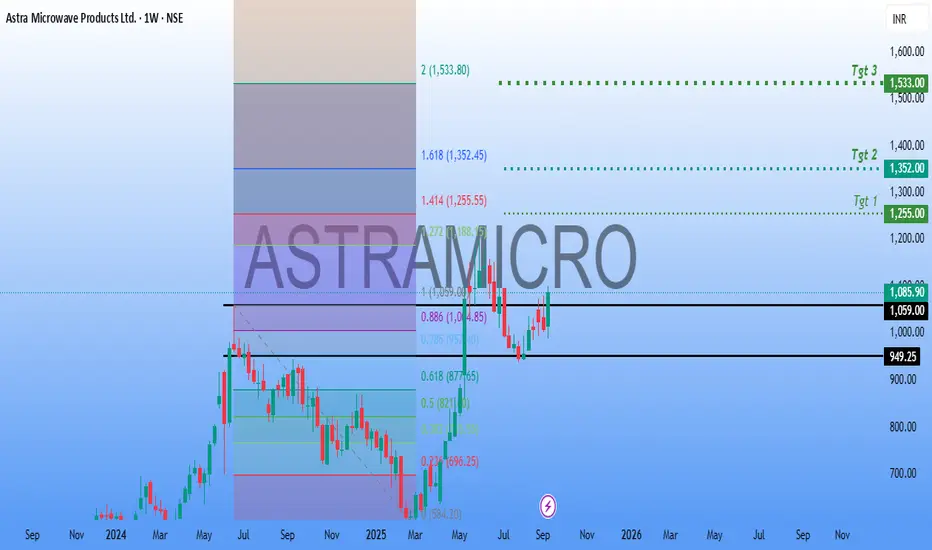
ASTRAMICROAnother #Defense #Stock in focus.
#ASTRAMICRO has a strong Technical Structure. Made a neat #breakout and consolidating at the Breakout levels.
Neat #Buyondips stock for #Short to #Longterm #Investment.
Targets in Chart.
GOLD – Breakout / Swept High – Where to BUY?1. Market Overview
Gold prices are consolidating around 3655 – 3660 after showing a short-term bearish structure.
On the H1 chart, we can see clear supply and demand zones:
• Liquidity Buy Zone near 3640 (potential demand area).
• Imbalance / Supply Zone around 3670 – 3680.
The broader higher-timeframe trend is still bullish, but in the near term the market is retesting liquidity levels.
________________________________________
2. Key Levels & Zones
• Liquidity Buy Zone: 3640 – 3645 → important support.
• Sell Scalp Zone / Imbalance: 3670 – 3680 → short-term resistance.
• Higher High Target (HH): 3700 – 3710 → strong higher-timeframe resistance.
• Long-term Support: 3620 – 3630.
________________________________________
3. Main Trading Scenarios
🟢 Long Setup (with trend)
• Wait for price to revisit the Liquidity Buy Zone (3640 – 3645).
• If bullish reversal signals appear (pin bar, engulfing candle, etc.), consider entering a Long position.
🎯 Targets:
• Short-term: 3678 (trendline break retest).
• Mid-term: 3700 – 3710 (higher high).
🔴 Short Setup (scalp only)
• If price pushes into the Sell Scalp Zone (3670 – 3680) and faces strong rejection → take a Short scalp.
• 🎯 Target: 3640 – 3645.
⚠ Note: Shorts go against the main bullish trend, so they should be managed quickly and not held for long.
________________________________________
4. Trade Management Notes
• Focus on Long trades near support, as higher timeframe bias is still bullish.
• Short positions should only be taken as scalp setups near resistance.
• Risk control: limit risk to 1–2% per trade, avoid holding trades against the main trend.
________________________________________
📌 Conclusion
Gold (XAUUSD) is currently testing the descending trendline and resistance zone.
• A successful breakout may lead price towards 3700+.
• Otherwise, the market is likely to dip back into 3640 before starting the next bullish leg.

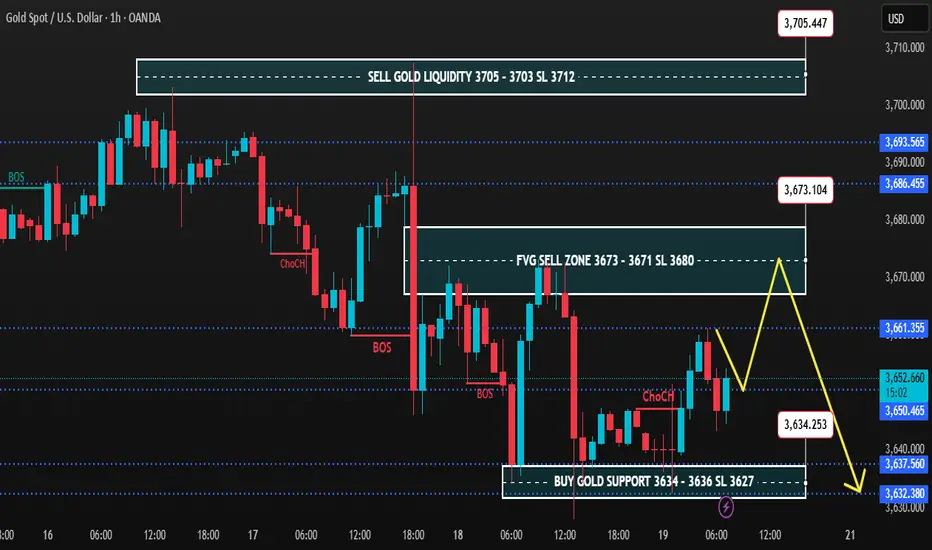
Gold 1H – Risk of Premium Sweeps Before ReversalOn the 1H timeframe, gold is consolidating after consecutive BOS and ChoCH signals, showing rejection from premium levels. The market is oscillating between the fresh FVG sell zone at 3,673–3,671 and the deep discount support at 3,634–3,636. Liquidity remains positioned above 3,705 and below 3,632, keeping scope for engineered sweeps before a clearer directional move emerges.
________________________________________
📌 Key Structure & Liquidity Zones (1H):
• 🔴 FVG SELL ZONE 3,673 – 3,671 (SL 3,680)
Premium intraday pocket for rejection, targeting 3,660 → 3,650 → 3,640.
• 🔴 SELL GOLD LIQUIDITY 3,705 – 3,703 (SL 3,712)
Major premium liquidity trap, likely to precede continuation lower towards 3,690 → 3,675 → 3,660.
• 🟢 BUY GOLD SUPPORT 3,634 – 3,636 (SL 3,627)
Discount demand zone, aiming for recovery towards 3,645 → 3,660 → 3,670 if defended.
________________________________________
📊 Trading Ideas (Scenario-Based):
🔻 Sell Setup – FVG Rejection (3,673–3,671)
• Entry: 3,673 – 3,671
• Stop Loss: 3,680
• Targets:
TP1: 3,660
TP2: 3,650
TP3: 3,640
👉 Expect engineered liquidity grab into the FVG before downside extension.
🔻 Sell Setup – Premium Liquidity Sweep (3,705–3,703)
• Entry: 3,705 – 3,703
• Stop Loss: 3,712
• Targets:
TP1: 3,690
TP2: 3,675
TP3: 3,660
👉 Smart money may sweep highs near 3,705 before resuming bearish leg.
🔺 Buy Setup – Discount Reversal (3,634–3,636)
• Entry: 3,634 – 3,636
• Stop Loss: 3,627
• Targets:
TP1: 3,645
TP2: 3,660
TP3: 3,670
👉 High risk-reward opportunity if gold defends discount demand; suitable for counter-trend scalps.
________________________________________
🔑 Strategy Note
Gold remains under pressure below 3,673–3,705, favouring short setups into premium sweeps. However, close attention is needed at 3,634–3,636, as buyers may attempt to accumulate and reclaim structure. Best practice: trade smaller lots until the New York session provides confirmation of direction.