XAU/USD(20250911) Today's AnalysisMarket News:
The U.S. PPI annual rate for August hit 2.6%, the lowest since June. Traders are increasing bets on a Federal Reserve rate cut.
Technical Analysis:
Today's buy/sell levels:
3639
Support and resistance levels:
3676
3662
3653
3625
3616
3602
Trading Strategy:
If the market breaks above 3653, consider buying, with the first target at 3662.
If the market breaks below 3639, consider selling, with the first target at 3625.
Goldprediction

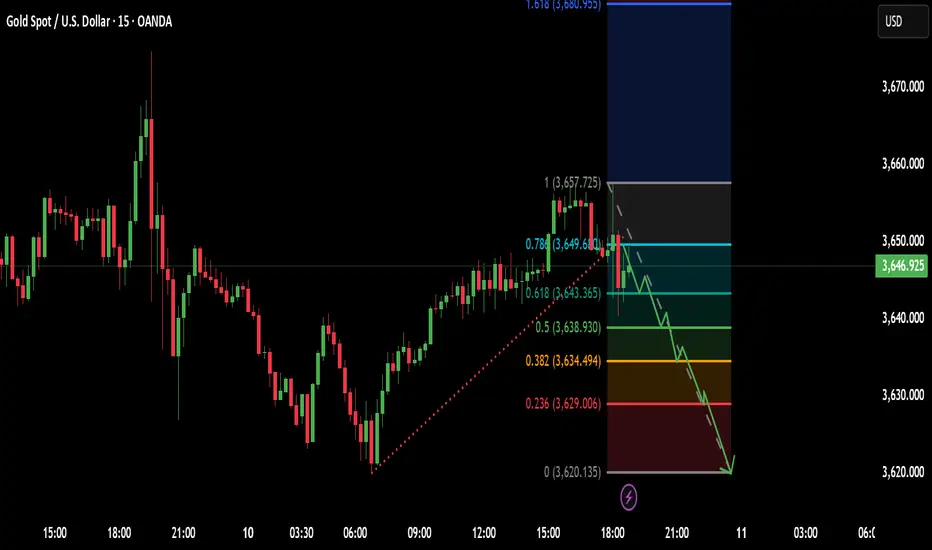
Trading Analysis for Gold Spot / U.S. Dollar (15-Minute Chart)Entery = 3649.00
Stock Loss = 3657.00
Take profit 1 = 3643.00
Take profit 2 = 3639.00
Take profit 3 = 3634.00
Take profit 4 = 3628.00
Based on the provided 15-minute chart for Gold Spot / U.S. Dollar (XAU/USD), published by NaviPips on TradingView.com on June 30, 2025, at 17:53 UTC, here’s a suggested trading setup for a buy position:
Current Price and Trend: The current price is 3,241.875, with a slight increase of +0.250 (+0.01%). The chart shows a recent downtrend that appears to be stabilizing near the current level, suggesting a potential reversal point.
Buy Entry: Enter a buy position at 3,312.875 (current price), as it aligns with a support zone where the price has found a base, indicated by the horizontal dashed line and recent consolidation.
Stop Loss: Place a stop loss at 3,295.250, below the recent low, to protect against further downside. This level is approximately 10.625 points below the entry, defining the risk.
Take Profit Levels:
Take Profit 1: 3,317.875, a conservative target about 20.000 points above the entry, aligning with a minor resistance zone.
Take Profit 2: 3,324.750, a mid-range target approximately 31.875 points above the entry.
Take Profit 3: 3,332.500, a deeper target about 45.625 points above the entry, indicating a potential trend reversal.
Price Action: The chart indicates a downtrend with a possible bottoming pattern near the current level. The support zone and upward candlestick suggest a buy opportunity if the price holds.
Risk-Reward Ratio: The distance to the stop loss (10.625 points) compared to the take profit levels (20.000 to 45.625 points) offers a favorable risk-reward ratio, ranging from approximately 1:1.9 to 1:4.3.
Conclusion
Enter a buy at 3,241.875, with a stop loss at 3,295.250 and take profit levels at 3,317.875, 3,324.750, and 3,332.500. Monitor the price action for confirmation of an upward move, and be cautious of a potential continued downtrend if the price breaks below the stop loss level. (Note: I assume "take profot" was a typo for "take profit" and have corrected it accordingly.)
Gold: Buy near 3604, target 3640-3668Gold Market Analysis:
Yesterday, we placed buy orders at 3643, 3635, 3642, and 3651. Yesterday's strategy was to maintain a bullish outlook. Gold surged and then retreated, with the daily chart closing at a tombstone, signaling new short-term resistance. Many investors believe this is a top, but the current top still needs to be confirmed. The broader trend indicators and pattern are still bullish. On the daily chart, a break below 3600 today will not change the strength of the daily chart and the candlestick pattern. Therefore, it's too early to call a top. This weekly rally is a weekly one, and a top requires time and space to be established. Today, we'll focus on a correction and volatility. Don't insist on buying today, but consider selling opportunities. After all, a correction isn't a one-sided rally, and there's plenty of room for subsequent fluctuations.
The above analysis chart represents our estimated correction. Focus on 3649 in the Asian session. If it fails to break above, we'll look for strong support below and then rally again. If the market defies our guidance and rises directly, we can consider buying at this point. However, yesterday's high of 3674 was also a selling zone. Today, we need to observe the market and adjust our strategy accordingly. Regardless of fluctuations, the overall trend remains bullish. Currently, there's no sign of a break below major support. The first major support is at 3600. We'll focus on its gains and losses today.
Minor support lies at 3620 and 3630, while resistance lies at 3649 and 3658. The dividing line between strength and weakness lies at 3649.
Fundamental Analysis:
Today, focus on the EIA crude oil inventory data. The CPI will be released tomorrow, and this week's major move will also be tomorrow.
Trading Recommendations:
Gold: Sell near 3649, target 3620-3600
Gold: Buy near 3604, target 3640-3668

Global central banks are buying gold! Gold prices are soaring!Market News:
In early Asian trading on Tuesday (September 9), spot gold prices fluctuated at high levels, currently trading around $3,636 per ounce. London gold prices, like a runaway force, broke through the $3,600 per ounce mark and ultimately reached a new all-time high of $3,647. This was primarily due to the US non-farm payroll data released last week, which fell far short of expectations, reinforcing the possibility of a Federal Reserve interest rate cut next week, with a 10% chance of a 50 basis point reduction. In addition to monetary policy expectations, continued gold purchases by global central banks have provided solid support for the international gold market. Meanwhile, global political dynamics are also fueling gold's upward trend. Any rapid rise in asset prices is accompanied by increased volatility. When positive news is fully digested by the market, be wary of the possibility of a volatile pullback triggered by profit-taking by long positions. Investors await Wednesday's Producer Price Index (PPI) and Thursday's Consumer Price Index (CPI) data to gauge the Federal Reserve's policy path. The Bureau of Labor Statistics will release revised non-farm payroll figures this trading day, which investors should pay close attention to. Furthermore, investors should monitor news related to the Russia-Ukraine geopolitical situation.
Technical Analysis:
Gold's trend-buying structure remains intact, reaching a new all-time high of 3646. The daily chart is currently moving upwards along the 5-day moving average, with the 10-day and 7-day moving averages opening at 3524 and 3570, respectively. The RSI indicator has reached the overbought zone at the high 80s, prompting caution for a pullback and correction. The recent consecutive gains require some technical adjustments, so we should remain cautious about overly bullish gold prices and remain wary of potential pullbacks. Looking at the 4-hour gold chart, short-term support is currently focused on the 3610 level, with particular attention focused on the 3575-83 support level. This level also serves as a strong short-term buying zone. Continued buying at this level within the day maintains a bullish outlook. As long as the daily chart does not break below this level, buying at lower prices on a pullback is the primary strategy. The 4-hour moving average remains upward, with prices within an ascending channel and within the upper Bollinger Band. The RSI is at a high of 80. Gold's technical outlook remains bullish, and the key trading strategy remains to buy on dips (short-term buying) and sell on highs (swing trading). Be wary of potential pullbacks after overbought conditions.
Trading strategy:
Short-term gold: Buy at 3610-3613, stop loss at 3600, target at 3640-3660;
Short-term gold: Sell at 3667-3670, stop loss at 3679, target at 3620-3600;
Key points:
First support level: 3620, second support level: 3613, third support level: 3600
First resistance level: 3640, second resistance level: 3655, third resistance level: 3678

XAU/USD(20250909) Today's AnalysisMarket News:
New York Fed Survey: Consumers expect unemployment and job losses to rise, and the Fed is expected to cut interest rates next week.
Technical Analysis:
Today's Buy/Sell Levels:
3620
Support and Resistance Levels:
3686
3661
3645
3595
3579
3554
Trading Strategy:
If the market breaks above 3545, consider buying, with the first target at 3661.
If the market breaks below 3620, consider selling, with the first target at 3595.

Gold's historic rally continues!Market News:
In early Asian trading on Monday (September 8), spot gold prices fluctuated within a narrow range, currently trading around $3,597/oz. Influenced by exceptionally weak US non-farm payroll data, spot gold prices surged, reaching $3,600/oz in London, a record high. The market now believes there is approximately a 10% chance that the Federal Reserve will cut interest rates by 50 basis points in September. Investors should be wary of the risk of a significant rate cut at this meeting. From a broader perspective, the fundamentals of international gold are exceptionally strong. Non-yielding gold has stood out in an environment of low interest rates and high uncertainty. This rally is not a flash in the pan; it is built on a solid foundation of multiple factors, including a weak US dollar and expectations of a global economic slowdown. Another major pillar of gold's gains is continued central bank buying. In addition to domestic US economic factors, international geopolitical turmoil has also provided strong support for gold. Gold traders are focused on this week's US Consumer Price Index (CPI) data. If progress is made in combating inflation, this will strengthen the case for a rate cut at the September 16-17 meeting. Market sentiment for rate cuts has reached its limit. A slight rise in the CPI may lead to temporary caution in international gold prices, but the overall bull market remains intact.
Technical Analysis:
Non-farm payroll data fueled gold buying, extending the trend structure and reaching a new all-time high. Spot gold prices hit another all-time high, posting their strongest single-week gain. Weak US non-farm payroll data further heightened expectations of a Fed rate cut, and amidst growing global economic uncertainty, gold's strong rally has gained new momentum. The weekly chart showed a strong bullish trend. After seven consecutive daily gains, the eighth candlestick formed a small bearish retracing line, retracing to the 3516 level. After a correction, the 5-day moving average regained support. Following Friday's positive non-farm payroll data, gold once again broke through its all-time high, reaching the 3600 mark, driven by the convergence of technical and fundamental factors. The daily candlestick structure remains a buy signal! Price is trading within the upper Bollinger Band, with the RSI nearing the 80-day mark. The latest 10/7-day moving averages are moving upward to 3498/35. The daily and weekly trends remain bullish, but the RSI is approaching overbought territory, prompting caution for potential corrections. On the four-hour chart, price is trading within the upper middle Bollinger Band, with the moving averages remaining upward, maintaining its upward trend. The trading strategy for gold at the start of the week continues to be primarily buy-on-low.
Trading Strategy:
Short-term gold buy at 3572-3575, stop loss at 3564, target at 3600-3620;
Short-term gold sell at 3636-3639, stop loss at 3648, target at 3590-3570;
Key Points:
First Support Level: 3572, Second Support Level: 3555, Third Support Level: 3538
First Resistance Level: 3600, Second Resistance Level: 3616, Third Resistance Level: 3636

Gold: Buy around 3578, target 3599-3620Gold Market Analysis:
Friday's gold buying was strong again, driven by two factors: a pre-existing buying trend, and the disappointing non-farm payroll data, which bolstered gold's safe-haven appeal. We also placed buy orders at 3544. Before the non-farm payroll report, the price broke through 3561 again, and all of our buy orders were profitable. The weekly chart ultimately closed with a large, clear bullish candlestick. The buying trend is undeniable. I've always adhered to the principle of not speculating on tops or trends; we aim to follow them, not fight them. Currently, both indicators and patterns clearly indicate a buying trend. This week, we'll focus on the gains and losses of 3523 on the weekly chart. Unless it breaks, it's difficult to call a top, nor will it disrupt the buying pattern. Let's look for buying opportunities in the Asian session. First, focus on support at 3578-3572. 3578 represents the previous top of the pattern and also serves as a minor short-term support level. The low point of Friday's correction from the high was 3572, indicating this level has become a new minor support level. Consider buying at this level in the Asian session. Slightly stronger support is the 1H support at 3562, also the daily moving average. Buying here is certain to trigger another rebound. Friday's gains were quite significant, and with the 3600 mark approaching, we predict either a pullback and subsequent rally, or a direct break below 3600. A direct decline is unlikely. For the first option, wait for a buying opportunity; for the second option, consider buying directly.
Support is 3578-3572, strong support is 3562, resistance is 3500, and the strength-weakness dividing line is 3562.
Fundamental Analysis:
Last week's non-farm payroll data showed a figure of 22,000, compared to expectations of 75,000 and a previous estimate of 79,000. This result is quite disappointing. In short, fewer US jobs mean a weakening economy, which in turn leads to a rise in gold prices. This week, we'll keep an eye on the CPI.
Trading Recommendations:
Gold: Buy around 3578, target 3599-3620

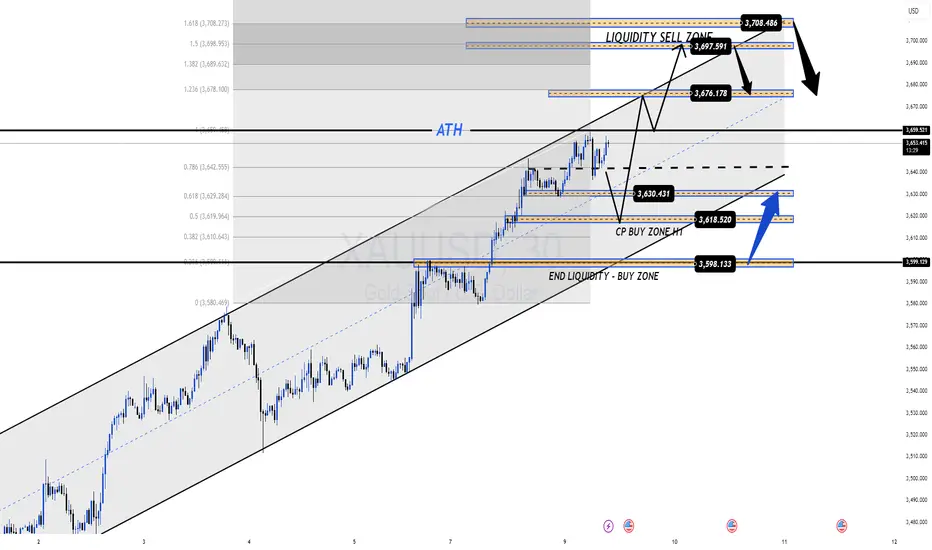
XAUUSD – PPI Ahead: Key Liquidity Levels & Trading PlanMarket View:
After yesterday’s sharp drop where sellers dominated the liquidity zone, gold (XAUUSD) is now recovering from 362x → 364x during the Asian session. In the short term, price may range between 362x–365x in Asia/Europe before going sideways to await the PPI release in the US session.
Today’s PPI is expected at 0.3% vs 0.9% previous, signalling cooling inflation. However, actual data could come in higher – often creating a “news trap”. From a technical view, gold may need to retest 360x liquidity before resuming its uptrend ahead of CPI & the upcoming FED meeting.
👉 In short: Structure stays bullish, but short-term liquidity sweeps are likely before continuation.
Key Levels:
Resistance: 3647 – 3654 – 3665 – 3674 – 3704
Support: 3635 – 3613 – 3600 – 3586
Trading Plan:
🔵 BUY Zone: 3600 – 3598
SL: 3592 (or tighter at 3580)
TP: 3605 → 3610 → 3615 → 3620 → 3630 → 3640 → 3650+
🔴 SELL Zone: 3703 – 3705
SL: 3710
TP: 3698 → 3694 → 3690 → 3680 → 3670 → 3660+
Summary:
✅ Gold remains in an uptrend, but may retest 360x liquidity before heading higher.
✅ PPI today & CPI tomorrow could trigger traps – caution is advised.
👉 Watch the key levels and follow MMFLOW TRADING for daily updates & BIGWIN setups!

Analysis of subsequent gold price trends!Market News:
In early Asian trading on Wednesday (September 10), London gold prices fluctuated downward, currently trading around $3,621 per ounce. After hitting a record high of $3,674, the spot price plummeted nearly $50, ultimately ending the day in the red. International gold prices have recently seen a sharp rise, with some investors taking profits ahead of the release of key US inflation data, triggering a pullback from their highs. Although the revised employment data released by the US Department of Labor fell short of market expectations, gold buyers took advantage of the opportunity to take profits. The rebound of the US dollar index from a seven-week low and US Treasury yields from a near five-month low also made gold buyers cautious. Furthermore, the continued rise of US stocks to new record highs has slightly weakened gold's safe-haven demand. Investors are currently awaiting US producer price data (PPI) to be released on Wednesday and consumer price data (CPI) to be released on Thursday, hoping for clues on further interest rate cuts before next week's Federal Reserve meeting. These data are expected to provide new guidance for gold prices.
Technical Analysis:
Gold closed with an inverted hammer candlestick pattern on the daily chart. After hitting a record high of 3674 following yesterday's US market data, the price, as expected, capitalized on the data to drive selling, resulting in the largest single-day correction since August 20th. The daily chart currently maintains an ascending channel buying trend. The 10-day and 7-day moving averages remain open and rising to 3550/3590, while the New York closing price remains above the 5-day moving average of 3605. After the RSI indicator on the four-hour chart reached overbought levels above 80, gold prices followed the expected surge and then retreat to a correction, falling back to 3623 in late trading. However, gold prices remain within the upper Bollinger Bands, with the moving averages converging. The main strategy for gold trading today is to see wide range fluctuations, with selling high and buying low as a strategy. The initial intraday range is 3610/3660. Overall, gold is expected to experience repeated high-level fluctuations in the short term, and any strong rebound may not be sustainable. If this week's correction breaks below the strong support of $3,600 and further declines, we will need to adjust our strategy!
Trading Strategy:
Short-term gold buy at 3,603-3,606, stop loss at 3,595, target at 3,640-3,660;
Short-term gold sell at 3,650-3,653, stop loss at 3,662, target at 3,620-3,600;
Key Points:
First Support Level: 3,612, Second Support Level: 3,603, Third Support Level: 3,590
First Resistance Level: 3,650, Second Resistance Level: 3,663, Third Resistance Level: 3,676

Gold 1H – Buy the Dip, Watch 3,687 Premium SupplyOn the 1-hour chart, Gold is trading above 3,650 after a clear break of structure. Price has created demand footprints near 3,636 and deeper at 3,594, while resistance is seen around 3,670 and premium supply is at 3,687–3,689. This indicates a possible engineered retracement into discount demand zones before a move towards liquidity above 3,688.
📌 Key Structure & Liquidity Zones (1H):
• 🔼 Buy Zone 3,636 – 3,634 (SL 3,630): Fresh demand block in line with bullish flow.
• 🔼 Buy Zone 3,594 – 3,592 (SL 3,587): Deeper discount demand, strong base for buyers.
• 🔽 Sell Zone 3,687 – 3,689 (SL 3,694): Premium supply zone, possible liquidity sweep.
📊 Trading Ideas (Scenario-Based):
🔺 Buy Setup – Demand Block Reaction
• Entry: 3,636 – 3,634
• Stop Loss: 3,630
• Take Profits:
TP1: 3,650
TP2: 3,665
TP3: 3,680+
👉 Expect retracement into discount demand before price continues bullish.
🔺 Buy Setup – Deeper Demand Test
• Entry: 3,594 – 3,592
• Stop Loss: 3,587
• Take Profits:
TP1: 3,610
TP2: 3,625
TP3: 3,640+
👉 Best for swing buyers seeking higher risk-reward on a deeper liquidity grab.
🔻 Sell Setup – Premium Rejection
• Entry: 3,687 – 3,689
• Stop Loss: 3,694
• Take Profits:
TP1: 3,670
TP2: 3,655
TP3: 3,640
👉 Short-term liquidity grab at premium levels, good only for scalping with strict risk.
🔑 Strategy Note
Overall bias remains bullish, but smart money may push price into 3,636 or even 3,594 demand zones before expanding higher. Safer setups are buying dips; short positions at 3,687 should be treated only as quick scalps.

XAUUSD – Intraday Plan: Bullish Trend + Key Liquidity ZonesMarket Pulse:
The US jobs data (05/09) showed a slowdown in hiring. According to CME FedWatch, there is an 88% chance of a 0.25% Fed rate cut in September, and 12% for a 0.5% cut. Lower rates support gold as a non-yielding asset.
Gold has already gained 38% YTD, after rising 27% in 2024. A weaker USD, central bank buying (China added gold for the 10th month in a row in August), loose monetary policy, and global risks keep gold in a strong bullish trend.
👉 Market bias: Macro + liquidity flows favour BUY.
Technical View (M30):
Price stays in an up channel, making higher lows.
3616–3596 is the key support zone.
Liquidity SELL zones at 3653–3655 and 3675–3677 may give short intraday pullbacks before trend continues.
Execution Plan (Today):
🔵 BUY ZONE #1: 3618 – 3616
SL: 3610
TP: 3624 → 3630 → 3635 → 3640 → 3650 → 3660 → 3670+
🔵 BUY ZONE #2: 3598 – 3596
SL: 3590
TP: 3602 → 3606 → 3610 → 3615 → 3620 → 3630 → 3640 → 3650+
🔴 SELL ZONE #1: 3653 – 3655
SL: 3660
TP: 3648 → 3644 → 3640 → 3635 → 3630 → 3620
🔴 SELL ZONE #2: 3675 – 3677
SL: 3681
TP: 3670 → 3665 → 3660 → 3650 → 3640
Summary:
✅ Gold trend stays bullish – best setups are buying dips into liquidity zones.
⚡ Intraday scalps possible at SELL liquidity zones.
👉 Follow MMFLOW TRADING for daily precision setups.
Gold - Buy around 3627, target 3680-3699Gold Market Analysis:
Is gold trading aggressive today? Those who prefer to intercept and counter-trend trades and avoid losses are already questioning their lives. The market is like this; it's always right. Yesterday, we analyzed a long position at 3578, but the lowest point was only 3579. It's better to miss out on such a market than to make a mistake. In a one-sided rally, making a mistake is the most damaging. Today's approach remains bullish, and we're watching for buying activity. A surge doesn't have a top, and no one knows where it will be. Based on the current momentum, 3700 is just around the corner. Gold is advancing cautiously, with the daily chart pattern beginning to rise, and buying indicators are also rising. The 5-day moving average has already reached around 3594. There are essentially no selling opportunities above 3594. Yesterday's Monday rally actually exceeded market expectations. This week, I predict gains from Monday to Wednesday, with a daily correction expected on Thursday and Friday, but it will only be a correction, not a major drop. In today's Asian session, we will look for buying opportunities at support at 3627. This level provides minor support in the 1-hour chart and also supports hourly indicators. The Asian session has already reached a new high, indicating continued strength. Buying is recommended. If the price unexpectedly breaks below 3627, we will look for support in the 4-hour chart before buying. We are not considering selling during the Asian session.
Support is 3627, with strong support at 3600 and 3594. Resistance is not visible, and the market's strength-weakness dividing line is 3600.
Fundamental Analysis:
The previous sharp drop in non-farm payroll data led to a surge in gold prices. This week, we will monitor CPI data.
Trading Recommendations:
Gold - Buy around 3627, target 3680-3699

Gold 1H – Smart Money Plays Below 3,600Gold on the 1H timeframe is consolidating close to 3,600 after sweeping short-term liquidity. Price is currently forming imbalance around intraday highs, while demand is positioned lower at 3,565. This structure suggests engineered moves designed to trap both buyers and sellers before the next expansion.
________________________________________
📌 Key Structure & Liquidity Zones (1H):
• 🔼 Buy Zone 3,565 – 3,563 (SL 3,560): Discount demand block, aligned with bullish order flow.
• 📍 Scalp Sell Zone 3,594 – 3,596 (SL 3,601): Intraday rejection pocket; scalp opportunity.
• 🔽 Sell Zone 3,630 – 3,628 (SL 3,637): Premium supply zone, suitable for liquidity sweep reaction.
________________________________________
📊 Trading Ideas (Scenario-Based):
🔺 Buy Setup – Demand Block Reaction
• Entry: 3,565 – 3,563
• Stop Loss: 3,560
• Take Profits:
o TP1: 3,585
o TP2: 3,595
o TP3: 3,600+
👉 Expectation is for liquidity sweep into discount demand before resuming bullish trend.
🔻 Sell Scalp Setup – Intraday Reaction
• Entry: 3,594 – 3,596
• Stop Loss: 3,601
• Take Profits:
o TP1: 3,592
o TP2: 3,590
o TP3: 3,585 → 3,580 → 3,570 → 3,560
👉 Short-term liquidity pocket; scalp trades only with strict risk control.
🔻 Sell Setup – Premium Rejection
• Entry: 3,630 – 3,628
• Stop Loss: 3,637
• Take Profits:
o TP1: 3,610
o TP2: 3,600
o TP3: 3,590
👉 Targeting liquidity lying below intraday lows; best for quick short opportunities.
________________________________________
🔑 Strategy Note
Overall bias remains bullish, but smart money may engineer a sweep of 3,626–3,630 supply before driving price back into 3,565 demand. Cleaner setup is to buy dips, while sell scalps are short-lived opportunities.

XAUUSD At Critical PRZ: Will Gold Reverse or Break to New Highs?Hello Traders And Investors
XAUUSD At Critical PRZ: Will Gold Reverse or Break to New Highs? 🔥”
The recent price action on Gold (XAUUSD) has reached a very critical level near $3,586 – $3,600, which aligns with a strong resistance zone. This area is marked as a Potential Reversal Zone (PRZ), where sellers may step back into the market.
🔍 Market Structure Breakdown:
Previous Liquidity Sweep
Price collected liquidity below the July lows before forming a Higher Low at the start of August.
This move gave the market strength to push higher, creating a clean bullish structure.
Strong Impulsive Rally
From mid-August onwards, gold showed a strong bullish impulse, breaking through minor resistance levels without much pullback.
However, such parabolic moves often lack sustainability, making them vulnerable to a healthy correction.
Resistance & PRZ Reaction
The current resistance zone has historically acted as a strong rejection level.
Price tapping into this zone suggests exhaustion in bullish momentum, increasing the probability of a short-term pullback.
🎯 Target Zones for Downside Move:
1st Target: $3,480 – $3,500
This area coincides with a previous demand block and will act as the first reaction point.
Final Target: $3,330 – $3,320 (Key Support)
If bearish momentum sustains, price could revisit this major support, completing the correction phase before potentially resuming the broader uptrend.

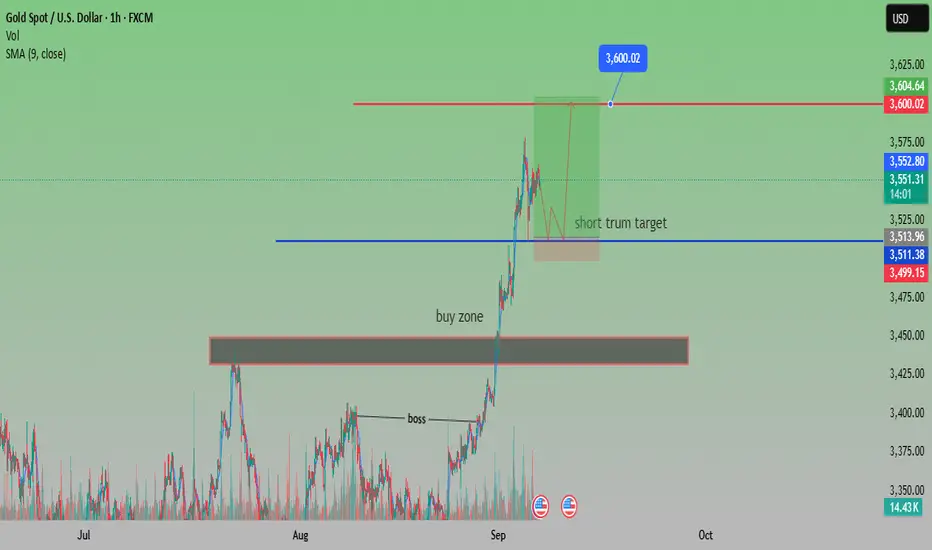
Gold Targets $3,600 After Strong BreakoutAnalysis:
Gold (XAU/USD) continues its bullish rally after breaking above the buy zone near $3,440 and holding strong momentum. The market has recently made higher highs, with price consolidating slightly below the resistance zone.
Currently, gold is trading at $3,548, with the short-term target identified at $3,600. The chart suggests potential consolidation in the highlighted area before another upward push. The SMA (9) at $3,552 is acting as dynamic support, keeping the bullish bias intact.
If buyers maintain control, a clear breakout above $3,552 – $3,560 could confirm a move toward $3,600 – $3,604. However, if momentum weakens, support lies at $3,511 and $3,499, with a deeper pullback possible toward the $3,440 buy zone.
Overall, the sentiment remains bullish, and gold looks positioned to test the $3,600 psychological resistance in the near term.
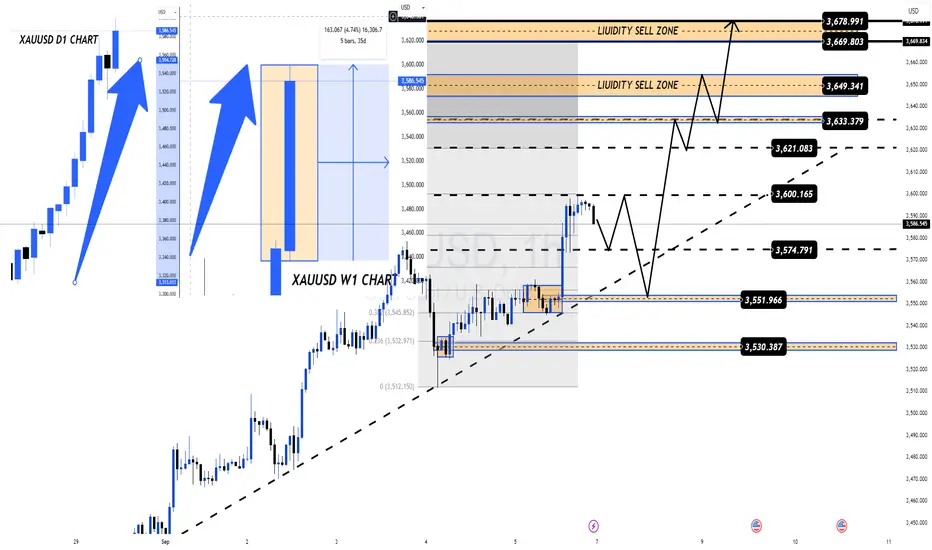
Weekly Outlook: Big Bullish Move + Key US DataMarket View:
Gold (XAUUSD) finished the week with strong momentum after Nonfarm pushed price close to $3600/oz ATH. On the daily chart, the candle closed almost full body (only ~30% wick), showing no profit-taking yet. The weekly chart is also strongly bullish – confirming that buyers are in control. This signals more upside likely in the coming week and month.
Key US Events This Week:
Wed, Sep 10: Core PPI & PPI m/m → If higher than expected, USD may strengthen short-term, creating pressure on gold.
Thu, Sep 11: CPI (Core, m/m, y/y) + Jobless Claims → the most important release. Lower CPI + higher claims = bullish for gold. Higher CPI = hawkish Fed = pressure.
Fri, Sep 12: UoM Consumer Sentiment & Inflation Expectations → could shift Fed outlook further.
👉 Fundamentals may bring volatility, but overall medium-term trend remains bullish.
Technical Outlook (H1 Chart):
After the Nonfarm breakout, gold is consolidating sideways. Levels to watch:
Support: 3574 – 3551 – 3530 – 3516
Resistance: 3600 – 3621 – 3633 – 3649 – 3669 – 3678
Trading Plan:
BUY bias (preferred):
Long on dips near 3574–3550
SL: below 3530
TP: 3600 → 3621 → 3633 → 3649 → 3669 → 3678
SELL scalp (alternative):
Only if 3530 breaks with strong CPI surprise → target 3516/3527
Summary:
✅ Gold stays in a strong uptrend on Daily & Weekly charts. Macro factors support more upside if inflation keeps easing.
👉 Watch 3592 (bullish trigger) and 3575 (bearish trigger) as the key decision levels.
Follow MMFLOW TRADING for daily plans and quick updates.
XAU USD WEEKLY CHART Xau USD gold given massive return in last some months . U can Check on our chart . It's given buy on weekly chart near 1932 . Now Xau USD standing near 3560+ that's a massive return. You can check my old views on Xau USD of 15 min Chart.
Still we can see good movement from here on 15 min Chart . Good Support near 3550 .
Consult Your Financial Advisor Before Making any position in stock market/ XAU USD .

Gold 05/09: Ready to Scalp the Drop or Buy the Dip?🟢 Market Context
Gold is currently showing a short-term bearish setup after a ChoCH (Change of Character) near 3,536.556. The market is rejecting supply and forming liquidity sweeps around the 3,531–3,533 zone. Expect price to pull lower towards demand areas before the next bullish leg.
📍 Key Levels & Trade Plan
🔴 Intraday Sell (Scalp Opportunity)
• Entry: 3,531 – 3,533
• Stop Loss: 3,535
• Target: 3,485
🟢 Swing Buy Zones
Buy Zone 1: 3,475 – 3,477
o Stop Loss: 3,470
o Target: 3,508 – 3,526
Buy Zone 2 (Deeper Discount): 3,441 – 3,443
o Stop Loss: 3,435
o Target: 3,500+
⚖️ SMC Bias
• Short-term: Bearish scalp from supply zone.
• Mid-term: Looking for liquidity grab and bullish reversal at demand zones.
• Long-term: Maintaining bullish order flow as long as deeper demand (3,441) holds.

Crazy gold! Buy or wait for a pullback?Market News:
Spot gold prices fluctuated narrowly in early Asian trading on Friday (September 5th), currently trading around $3,550 per ounce. International gold, a traditional safe-haven asset, hit a record high of $3,578 per ounce on Wednesday amid growing global economic uncertainty. The London gold price declined after reaching a record high, primarily due to profit-taking by traders. After a strong rally, the market accumulated a large amount of long positions, and many investors chose to cash in their profits at the peak, leading to a short-term price decline. Traders are focused on the upcoming US non-farm payroll report, which could directly influence the pace of the Federal Reserve's interest rate cuts and, in turn, the price of gold. In the current environment, weak employment indicators reinforce expectations of rate cuts and support gold's safe-haven demand. However, if the data exceeds expectations, gold may face further pressure.
Technical Analysis:
After seven consecutive days of gains, gold experienced a sharp drop yesterday, closing with a long lower shadow on the daily chart. Technically, this closing pattern is often a continuation of an upward trend, as prices remain within the ascending channel. Furthermore, a double top or head-and-shoulders top pattern has yet to emerge and establish. The daily chart retreated to yesterday's 5-day moving average at 3511, then bottomed out and rebounded. The European and American markets strengthened again, pulling back towards the 3559/60 levels. The 10-day and 7-day moving averages remained open and moved upward to 3504/3467, and the RSI indicator remained above 70. On the short-term four-hour chart, gold prices are trading within the upper middle Bollinger Band, with the moving averages converging and the hourly Bollinger Bands closing. Regarding news data, focus on the non-farm payroll report today. The market's estimate is slightly bearish, but the 4.3% increase in the unemployment rate is favorable for buying. The main strategy for intraday trading is to focus on wide range fluctuations, primarily buying on dips and selling on highs.
Trading Strategy:
Short-term gold buy at 3535-3538, stop loss at 3527, target at 3570-3590;
Short-term gold sell at 3577-3580, stop loss at 3588, target at 3540-3520;
Key Points:
First support level: 3536, second support level: 3523, third support level: 3510
First resistance level: 3562, second resistance level: 3576, third resistance level: 3590

Gold - Buy near 3540, target 3558-3578Gold Market Analysis:
The market's greatest allure lies in its ever-changing nature. Yesterday, gold plummeted in the Asian session, plummeting to around 3510. It then hit the 5-day moving average on the daily chart and rebounded rapidly. It then went on to not only rebound, but also rise in a V-shaped pattern. Your supposed sell-off was a lie. The daily chart ultimately closed with a bearish hammer candlestick pattern. The long lower shadow suggests yesterday's sharp drop was fleeting. Gold has not yet shifted its buying trend. Today is the time for the non-farm payroll report, and I predict a period of volatile correction with a buying bias. If gold can rally to a new high in the Asian session today, consider buying directly. Our approach in the Asian session is to buy low and then wait for the non-farm payroll data. It's difficult to determine whether 3578 on the daily chart is the high point, and the pattern doesn't signal a peak. The 1-hour chart shows a new support level near 3540. Buying in the Asian session is possible based on this support level. Furthermore, support from moving averages and indicators is near 3531. This level, which represents daily support, presents a buying opportunity. If gold reaches 3578 during the Asian session, do not consider selling. The strategy of buying at low prices can be maintained until the release of the non-farm payroll data.
Support levels are 3531 and 3540, while resistance levels are 3578 and 3560. The dividing line between strength and weakness is 3540.
Fundamental Analysis:
Recent fundamentals have not significantly stimulated the market. Today, we will focus on the US non-farm payroll data.
Trading Recommendation:
Gold - Buy near 3540, target 3558-3578

Bearish Pressure Builds: Gold Poised for More RetreatGold retreated sharply today as expected, and directly hit my expected retracement target of 3520-3510 area; the lowest point happened to be around 3511. We added a lot of short positions around 3575 and 3578 overnight, which helped us to make considerable profits during the gold retreat. All short positions made a total profit of 1830pips after being closed.
Since gold has begun to retreat from 3578, and the retracement has reached 670 pips in the short term, a retracement that is rare in recent times, as gold has shown obvious signs of retreat, once large funds begin to withdraw, it may trigger serious selling sentiment in the market. Taking this opportunity, the gold market may usher in a round of sharp correction. Moreover, after gold retreats, 3578 is expected to become the interim peak, which will limit the room for gold to rebound while being conducive to the downward pressure on gold.
In addition, gold rose sharply before the NFP market, probably to reserve room for the NFP market to fall, so I think gold still has the demand and space to continue to retreat, so the current decline has not ended yet, and I think the current short-term rebound provides us with good conditions for entering the short market.
According to the current structure, gold still needs to retreat after fluctuating at high levels. Therefore, in trading, we can still look for suitable opportunities to short gold during the gold rebound. First of all, we need to pay attention to the short-term resistance area of 3545-3555. Once gold cannot effectively stand in this area during the rebound, gold will also test the 3510-3500 area. After falling below this area, it is expected to continue to the 3490-3480 area.

Gold 04/09 – Smart Money Setup: Sell Scalp, Prep for Buy Zones🟢 Market Context
Gold is currently reflecting a short-term bearish setup after a Change of Character (ChoCH) near 3,536.556. The market is reacting from supply and creating liquidity sweeps around the 3,531–3,533 zone. We anticipate the price to move lower towards demand areas before the next upward push.
📍 Key Levels & Trade Plan
🔴 Intraday Sell (Scalp Trade)
Entry: 3,531 – 3,533
Stop Loss: 3,535
Target: 3,485
🟢 Swing Buy Zones
Buy Zone 1: 3,475 – 3,477
Stop Loss: 3,470
Target: 3,508 – 3,526
Buy Zone 2 (Deeper Discount): 3,441 – 3,443
Stop Loss: 3,435
Target: 3,500+
⚖️ SMC Bias
Short-term: Bearish scalp from supply zone.
Mid-term: Expecting liquidity grab and bullish reversal at demand zones.
Long-term: Bullish order flow intact as long as deeper demand (3,441) is respected.

Gold 03/09 – Smart Money Playbook: Buy the Dip, Sell the High🟢 Market Context
Gold continues to show a bullish trend with multiple BOS (Break of Structure) and ChoCH (Change of Character) confirmations. The price is currently consolidating around the 3,533–3,540 range, with a noticeable FVG (Fair Value Gap) below. The market is likely to sweep liquidity before making another upward move.
📍 Key Levels
• Resistance (Sell Zones): 3,564 | 3,575–3,576 | 3,586 | 3,595
• Support (Buy Zones): 3,528 | 3,508 | 3,494 | 3,480–3,478 | 3,468
🛠️ Trade Ideas
✅ Buy Zone (Intraday Swing)
• Entry: 3,480 – 3,478
• SL (Stop Loss): 3,473
• TP (Take Profit): 3,485 – 3,490 – 3,500 – 3,515 – 3,520 – 3,530
📌 Expectation: Price is expected to fill the FVG and react from the demand zone before resuming its upward trend.
✅ Buy Scalp (Quick Reaction)
• Entry: 3,501 – 3,503
• SL (Stop Loss): 3,491
• TP (Take Profit): 3,510 – 3,525 – 3,545 – 3,550
📌 Expectation: A short-term liquidity grab above the 3,500 psychological level, leading to a bullish push.
❌ Sell Zone (Countertrend Play)
• Entry: 3,575 – 3,573
• SL (Stop Loss): 3,582
• TP (Take Profit): 3,565 – 3,555 – 3,545 – 3,530 – 3,520
📌 Expectation: A strong supply zone where smart money may target liquidity before a price reversal.
🔑 SMC Insights
• BOS confirms a bullish bias, but the price may pull back to address the FVG imbalance.
• Liquidity is likely to be present around 3,480–3,500 before a push towards 3,575 or higher.
• High probability of buying at demand zones (dips) and selling at extreme supply zones.
