Break down 3350 leads more downBreak down 3350 leads more down per Fibbonoci analysis.
Support 1 3,300
Support 2 3200
Sell on every high !!
Goldprediction

GOLD - PULLBACKS LIKELY BEFORE CONTINUED UPSIDE - UPTREND INTACTSymbol - XAUUSD
CMP - 3369.50
Gold has been advancing steadily since the start of the trading session, moving toward the 3374 area of interest. Following a breakout above prior consolidation resistance, the metal may now be poised to retest this breakout level before continuing its upward trajectory.
The current rally is supported by heightened trade related risks and a softening US dollar. After briefly declining to 3310, gold resumed its upward momentum, with a key objective at the 3368 resistance level. The recovery is underpinned by ongoing uncertainty surrounding Trump’s trade policy, market anticipation ahead of Powell’s upcoming speech, and broader geopolitical tensions - including trade disputes with the EU, political instability in Japan, and recent criticism of the Federal Reserve from the White House. These factors have prompted a temporary flight to safety, benefiting gold.
From a technical perspective, gold is in a post-breakout realization phase following the consolidation breakout. However, resistance at 3368 has capped further gains for now, and a near-term pullback remains possible. The 3350–3355 support zone is currently in focus. Sustained bullish control above this level could reignite upward momentum and reestablish the breakout continuation.
Key Resistance Levels: 3368, 3374
Key Support Levels: 3345, 3332
The broader market bias remains bullish, bolstered by dollar weakness and persistent risk aversion. Market participants are closely monitoring developments involving Trump and remarks from Powell. Should Powell signal a dovish shift - such as a potential rate cut announcement (e.g. during tomorrow’s 12:30 GMT statement) - gold may extend its gains.


XAUUSD – Gold Intraday Market Outlook (22/07)PLan XAUUSD TRADING BY MMFLOW SYSTEM - 22/07
Gold saw a sharp rally yesterday, completing its bullish wave structure for the day. However, as price approached the key psychological resistance around $3400, we started to see signs of exhaustion, with a clear bearish reversal candle forming at the top. This is the first indication of a possible correction in today’s session.
🔍 Technical Analysis
After forming a short-term top, gold is now entering a retracement phase and has tested a major support area – the FVG High Zone on H1 timeframe. If bearish pressure continues and this zone is broken, price may drop further to seek deeper liquidity zones.
🔽 Buy Zones to Watch Today
✅ Zone 1 – EL (End Liquidity within FVG): 3367 – 3350
→ Historically a strong reaction zone – good for short-term bounce entries.
✅ Zone 2 – Confluence of FIBO 0.5 – 0.618 + VPOC (3350 – 3335)
→ Ideal for long-term buy setups, as this zone overlaps key technical signals and previously saw strong buyer interest.
📌 Trade Setup Suggestions
🔸 BUY ZONE: 3351 – 3349
SL: 3344
TP targets: 3355 – 3360 – 3365 – 3370 – 3375 – 3380 – 3390 – 3400 – ???
🔸 BUY SCALP: 3366 – 3364
SL: 3360
TP: 3370 – 3375 – 3380 – 3385 – 3390
🔻 SELL ZONE: 3420 – 3422
SL: 3427
TP: 3415 – 3410 – 3405 – 3400 – 3390 – 3385
⚠️ Risk Reminder
Although there’s no major economic data today, traders should stay cautious. Unexpected volatility could arise from political developments or central bank commentary. In low-news environments, gold tends to consolidate tightly and then break out aggressively.
🔐 Always use Stop Loss and Take Profit to protect your capital – the market can surprise even the most experienced traders.
📈 Trading Strategy
Short-term bias: Favouring a pullback scenario.
Medium to long-term plan: If price drops deeper into key liquidity zones, that could offer excellent opportunities to load up on long positions, anticipating a strong upside move as the market prices in future Fed rate cuts and gold seeks new all-time highs.
💬 Stay focused, trade with confirmation, and always manage your risk. Patience and discipline will separate you from the crowd.


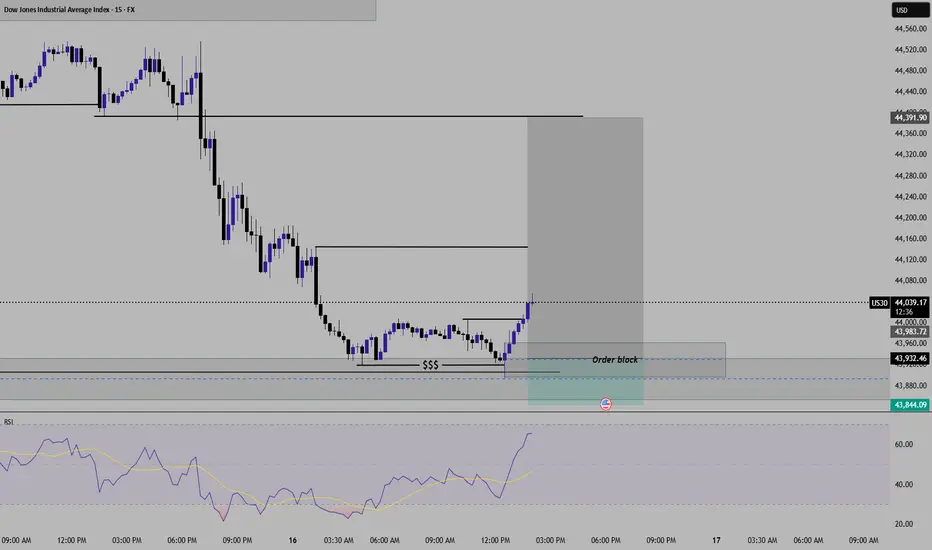
US30 Analysis for smaller time frameUS30 Buy setup With HTF Liquidity Grab Confirmation and lower time frame Entry module.
Buy @ 43925
Stop loss @43845
1st Target - @44140
2nd Target - 44390
(This publication is only for education purpose. consult your financial advisor before any investment)
GOLD SHORT 1H TIMEFRAMEGOLD CAN BE GO BEARISH IN NY SESSION
as per the market maker point of view
3.8RR

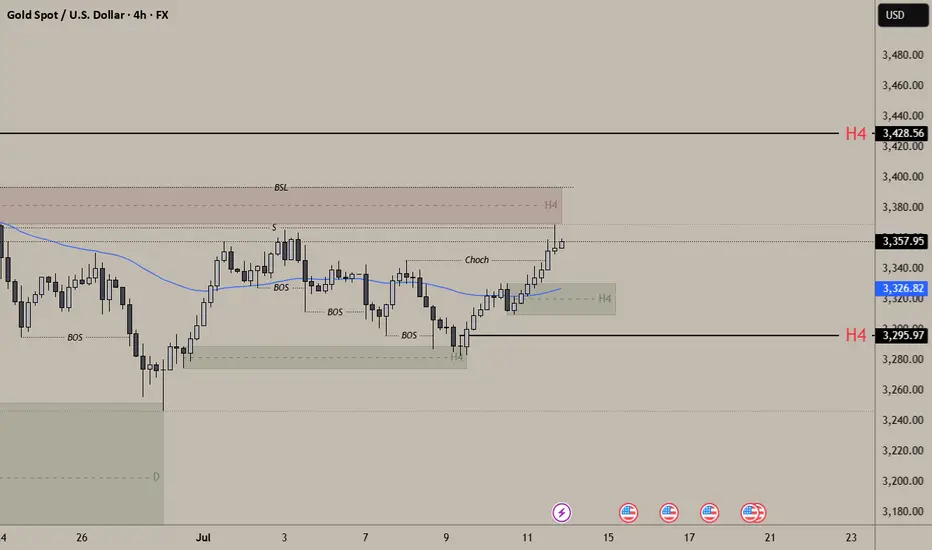
GOLD ANALYSIS AS PER THE MARKET MAKER PERSPECTIVEThis is a gold 4 hour analysis for upcoming week
Gold This week target is 3428 (H4 Supply) in term of bullish
In term of Bearshish (which is low probability) target can be 3296 (H4 demand)
GOLD SHOWING A GOOD UP MOVE WITH 1:8 RISK REWARD GOLD SHOWING A GOOD UP MOVE WITH 1:8 RISK REWARD
DUE TO THESE REASON
A. its following a rectangle pattern that stocked the market
which preventing the market to move any one direction now it trying to break the strong resistant lable
B. after the break of this rectangle it will boost the market potential for break
C. also its resisting from a strong neckline the neckline also got weeker ald the price is ready to break in the outer region
all of these reason are indicating the same thing its ready for breakout BREAKOUT trading are follws good risk reward
please dont use more than one percentage of your capitalfollow risk reward and tradeing rules
that will help you to to become a bettertrader
thank you

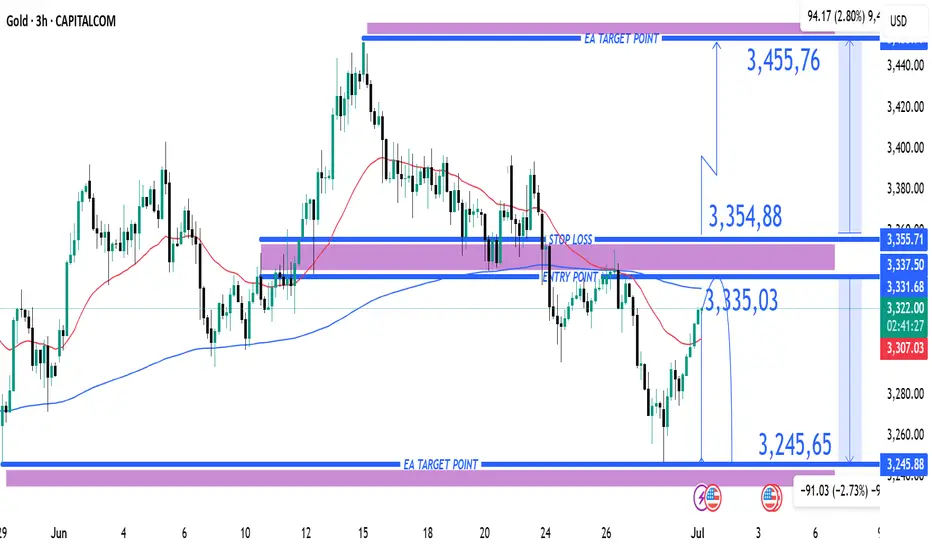
(XAU/USD) 3H Chart – Bearish Reversal Setup from Resistance Zone1. Entry Point (Sell):
Marked at 3,335.03
This is a key resistance level where price is expected to reverse downward.
2. Stop Loss:
Placed above at 3,354.88
This acts as a protection level in case the trade goes against the direction.
3. Take Profit Targets (EA Target Points):
TP1 (Downside): 3,245.65
TP2 (Upside - if Stop Loss is hit): 3,455.76 (in case of reversal or long position)
4. Price Action Observation:
Price is currently around 3,320.56, climbing back toward the entry zone.
The red 50-period moving average (EMA) and blue 200-period MA show convergence, often preceding volatility.
---
📉 Bearish Scenario (Main Setup)
Sell Bias is expected from the 3,335 region.
If price respects the resistance zone and breaks down again, the target is 3,245.65, yielding approximately 90-point move.
This is a risk-reward favorable setup, with:
Risk: ~20 points
Reward: ~90 points
RRR ≈ 1:4.5
---
⚠️ Bullish Invalidity (Stop Loss Hit)
If the price breaks and closes above 3,354.88, it invalidates the bearish setup.
Then, the market may shift towards targeting 3,455.76 — about 100 points to the upside.
---
🔧 Technical Factors Supporting the Setup
Supply zone marked by the purple box around the entry.
Trend previously bearish — recent upward move may just be a retracement.
Confluence with MAs: Price is testing MAs — rejection here would add bearish confirmation.
---
✅ Summary of Trade Setup
Element Value
Entry 3,335.03
Stop Loss 3,354.88
Take Profit 3,245.65
Alt Target 3,455.76 (if SL hit)
Risk-Reward ~1:4.5
Bias Bearish (Sell Setup)
Gold Price Setup: Bullish Continuation or Rejection? 🧠 Chart Analysis (XAU/USD – 1H):
Key Structure Highlights:
CHoCH (Change of Character) zones marked both up and down indicate a battle between bulls and bears.
Recent bullish CHoCH followed by a fair value gap (FVG) retest suggests potential continuation to the upside.
Price recently bounced strongly from demand zone, shown by the green arrows and strong candle reaction.
Ichimoku Cloud:
Price is trying to break back above the Kumo (cloud), a sign of bullish momentum building.
However, resistance is still present with the Kijun and Tenkan lines converging.
FVG (Fair Value Gap):
The current price is attempting to fill and break above the FVG zone.
A successful breakout above this area confirms bullish intention.
Fibonacci Levels:
Price is hovering around the 0.5 - 0.618 retracement zone, often a strong reversal or continuation point.
Upside targets lie near the 0.786 retracement (3352) and ultimate target at 3391, a major resistance level.
Risk Management:
Trade setup shows an excellent Risk:Reward ratio.
Stop-loss placed just below the last structure low.
Potential downside to 3290–3258 if breakout fails.
🟢 Possible Next Move:
Bullish Scenario: If price clears the FVG and breaks above 3353, expect continuation to 3391.
Bearish Rejection: If rejected at FVG/0.618 level, watch for a drop back to 3290 or even 3259.

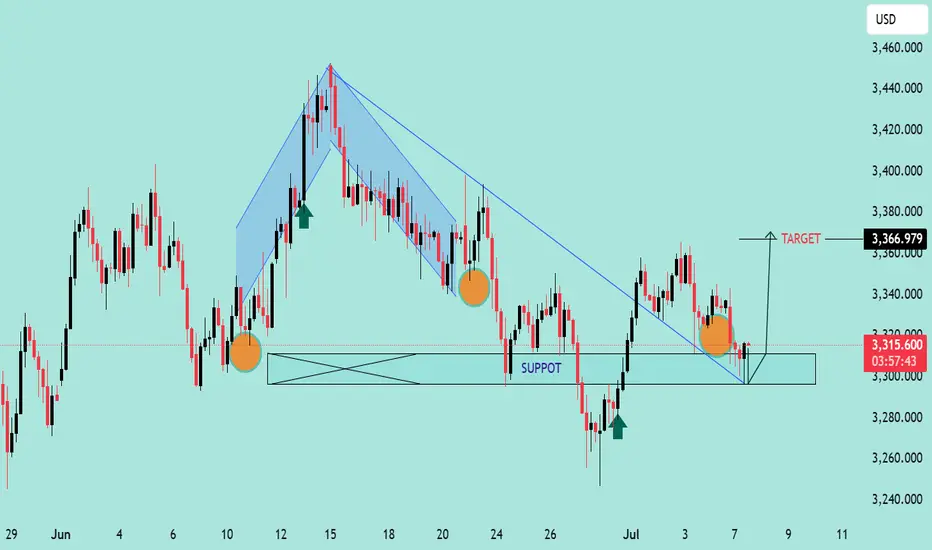
Gold/USD Bullish Reversal from Support Zone Gold/USD Bullish Reversal from Support Zone 🟢📈
Technical Analysis:
Support Zone: Price is consistently respecting the horizontal support range near 3,305 – 3,310, confirming it as a strong demand zone (marked by multiple orange circles and previous bounce reactions).
Bullish Structure: After breaking the descending trendline, the price has retested the trendline and horizontal support zone, forming a higher low — a classic bullish reversal signal.
Target Projection: The measured move projection targets a potential upside near 3,366.979, aligned with previous highs.
Bullish Candlestick Patterns: Green arrows highlight bullish price action at significant reversal points, confirming buyer strength at support.
Harmonic Pattern: The shaded harmonic pattern suggests completion near the previous lows, which aligns with the reversal zone.
Conclusion:
As long as the price holds above the support area and respects the trendline retest, bulls may push toward the projected target. A break below the zone would invalidate this bullish setup.
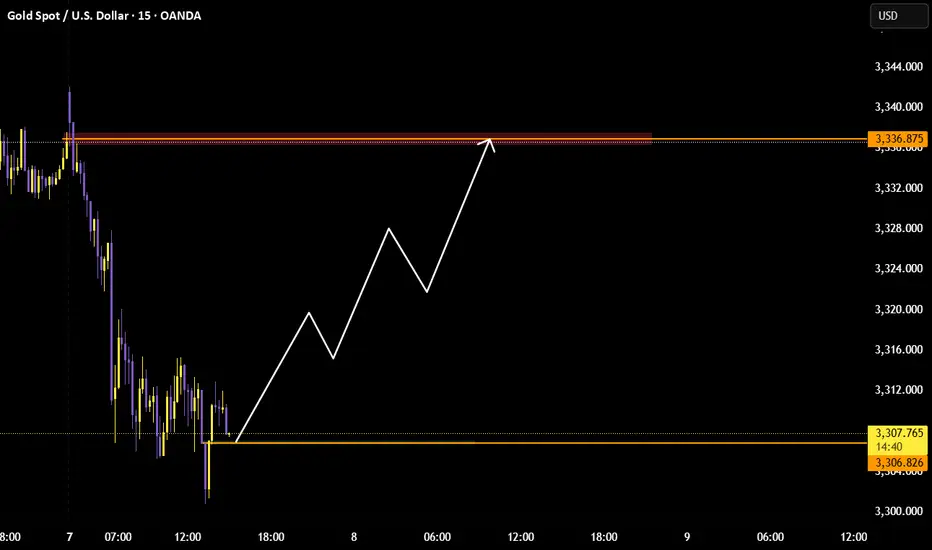
XAUUSD | Expected Swing Movement 07/07/2025Hi,
I am sharing my view on XAUUSD swing movement. After series of consolidation at current level. If gold breaks 3315 and retest the 3306 to 3308 with pullback, it can show sharp upside move upto 3336 to 3338 level where major we can see major supply.
Disclaimer: This is only for educational purpose.
Thanks
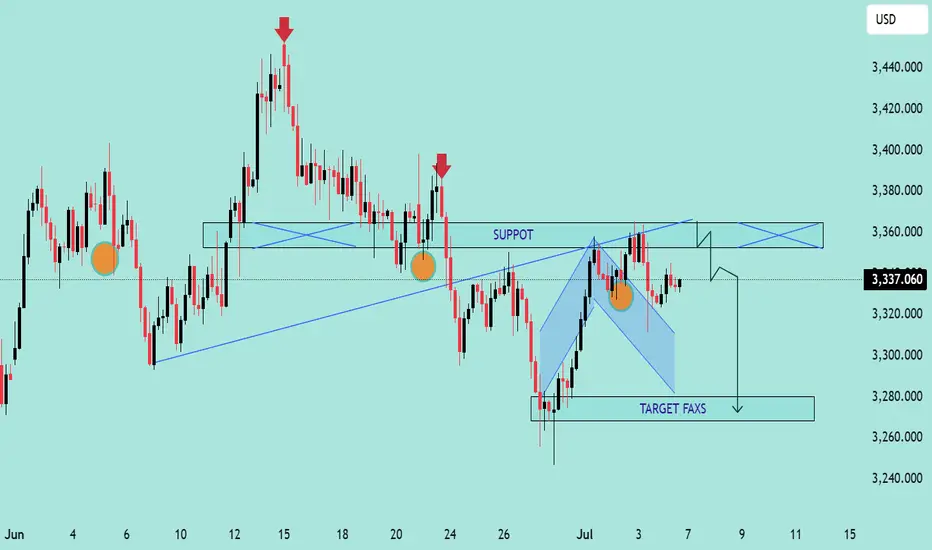
GOLD/USD Bearish Rejection From Resistance Zone – Potential DropGOLD/USD Bearish Rejection From Resistance Zone – Potential Drop Ahead! 🎯
📊 Technical Analysis Summary:
The chart illustrates a bearish setup forming after multiple rejection points near a key resistance zone around 3,360–3,380 USD.
🔍 Key Observations:
🔴 Double Rejection Pattern:
Red arrows highlight strong bearish rejections from resistance.
Indicates sellers are defending this zone aggressively.
🟠 Support Turned Resistance:
The previous support (labelled as "SUPPOT") is now acting as resistance.
Classic bearish retest behavior.
🔷 Bearish Flag Formation:
Price consolidates in a descending flag pattern.
Breakdown below the flag suggests continuation to the downside.
🎯 Target Zone:
If breakdown confirms, price may drop towards target area near 3,275–3,280 USD (marked as “TARGET FAXS”).
🟧 Important Reaction Zones:
Multiple orange circles indicate zones of high reaction – historically significant for both buyers and sellers.
📌 Conclusion:
Unless bulls reclaim the 3,360–3,380 resistance zone convincingly, the bias remains bearish, and the next leg down may target the 3,280 USD area.
🔔 Traders should watch for a clean break below 3,320 to confirm bearish continuation.
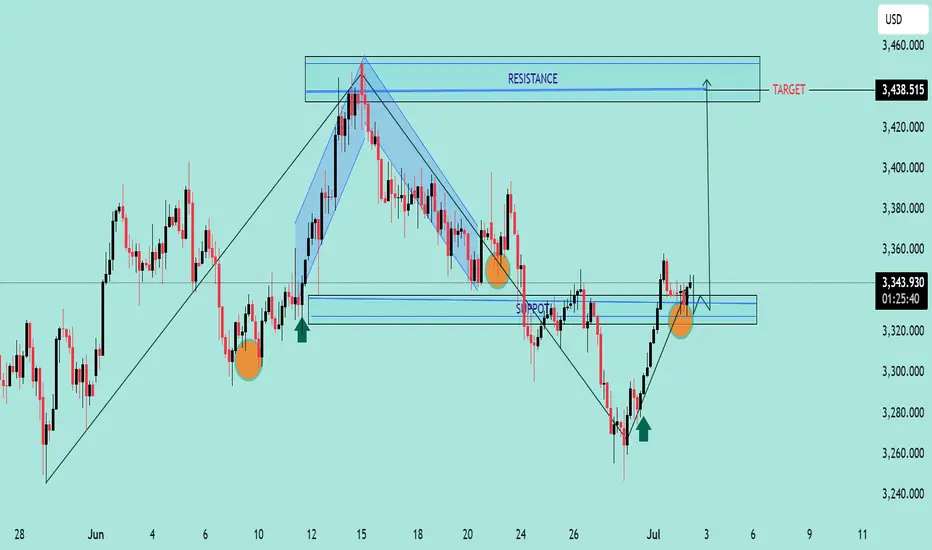
GOLD/USD Bullish Reversal and Breakout Target GOLD/USD Bullish Reversal and Breakout Target 🎯 ✨📈
🔍 Technical Analysis Overview:
The chart illustrates a clear bullish reversal pattern following a strong downtrend, with price reacting from a key support zone (highlighted in blue).
Multiple bullish rejection wicks and confirmation candles (green arrows) indicate buying interest at this support.
The recent higher low formation confirms shift in market structure towards bullish bias.
📌 Key Zones:
🟦 Support Zone: Around 3,280 – 3,320 USD
Price respected this zone multiple times (marked with orange circles), confirming its strength.
🟥 Resistance Zone / Target: 3,430 – 3,460 USD
This area aligns with previous swing highs and is the projected target for this bullish move.
📈 Chart Structure:
Break of descending trendline and bullish momentum above support suggests potential continuation towards the marked target.
Falling wedge breakout also aligns with reversal logic.
🎯 Price Target:
3,438.515 USD (resistance area), as labeled on chart with arrow and breakout projection.
🛑 Invalidation Level:
A sustained break below the support zone (3,280 USD) would invalidate this bullish outlook.
📌 Conclusion:
Gold is exhibiting strong bullish behavior with confirmation from price action and structure break. As long as price sustains above support, the path toward 3,438 remains
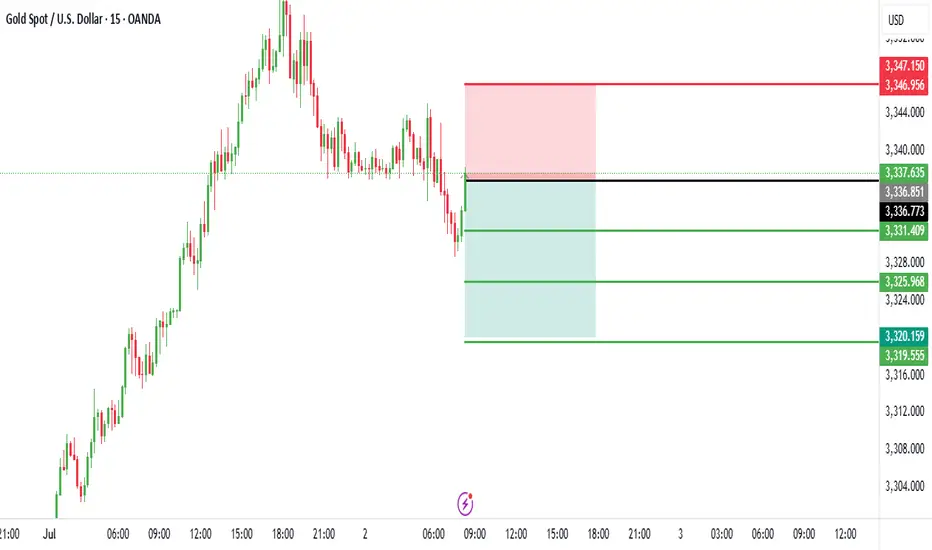
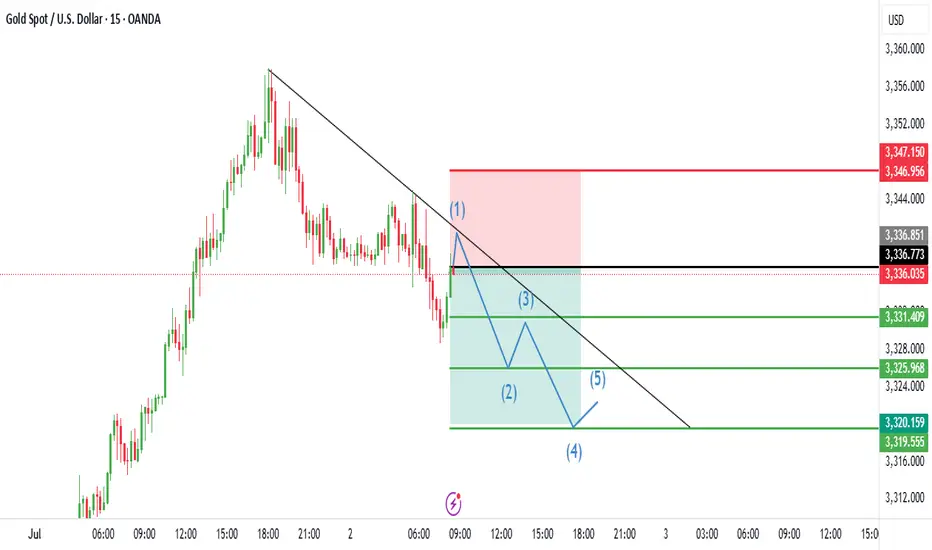
Trading Analysis for Gold Spot / U.S. Dollar (15-Minute Chart)Based on the provided 15-minute chart for Gold Spot / U.S. Dollar (XAU/USD) and the specified data, here’s a suggested trading setup for a sell position:
Current Price and Trend: The current price is not explicitly provided, but the entry price is set at 3,336.00. The chart suggests a potential resistance zone near this level, with a recent uptrend showing signs of exhaustion.
Sell Entry: Enter a sell position at 3,336.00, aligning with the specified entry price where the price may face rejection due to resistance.
Stop Loss: Place a stop loss at 3,346.00, above the recent high, to protect against an upward breakout. This level is 10.00 points above the entry, defining the risk.
Take Profit Levels:
Take Profit 1: 3,331.00, a conservative target 5.00 points below the entry.
Take Profit 2: 3,326.00, a mid-range target 10.00 points below the entry.
Take Profit 3: 3,321.00, a deeper target 15.00 points below the entry, aligning with a potential support zone.
Price Action: The chart indicates a peak near the entry level, with a bearish reversal signal suggested by the candlestick pattern and resistance line.
Risk-Reward Ratio: The distance to the stop loss (10.00 points) compared to the take profit levels (5.00 to 15.00 points) offers a mixed risk-reward profile. Take Profit 2 and 3 provide a 1:1 and 1:1.5 ratio, respectively, making this a balanced short-term trade.
Conclusion
Enter a sell at 3,336.00, with a stop loss at 3,346.00 and take profit levels at 3,331.00, 3,326.00, and 3,321.00. Monitor the price action for confirmation of a downtrend, and be cautious of a potential upward move if the price breaks above the stop loss level.
Trading Analysis for Gold Spot / U.S. Dollar (15-Minute Chart)
Based on the provided 15-minute chart for Gold Spot / U.S. Dollar (XAU/USD) and the specified data, here’s a suggested trading setup for a sell position:
Current Price and Trend: The current price is not explicitly provided, but the entry price is set at 3,336.00. The chart suggests a potential resistance zone near this level, with a recent uptrend showing signs of exhaustion.
Sell Entry: Enter a sell position at 3,336.00, aligning with the specified entry price where the price may face rejection due to resistance.
Stop Loss: Place a stop loss at 3,346.00, above the recent high, to protect against an upward breakout. This level is 10.00 points above the entry, defining the risk.
Take Profit Levels:
Take Profit 1: 3,331.00, a conservative target 5.00 points below the entry.
Take Profit 2: 3,326.00, a mid-range target 10.00 points below the entry.
Take Profit 3: 3,321.00, a deeper target 15.00 points below the entry, aligning with a potential support zone.
Price Action: The chart indicates a peak near the entry level, with a bearish reversal signal suggested by the candlestick pattern and resistance line.
Risk-Reward Ratio: The distance to the stop loss (10.00 points) compared to the take profit levels (5.00 to 15.00 points) offers a mixed risk-reward profile. Take Profit 2 and 3 provide a 1:1 and 1:1.5 ratio, respectively, making this a balanced short-term trade.
Conclusion
Enter a sell at 3,336.00, with a stop loss at 3,346.00 and take profit levels at 3,331.00, 3,326.00, and 3,321.00. Monitor the price action for confirmation of a downtrend, and be cautious of a potential upward move if the price breaks above the stop loss level.
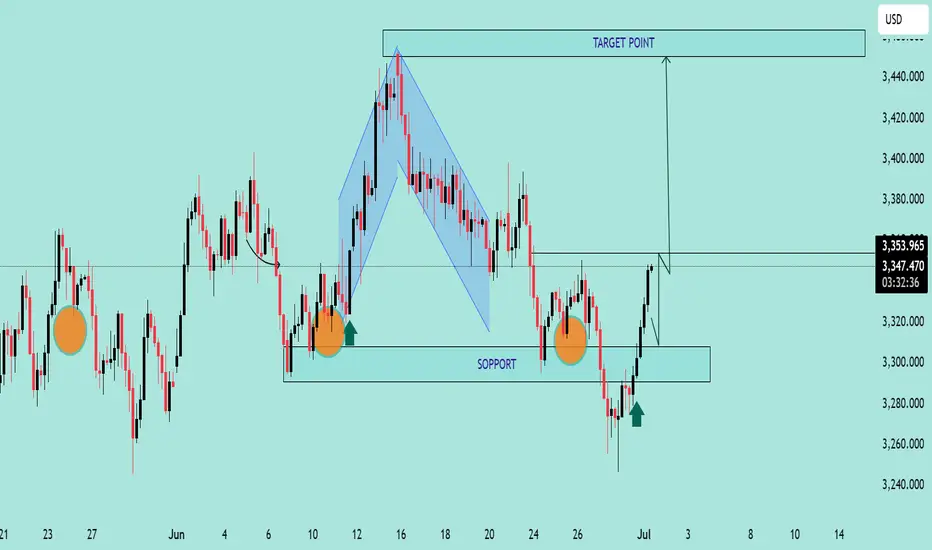
Bullish Reversal Setup on GOLD/USD Bullish Reversal Setup on GOLD/USD 💰📈
🔍 Chart Analysis:
The chart illustrates a clear bullish reversal structure forming off a strong support zone:
📌 Key Observations:
Multiple Rejections at Support 🟠
The price has reacted to the 3,300 - 3,280 USD support zone multiple times, forming a triple bottom pattern, indicating strong buyer interest.
Bullish Harmonic Pattern ✅
A bullish harmonic pattern (likely a Bat or Gartley) completed right at the support level, triggering a strong reversal with a bullish engulfing candle.
Break of Minor Structure 📊
Price broke through minor resistance near 3,340 USD, confirming bullish momentum. The breakout is supported by a retest shown with the green arrow 🟢.
Target Point Identified 🎯
The projected target is 3,460 USD, marked clearly as the next significant resistance zone. This aligns with previous price rejection areas, making it a high-probability target.
📈 Trading Outlook:
✅ Buy Confirmation: Break and retest of 3,340 USD zone.
🎯 Target: 3,460 USD.
🛡️ Support Zone: 3,300 – 3,280 USD (watch for any breakdown below this).
📌 Conclusion:
The chart signals a high-probability bullish continuation, with strong support, harmonic confluence, and structural breakout. Traders may look for buy opportunities on pullbacks with the target set at 3,460 USD. 🚀📊
Trading Analysis for Gold Spot / U.S. Dollar (15-Minute Chart)
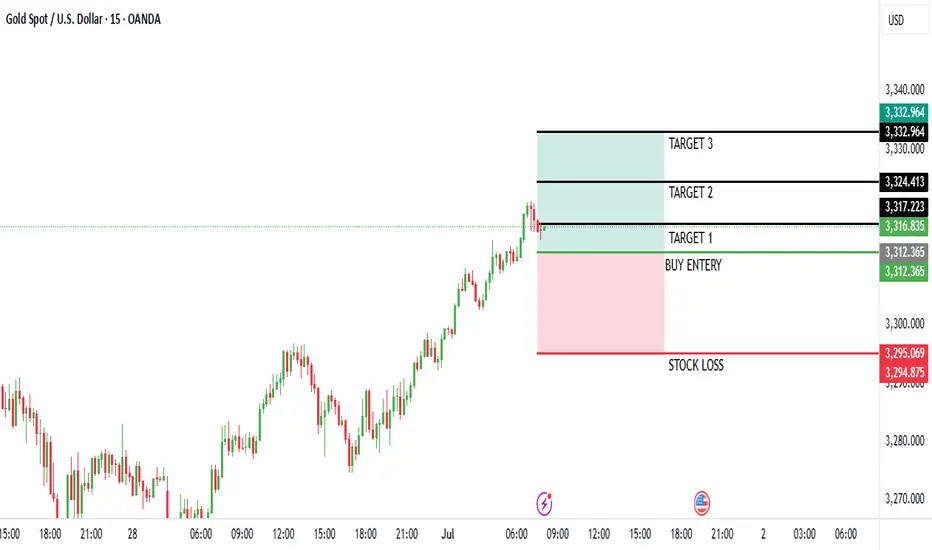
Based on the provided 15-minute chart for Gold Spot / U.S. Dollar (XAU/USD), published by NaviPips on TradingView.com on June 30, 2025, at 17:53 UTC, here’s a suggested trading setup for a buy position:
Current Price and Trend: The current price is 3,241.875, with a slight increase of +0.250 (+0.01%). The chart shows a recent downtrend that appears to be stabilizing near the current level, suggesting a potential reversal point.
Buy Entry: Enter a buy position at 3,312.875 (current price), as it aligns with a support zone where the price has found a base, indicated by the horizontal dashed line and recent consolidation.
Stop Loss: Place a stop loss at 3,295.250, below the recent low, to protect against further downside. This level is approximately 10.625 points below the entry, defining the risk.
Take Profit Levels:
Take Profit 1: 3,317.875, a conservative target about 20.000 points above the entry, aligning with a minor resistance zone.
Take Profit 2: 3,324.750, a mid-range target approximately 31.875 points above the entry.
Take Profit 3: 3,332.500, a deeper target about 45.625 points above the entry, indicating a potential trend reversal.
Price Action: The chart indicates a downtrend with a possible bottoming pattern near the current level. The support zone and upward candlestick suggest a buy opportunity if the price holds.
Risk-Reward Ratio: The distance to the stop loss (10.625 points) compared to the take profit levels (20.000 to 45.625 points) offers a favorable risk-reward ratio, ranging from approximately 1:1.9 to 1:4.3.
Conclusion
Enter a buy at 3,241.875, with a stop loss at 3,295.250 and take profit levels at 3,317.875, 3,324.750, and 3,332.500. Monitor the price action for confirmation of an upward move, and be cautious of a potential continued downtrend if the price breaks below the stop loss level. (Note: I assume "take profot" was a typo for "take profit" and have corrected it accordingly.)
Trading Analysis for Gold Spot / U.S. Dollar (15-Minute Chart)
Based on the provided 15-minute chart for Gold Spot / U.S. Dollar (XAU/USD), published by NaviPips on TradingView.com on June 27, 2025, at 17:53 UTC, here’s a suggested trading setup for a sell position:
Current Price and Trend: The current price is 3,278.385, with a slight increase of +2.500 (+0.08%). The chart shows a recent uptrend that appears to be exhausting near the current level, suggesting a potential reversal point.
Sell Entry: Enter a BUY position at 3,26O TO 3270 (current price), as it aligns with a resistance zone where the price has peaked and started to show signs of decline.
Stop Loss: Place a stop loss at 3,240.526, below the recent low, to protect against an upward continuation. This level is approximately 37.859 points below the entry, defining the risk.
Take Profit Levels:
Take Profit 1: 3,300.898, a conservative target about 35.513 points above the entry.
Take Profit 2: 3,305.203, a slightly lower target approximately 34.818 points above the entry.
Take Profit 3: 3,313.816, a mid-range target about 17.431 points above the entry.
indicating a potential trend reversal.
Price Action: The chart indicates an uptrend with a recent peak followed by a bearish candle, suggesting a possible reversal. The horizontal dashed line marks a key level, supporting the sell setup at the current resistance.
Risk-Reward Ratio: The distance to the stop loss (37.859 points) compared to the take profit levels (14.440 to 35.513 points) presents a mixed risk-reward profile. Take Profit 1 offers a near 1:1 ratio, while Take Profit 4 results in a negative ratio, indicating a high-risk trade against the recent uptrend.
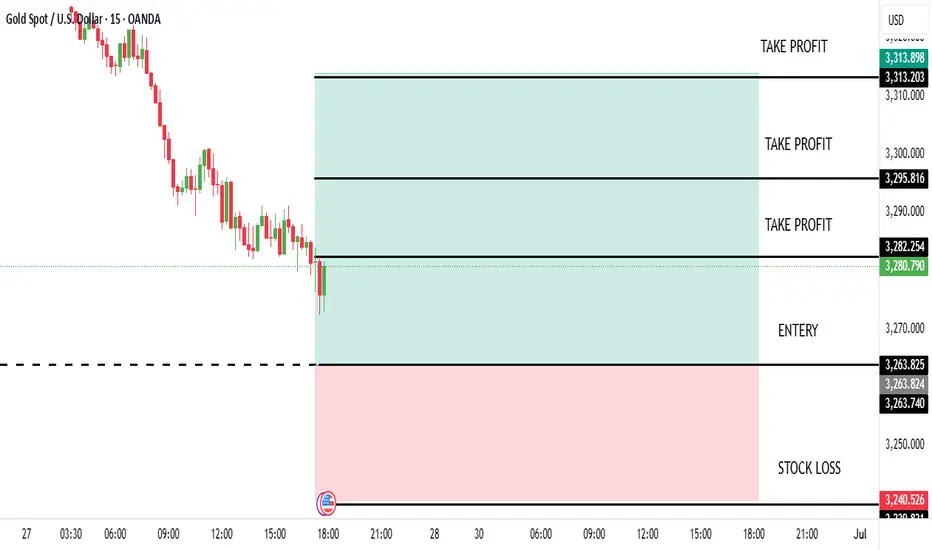
Trading Analysis for Gold Spot / U.S. Dollar (15-Minute Chart)Based on the provided 15-minute chart for Gold Spot / U.S. Dollar (XAU/USD), published by NAVIPIPS on TradingView.com on June 28, 2025, at 20:42 UTC, here’s a suggested trading setup for a sell position. Note that the chart indicates a buy setup, but since you requested a sell analysis, I will interpret a potential sell scenario based on the current price action and levels.
Current Price and Trend: The current price is 3,274.175, with a slight decline of -0.580 (-0.02%). The chart shows a recent uptrend that may be exhausting near the current level, with a potential reversal suggested by the downward trendline.
BUY Entry: Enter a sell position at 3,274.175 (current price), as it aligns with a resistance zone where the price has struggled to break higher, indicated by the buy entry level being a potential reversal point for a sell.
Stop Loss: Place a stop loss at 3,263.740, below the recent low, to protect against an upward continuation. This level is approximately 10.435 points below the entry, defining the risk.
Take Profit Levels:
Take Profit 1: 3,295.816, a conservative target about 21.641 points above the entry.
Take Profit 2: 3,280.254, a mid-range target approximately 6.079 points above the entry.
Take Profit 3: 3,263.825, a deeper target about 10.350 points below the entry, aligning with a support zone.
Price Action: The chart indicates an uptrend with a potential peak near the current level, supported by the downward trendline. The buy setup suggests a bounce, but a sell could be viable if the price fails to sustain upward momentum.
Risk-Reward Ratio: The distance to the stop loss (10.435 points) compared to the take profit levels (6.079 to 21.641 points) presents a mixed risk-reward profile. Take Profit 1 offers a 1:2 ratio, while Take Profit 3 results in a negative ratio, indicating a high-risk sell against the buy setup.
Conclusion
Enter a BUY at 3,274.175, with a stop loss at 3,263.740 and take profit levels at 3,295.816, 3,280.254, and 3,263.825. This is a counter-trend trade against the indicated buy setup, so confirm the reversal with additional indicators (e.g., candlestick patterns or RSI) and be prepared for potential upward momentum if the price breaks above the stop loss level.

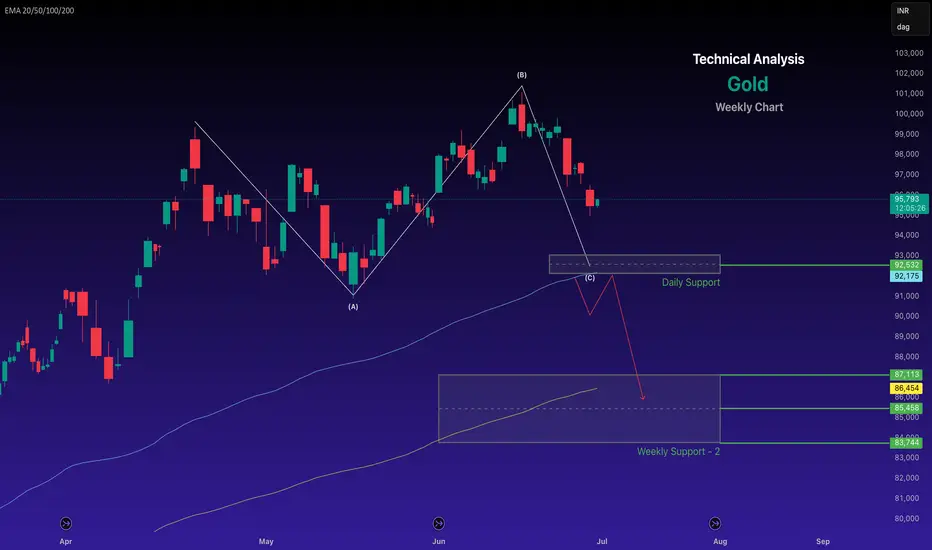
Gold retains a bearish trend after breaching support.Weekly Technical Analysis for Gold
Chart for the reference
- Disclaimer --
This analysis is based on recent technical data and market sentiment from web sources. It is for informational purposes only and not financial advice. Trading involves high risks, and past performance does not guarantee future results. Always conduct your own research or consult a SEBI-registered advisor before trading.
#Boost and comment will be highly appreciated
XAU/USD Analysis Today (June 28, To 04 July 2025)XAU/USD Analysis Today (June 28, 2025)
As of June 28, 2025, the Gold Spot/US Dollar (XAU/USD) pair is trading around $3,295–$3,330, reflecting a corrective phase after recent volatility. Below is a detailed analysis of the current market dynamics, incorporating technical and fundamental factors, as well as sentiment from recent sources.
# Price and Market Overview
Current Price: Approximately $3,295–$3,330, with a slight downward bias following a recent peak near $3,450. The pair has been consolidating after a sharp decline triggered by easing geopolitical tensions.
Recent Performance: Gold fell by ~0.12%–0.42% in recent sessions, settling below the key $3,300 support level intraday, with volatility driven by U.S. economic data and Middle East developments.
Market Sentiment: The 14-day RSI is around 49.83–51.66, indicating neutral conditions, neither overbought nor oversold. Volatility over the past 30 days has been moderate at ~1.46%.
Technical Analysis
Support and Resistance Levels:
Support: Key support lies at $3,280–$3,240 (recent low and pivot point), with stronger support at $3,250 and $3,200 if selling pressure persists. A break below $3,280 could target $3,040–$3,100.
Resistance: Immediate resistance is at $3,300–$3,350, with a stronger barrier at $3,375–$3,400. A sustained break above $3,440 could signal a bullish reversal toward $3,488–$3,500.
Indicators:
Moving Averages: The 20-day EMA ($3,349.73) and 10-day EMA ($3,356.43) suggest a short-term sell signal, while the 50-day SMA ($3,323.61) and 100-day SMA ($3,162.10) indicate a buy signal, reflecting mixed trends. The 200-day SMA (~$2,919.95) supports a long-term bullish trend.
Chart Patterns: A bear flag pattern was noted on the 1-hour chart, signalling a continuation of the downtrend if $3,280 support fails. However, a potential reversal pattern is forming on the 15-minute chart near $3,313, suggesting a possible short-term bounce.
Chart for your reference
- Disclaimer --
This analysis is based on recent technical data and market sentiment from web sources. It is for informational purposes only and not financial advice. Trading involves high risks, and past performance does not guarantee future results. Always conduct your own research or consult a SEBI-registered advisor before trading.
#Boost and comment will be highly appreciated
